10 Best Profiling Tools To Boost Performance in 2026

10 Best Profiling Tools Shortlist


Profiling tools help you measure and analyze how your software performs so you can find slowdowns and fix them.
If you’ve ever tried to diagnose lag, memory leaks, or CPU spikes by staring at logs, you know how frustrating it can be. These tools give you a clear view of what’s really happening under the hood so you don’t have to guess.
I’ve worked with both open-source and commercial profilers across different tech stacks, and I know what makes one useful in real-world scenarios. In this guide, I’ll share the tools I trust and explain why they’re worth considering.
Why Trust Our Software Reviews
We’ve been testing and reviewing software since 2023. As tech leaders ourselves, we know how critical and difficult it is to make the right decision when selecting software.
We invest in deep research to help our audience make better software purchasing decisions. We’ve tested more than 2,000 tools for different tech use cases and written over 1,000 comprehensive software reviews. Learn how we stay transparent & our software review methodology.
Best Profiling Tools Summary
| Tool | Best For | Trial Info | Price | ||
|---|---|---|---|---|---|
| 1 | Best for detailed performance insights | Free plan + free trial + free demo available | From $26/month (billed annually) | Website | |
| 2 | Best for application performance monitoring | 14-day free trial | From $15/host/month (billed annually) | Website | |
| 3 | Best for customer data management and integration | Free plan available | From $120/month | Website | |
| 4 | Best for memory and CPU python profiling | Not available | Pricing upon request. | Website | |
| 5 | Best for call stack visualization in Python | Not available | Pricing upon request. | Website | |
| 6 | Best for sampling Python profiler utility | Not available | Since py-spy is an open-source tool, its core features are free. | Website | |
| 7 | Best for performance monitoring with error tracking | Not available | From $26/user/month (billed annually). | Website | |
| 8 | Best for PHP debugging and development tool | Not available | Pricing upon request. | Website | |
| 9 | Best for industrial product profiling | Not available | Pricing upon request. | Website | |
| 10 | Best for live code tracing on development workstations | Not available | Pricing upon request. | Website |
-

TestDevLab
Visit Website -
Site24x7
Visit WebsiteThis is an aggregated rating for this tool including ratings from Crozdesk users and ratings from other sites.4.7 -
GitHub Actions
Visit WebsiteThis is an aggregated rating for this tool including ratings from Crozdesk users and ratings from other sites.4.8


Best Profiling Tools Reviews
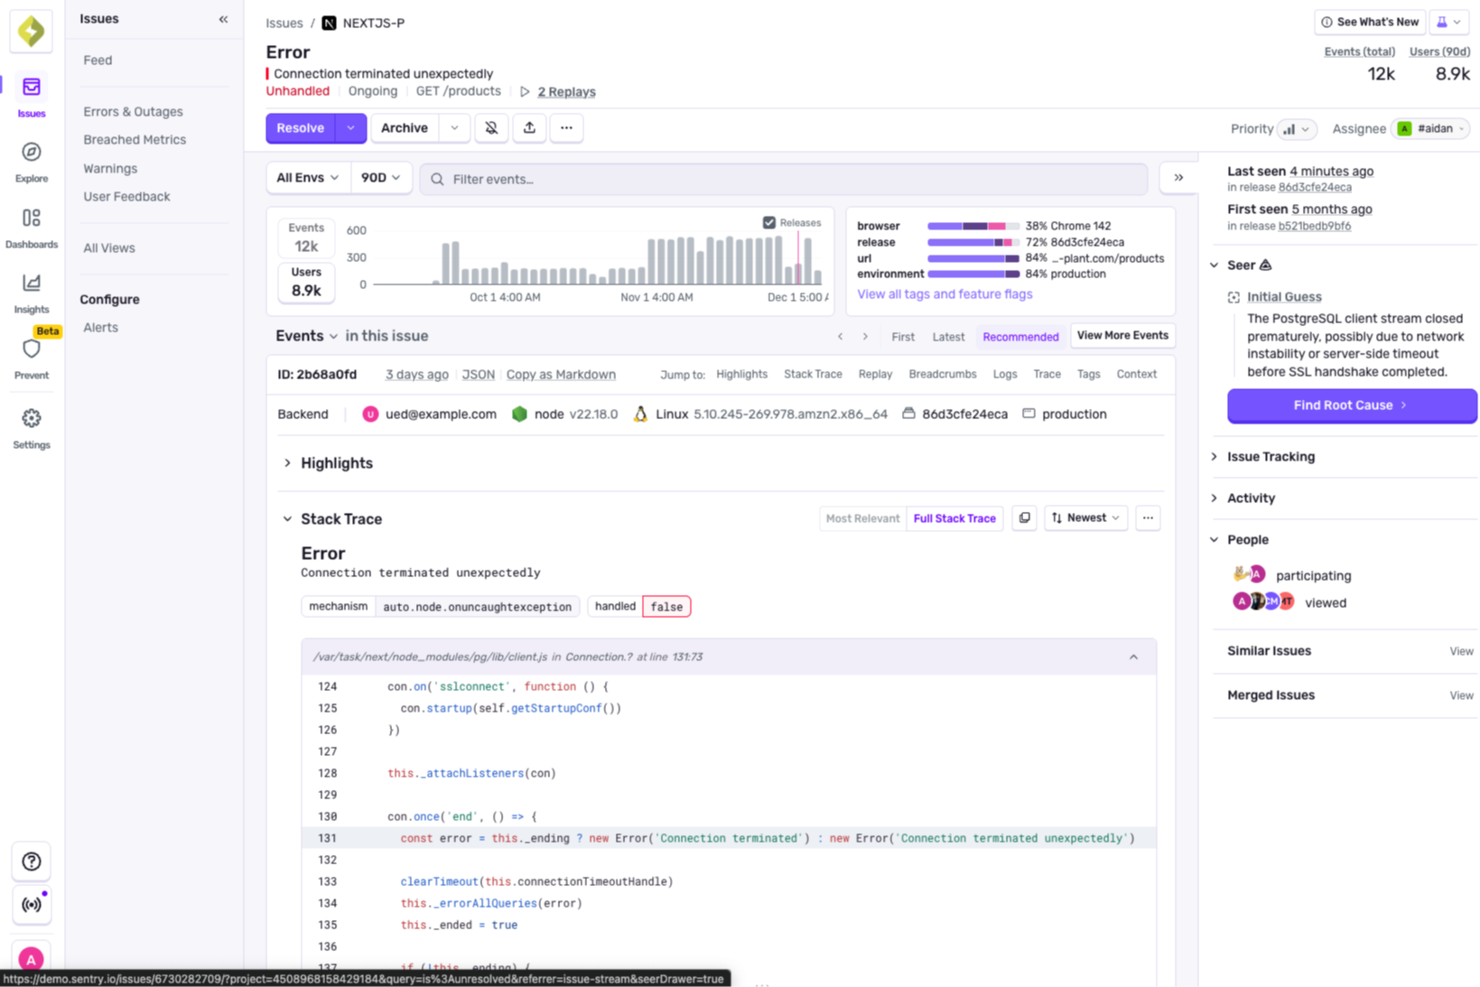
For developers seeking a reliable solution to enhance application performance, Sentry offers an integrated approach to error monitoring and profiling. It caters to web and mobile developers, providing tools to uncover performance bottlenecks and streamline the debugging process. By addressing challenges like error tracking and performance insights, Sentry ensures a smoother development experience.
Why I Picked Sentry
I picked Sentry for its unique ability to deliver detailed performance insights through its profiling feature. By capturing function calls and execution times, Sentry allows you to identify and address performance issues without the need for custom instrumentation. The tool's seamless integration with GitHub and Slack further supports your development workflow by providing context for fixes and facilitating smoother collaboration. This makes Sentry an ideal choice for teams looking to optimize application performance and reduce debugging time.
Sentry Key Features
In addition to its profiling capabilities, Sentry offers several features that enhance its utility as a profiling tool:
- Error Monitoring: Automatically captures errors in your application, providing detailed reports to help you debug issues efficiently.
- Session Replay: Allows you to view user sessions to understand the context of errors and improve user experience.
- AI Debugger (Seer): Analyzes logs and traces to identify root causes of failures, offering AI-driven suggestions for fixes.
- Tracing: Provides insights into slow requests and performance bottlenecks, helping you optimize your application's speed.
Sentry Integrations
Integrations include GitHub, Slack, Jira, GitLab, Bitbucket, Trello, Azure DevOps, Vercel, and AWS Lambda.
Pros and Cons
Pros:
- Real-time production error monitoring
- Automated unit test generation
- AI flags issues in pull requests
Cons:
- AI suggestions may need review
- Initial setup can be complex
New Product Updates from Sentry

Sentry Adds Heatmaps to Application Metrics
Sentry introduced heatmaps for Application Metrics to visualize metric value distributions over time, helping teams spot patterns like latency bursts and use heatmaps in Custom Dashboards. For more information, visit Sentry's official site.
 .
.
Datadog is a robust cloud-scale monitoring platform that centralizes data from applications, infrastructure, and logs. Specifically tailored for modern cloud environments, it provides detailed insights into application performance, ensuring optimal uptime and swift issue detection.
Why I Picked Datadog: Choosing Datadog was a decision influenced by its holistic approach to performance monitoring. Compared with other tools, Datadog consistently showcased the capacity to provide in-depth insights without compromising user-friendliness. I think that for businesses prioritizing application performance monitoring, Datadog is undeniably a frontrunner.
Standout features & integrations:
Datadog shines with features such as real-time dashboards, anomaly and outlier detection, and end-to-end request tracing. Powerful visualization tools enhance its monitoring capabilities. Integrations-wise, Datadog boasts compatibility with various platforms, including AWS, Docker, Slack, and many more, facilitating a comprehensive monitoring experience.
Pros and Cons
Pros:
- Efficient anomaly detection and alerting systems
- Wide array of integrations with popular platforms
- Comprehensive monitoring across applications, infrastructure, and logs
Cons:
- Initial setup can be time-consuming for complex infrastructures.
- Some advanced features come at an additional cost
- Might have a learning curve for newcomers

Segment offers a platform that consolidates, manages, and integrates customer data from various touchpoints. Designed to unify data sources, it serves as a prime solution for businesses keen on a streamlined approach to customer data management and integration.
Why I Picked Segment: I selected Segment for this list after an extensive comparison with similar platforms. My judgment was swayed by its robust architecture that focuses not just on collecting data but also on validating and ensuring its accuracy. For businesses seeking a comprehensive solution to customer data management combined with absolute integration, Segment stands out.
Standout features & integrations:
Segment's prime features include real-time data collection from various channels and validation tools that ensure the integrity of the collected data. Additionally, its data pipelines are built to consolidate and route data efficiently. On the integrations front, Segment collaborates with many platforms, including but not limited to analytics tools, marketing automation software, and CRM systems.
Pros and Cons
Pros:
- Broad range of integrations with essential business tools
- Validation tools that ensure data integrity
- Efficient data collection from multiple touchpoints
Cons:
- Pricing might be on the higher side for budget-conscious businesses.
- Requires a certain level of expertise for full utilization
- Might be overkill for smaller businesses or startups

Scalene is a top tool for Python developers to analyze CPU and memory usage.
Why I Picked Scalene: Scalene entered my radar when I sought an efficient profiling tool primarily for Python. In comparing its features against other contenders, Scalene stood out with its high precision in pinpointing memory and CPU usage. I determined it's best for memory and CPU Python profiling because it uniquely combines both these metrics, allowing developers to view a cohesive picture of their application's performance.
Standout features & integrations:
Scalene is particularly adept at delivering fine-grained performance metrics without heavy overhead. Its distinctiveness lies in its ability to profile memory usage at every line of code, something not commonly found in other tools. Scalene offers compatibility with Java applications for integrations, making it versatile for projects that use both Python and Java.
Pros and Cons
Pros:
- Captures both memory and CPU metrics efficiently
- Compatible with Java applications
- Precise memory usage profiling at the code line level
Cons:
- Some advanced features may be overwhelming for casual users
- Limited support for SQL and API profiling compared to specialized tools
- Might have a steeper learning curve for beginners

Pyinstrument is a Python profiler designed to provide developers with a clear and detailed visualization of their program's call stack. With its ability to represent intricate call hierarchies visually, it's evident that it excels for call stack visualization in Python.
Why I Picked Pyinstrument: I chose Pyinstrument after thoroughly comparing it with other tools in its category. Its unique ability to visually articulate complex call hierarchies caught my attention. I judged it superior in presenting Python call stacks, reinforcing my opinion that it's the best tool for visualizing Python call structures.
Standout features & integrations:
Pyinstrument offers a rich user interface for call stack visualization, aiding business intelligence efforts. Its dashboards provide developers with comprehensive overviews of their code’s behavior. In addition to its primary features, Pyinstrument integrates well with data cleansing and data matching tools, augmenting its versatility for data-driven projects.
Pros and Cons
Pros:
- Effective integrations with data cleansing and matching tools
- Comprehensive dashboards offer an overarching view of code performance
- Detailed call stack visualization enhances business intelligence processes
Cons:
- Limited support for non-Python languages
- Requires manual configuration for certain advanced features
- Might not be suitable for real-time profiling

py-spy is a tool engineered to profile Python applications by sampling their execution. It stands out as an asset for developers aiming for detailed memory profiling without disturbing the normal operation of their Python apps.
Why I Picked py-spy: When determining the optimal tools for Python profiling, py-spy was a natural selection for me. What piqued my interest was its non-intrusive approach to memory profiling and its ability to extract metadata efficiently. In comparison with other tools, it was evident that py-spy was distinct in its capabilities, solidifying its position as the best tool for sampling Python profiler utility.
Standout features & integrations:
One of py-spy's pivotal features is its ability to carry out memory profiling without requiring modifications to the code or restarting the application. The tool is also adept at capturing rich metadata from the profiling samples, which enhances the depth of insights obtained. While py-spy primarily focuses on Python, it's also worth noting its open-source data integrations that offer flexibility and transparency.
Pros and Cons
Pros:
- Leveraging open source data, it ensures transparency and community-backed improvements
- Effectively captures and provides insightful metadata
- Allows for non-intrusive memory profiling
Cons:
- Lack of a dedicated support system, relying primarily on community assistance.
- As it's specifically designed for Python, versatility across multiple languages is limited
- Some advanced features may require a steep learning curve for beginners

Sentry Profiling is a tool engineered to help developers monitor application performance while simultaneously tracking errors. This combination aids developers in identifying bottlenecks in the source code, thus ensuring a smooth user experience.
Why I Picked Sentry Profiling: In the vast sea of profiling tools, Sentry Profiling caught my attention. My determination was based on its dual ability to offer performance monitoring while keeping an eye on errors. After comparing it with other tools, Sentry Profiling is truly best suited for those who prioritize performance monitoring combined with error tracking.
Standout features & integrations:
One of Sentry Profiling's cardinal features is its deep dive into source code, allowing efficient troubleshooting. Additionally, its built-in error tracking mechanism ensures developers catch anomalies before they impact the user experience. For integrations, Sentry integrates with many platforms, including GitHub, Slack, and Jira, ensuring developers have a cohesive ecosystem.
Pros and Cons
Pros:
- Wide range of integrations enhancing the tool's utility
- Dual capabilities: performance monitoring and error tracking
- Comprehensive insights into source code for efficient troubleshooting
Cons:
- Some users report a steeper learning curve compared to other profiling tools.
- Annual billing might not be preferred by all users
- Might be over-complex for small projects or beginners

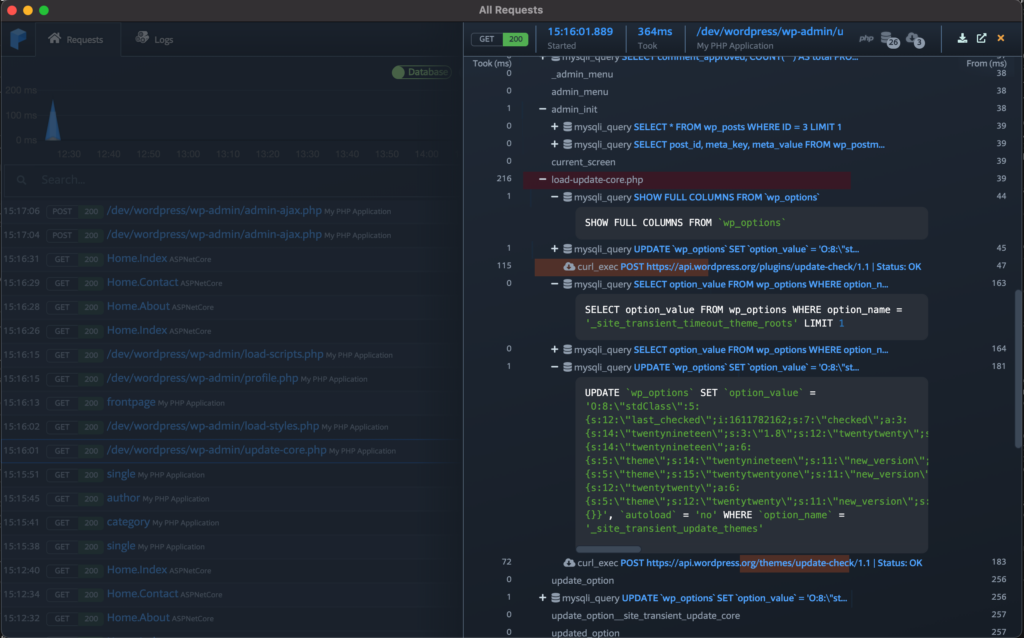
Xdebug, tailored specifically for PHP, is an essential tool with detailed debugging capabilities. Addressing the challenges faced during PHP development solidifies its position as the top choice for those requiring a PHP-specific debugging and development solution.
Why I Picked Xdebug: When choosing tools for PHP debugging, Xdebug consistently emerged as a front-runner in my evaluations. Its precision in identifying performance issues and unparalleled depth in the PHP runtime environment set it apart. I recognized these qualities and confidently determined Xdebug to be the best for PHP debugging and development.
Standout features & integrations:
Xdebug shines with its ability to pinpoint performance issues swiftly, allowing developers to rectify them effectively. Its features provide insights into runtime allocation, ensuring resources are used efficiently. Furthermore, its compatibility with numerous plugins ensures a smoother and more integrated development experience.
Pros and Cons
Pros:
- Integration with multiple plugins
- Detailed insights into runtime allocation
- Expertly identifies performance issues in PHP applications
Cons:
- Configuration can be intricate for complex applications
- May introduce overhead when running on production servers
- Steeper learning curve for beginners

SPX, an innovative data profiling tool, is built primarily to cater to the nuanced needs of industrial product profiling. Given the complexities of this domain, SPX is uniquely positioned to offer insightful profiling capabilities, reinforcing its "best for" industrial product tag.
Why I Picked SPX: During my rigorous selection process, SPX stood out as a beacon. While comparing various tools, SPX's tailored approach to industrial products made it shine. Its commitment to data quality and comprehensive profiling capabilities drove me to determine that, in the realm of industrial profiling, SPX is unmatched.
Standout features & integrations:
SPX boasts robust data quality features that ensure reliable and actionable profiling. Its IDE (Integrated Development Environment) support makes it versatile and user-friendly. Furthermore, it provides integrations with several .NET platforms, expanding its usability and making it compatible with various enterprise applications.
Pros and Cons
Pros:
- Integrates well with .NET platforms
- Strong emphasis on data quality
- Dedicated focus on industrial product profiling
Cons:
- Can be perceived as niche, given its industry-specific focus
- Requires a specific skill set to maximize its potential
- May not be suitable for non-industrial profiling
Prefix provides developers with a clear window into the behavior of their code in real time. Specifically tailored for development workstations, it offers real-time live code tracing capabilities, making it an invaluable tool for those wanting a real-time perspective on their code's performance, aligning perfectly with its "best for" statement.
Why I Picked Prefix: Prefix stood out in the myriad of tools I've sifted through. Its unique focus on live code tracing, specially tailored for development environments, caught my eye. It allows developers to trace code live on their workstations, so I determined it to be the best for this specific use case.
Standout features & integrations:
Prefix's strong suit is its live code profiling feature, offering immediate feedback on code behavior. Its big data capabilities also help developers understand large datasets in real-time. Regarding integrations, Prefix fits into many automation workflows, catering to the needs of modern development cycles.
Pros and Cons
Pros:
- Efficient integration with various automation platforms
- Strong big data analysis capabilities
- Live code tracing directly on development workstations
Cons:
- Not as comprehensive in features as some dedicated profiling tools
- Requires a certain level of familiarity with code profiling to harness its full potential
- Might be less suitable for production environment monitoring
Other Noteworthy Profiling Tools
Below is a list of additional profiling tools that I shortlisted, but did not make it to the top 10. Definitely worth checking them out.
- Pyroscope
For continuous profiling in real-time
- Bubbleprof
For visualizing Node.js async operations
- Orbit Profiler
For game development and graphics applications
- Uber jvm Profiler
-profiling-tools
- Pixis Performance
-profiling-tools
- CheckPOS
-profiling-tools
- Performance Cloud
-profiling-tools
- VisualVM
-profiling-tools
- vprof
-profiling-tools
- Tracy
-profiling-tools


Related Reviews
Profiling Tool Selection Criteria
When selecting the best profiling tools to include in this list, I considered common buyer needs and pain points like performance bottleneck identification and integration with existing development environments. I also used the following framework to keep my evaluation structured and fair:
Core Functionality (25% of total score)
To be considered for inclusion in this list, each solution had to fulfill these common use cases:
- Analyze CPU usage
- Monitor memory allocation
- Detect performance bottlenecks
- Profile multithreaded applications
- Generate detailed reports
Additional Standout Features (25% of total score)
To help further narrow down the competition, I also looked for unique features, such as:
- Real-time data analysis
- Integration with CI/CD pipelines
- Support for distributed systems
- Customizable dashboards
- Advanced visualization tools
Usability (10% of total score)
To get a sense of the usability of each system, I considered the following:
- Intuitive user interface
- Easy navigation
- Minimal learning curve
- Customizable settings
- Responsive design
Onboarding (10% of total score)
To evaluate the onboarding experience for each platform, I considered the following:
- Availability of training videos
- Interactive product tours
- Access to templates
- Chatbot assistance
- Live webinars
Customer Support (10% of total score)
To assess each software provider’s customer support services, I considered the following:
- 24/7 availability
- Multiple support channels
- Response time
- Knowledgeable staff
- Availability of FAQs
Value For Money (10% of total score)
To evaluate the value for money of each platform, I considered the following:
- Competitive pricing
- Tiered subscription options
- Free trial availability
- Cost vs. features offered
- Discounts for annual plans
Customer Reviews (10% of total score)
To get a sense of overall customer satisfaction, I considered the following when reading customer reviews:
- Overall satisfaction rating
- Commonly mentioned pros and cons
- Frequency of updates
- User-reported issues
- Testimonials from similar industries
How to Choose Profiling Tools
It’s easy to get bogged down in long feature lists and complex pricing structures. To help you stay focused as you work through your unique software selection process, here’s a checklist of factors to keep in mind:
| Factor | What to Consider |
|---|---|
| Scalability | Can the tool grow with your team? Consider if it handles increased data loads and user numbers without sacrificing performance. Make sure it fits both current and future needs. |
| Integrations | Does it easily connect with your existing systems? Check compatibility with development environments and other tools your team uses daily. Avoid solutions that require complex workarounds to integrate. |
| Customizability | Can you tailor the tool to fit your workflow? Look for options to customize dashboards, reports, and alerts. Ensure it aligns with your team's processes without needing extensive configuration. |
| Ease of use | Is the tool intuitive for all team members? A steep learning curve can hinder productivity. Look for simple navigation and clear instructions. Test the interface to see if it's straightforward for new users. |
| Implementation and onboarding | How quickly can your team start using it? Consider the availability of training resources and support during setup. A smooth onboarding process can make all the difference in adoption and effectiveness. |
| Cost | Does the pricing fit your budget? Evaluate the total cost, including hidden fees for additional features or support. Compare subscription plans and consider long-term affordability. |
| Security safeguards | Are your data and operations secure? Verify compliance with data protection standards and look for features like encryption and access controls. Don't compromise on security to save costs. |
| Support availability | Is help available when you need it? Check the vendor's support hours and channels. Quick response times and knowledgeable assistance can greatly impact your team's experience with the tool. |
What Is A Profiling Tool?
Profiling tools are software that help you measure how your code performs so you can spot slow functions, memory issues, or inefficient resource use. They're mostly used by developers and engineers who need to understand how their applications behave during runtime and where performance problems might be hiding.
Call graphs, memory usage tracking, and CPU sampling features help with pinpointing bottlenecks, understanding system load, and improving response times. These tools make it easier to optimize applications without guessing what's slowing things down.
Features
When selecting profiling tools, keep an eye out for the following key features:
- CPU usage analysis: Helps identify which parts of the application consume the most processing power, aiding in optimization.
- Memory allocation monitoring: Tracks memory usage to detect leaks and inefficiencies, ensuring smoother performance.
- Performance bottleneck detection: Pinpoints slow areas in the code, allowing for targeted improvements.
- Integration capabilities: Connects seamlessly with existing development environments, enhancing workflow.
- Customizable dashboards: Allows users to tailor views and reports to specific needs, improving usability.
- Real-time data analysis: Provides immediate insights into application performance, facilitating quick decision-making.
- Advanced visualization tools: Offers graphical representations of data, making complex information easier to understand.
- Security safeguards: Ensures data protection through encryption and access controls, maintaining user trust.
- Interactive product tours: Guides new users through features, improving the onboarding experience.
- 24/7 support availability: Provides round-the-clock assistance to address issues promptly, enhancing user satisfaction.
Benefits
Implementing profiling tools provides several benefits for your team and your business. Here are a few you can look forward to:
- Improved performance: By identifying CPU and memory usage issues, these tools help optimize application speed and efficiency.
- Enhanced debugging: Performance bottleneck detection allows developers to quickly find and fix problematic code sections.
- Better resource management: Memory allocation monitoring ensures efficient use of system resources, preventing waste and improving stability.
- Increased productivity: Real-time data analysis and customizable dashboards streamline workflows, allowing teams to focus on critical tasks.
- Greater security: Features like encryption and access controls protect sensitive data, maintaining compliance and trust.
- Simplified onboarding: Interactive product tours and training resources make it easier for new users to get up to speed quickly.
- Reliable support: With 24/7 availability, customer support ensures that any issues are addressed promptly, minimizing downtime.
Costs & Pricing
Selecting profiling tools requires an understanding of the various pricing models and plans available. Costs vary based on features, team size, add-ons, and more. The table below summarizes common plans, their average prices, and typical features included in profiling tools solutions:
Plan Comparison Table for Profiling Tools
| Plan Type | Average Price | Common Features |
|---|---|---|
| Free Plan | $0 | Basic CPU and memory monitoring, limited reporting, and community support. |
| Personal Plan | $10-$30/user/month | Advanced performance analysis, customizable dashboards, and email support. |
| Business Plan | $50-$100/user/month | Real-time data analysis, integration capabilities, enhanced security features, and priority support. |
| Enterprise Plan | $150-$300/user/month | Comprehensive monitoring, dedicated account manager, advanced security options, and 24/7 premium support. |
Most Common Questions Regarding Profiling Tools (FAQs)
How do profiling tools help with performance optimization?
Profiling tools analyze your code to find performance bottlenecks, allowing you to optimize and improve efficiency. They provide insights into CPU usage, memory allocation, and other metrics that can slow down your application. By using these tools, you can make targeted improvements.
How do profiling tools handle large-scale applications?
Profiling tools designed for enterprise use can handle large-scale applications by providing detailed analysis and high-level insights. They can manage increased data loads and user numbers without sacrificing performance. Check for features like distributed system support if you’re working with large applications.
How can profiling tools improve my development process?
Profiling tools can enhance your development process by quickly identifying and resolving performance issues. They provide real-time data and customizable reports, helping you make informed decisions. This results in more efficient code and a smoother development cycle.
Is it worth investing in a premium profiling tool?
While free tools can be effective for smaller projects or basic profiling needs, investing in a premium tool becomes essential for larger, more complex applications. Premium tools often offer more advanced features, better support, and scalability options, making them valuable for ensuring optimal application performance.
Can profiling tools be used for any programming language?
Most profiling tools support multiple programming languages, but not all tools support all languages. Before choosing a tool, it’s crucial to check its compatibility with the specific languages used in your application.
What’s Next:
If you're in the process of researching profiling tools, connect with a SoftwareSelect advisor for free recommendations.
You fill out a form and have a quick chat where they get into the specifics of your needs. Then you'll get a shortlist of software to review. They'll even support you through the entire buying process, including price negotiations.