10 Best Code Visualization Tools Reviewed in 2026

Best Code Visualization Tools Shortlist


If you’ve ever inherited a messy codebase, struggled to explain your architecture to a new hire, or hit a wall during debugging because nothing makes sense—code visualization tools were built for you. It’s not just about diagrams—it’s about turning abstract logic into something your team can actually reason about.
Over the past several years, I’ve worked with engineering teams across fast-growing dev orgs and legacy systems alike, helping them evaluate tools that reveal how their code really works. I’ve tested everything from lightweight file mappers to advanced graph-based visualizers, looking for what genuinely improves understanding—not what just looks nice in a presentation.
In this guide, I’ll share the code visualization tools that stood out—tools that help you map complexity, reduce onboarding time, and make debugging and collaboration more intuitive.
Why Trust Our Software Reviews
We’ve been testing and reviewing software since 2023. As tech leaders ourselves, we know how critical and difficult it is to make the right decision when selecting software.
We invest in deep research to help our audience make better software purchasing decisions. We’ve tested more than 2,000 tools for different tech use cases and written over 1,000 comprehensive software reviews. Learn how we stay transparent & our software review methodology.
Best Code Visualization Tools Summary
This comparison chart summarizes pricing details for my top code visualization tools selections to help you find the best one for your budget and business needs.
| Tool | Best For | Trial Info | Price | ||
|---|---|---|---|---|---|
| 1 | Best for uncovering code vulnerabilities | Free plan + 14-day free trial + free demo available | From $34/month | Website | |
| 2 | Best for collaborative code diagrams | Free trial + free plan available | From $9/month | Website | |
| 3 | Best for behavioral code analysis | Enterprise (Pricing Upon Request) | $21/month | Website | |
| 4 | Best for developer onboarding | Free demo available | Pricing upon request | Website | |
| 5 | Best for Visual Studio integration | Not available | Free | Website | |
| 6 | Best for remote development | Free plan available | From $0.18/2 core machine/2 usage multiplier | Website | |
| 7 | Best for 3D code visualization | Not available | Free to use | Website | |
| 8 | Best for visualizing project history | Not available | Free to use | Website | |
| 9 | Best for storytelling with code | Not available | Free to use | Website | |
| 10 | Best for large codebases | Free trial available + free demo | From $99/user/month (billed annually) | Website |
-

TestDevLab
Visit Website -
Site24x7
Visit WebsiteThis is an aggregated rating for this tool including ratings from Crozdesk users and ratings from other sites.4.7 -
GitHub Actions
Visit WebsiteThis is an aggregated rating for this tool including ratings from Crozdesk users and ratings from other sites.4.8


Best Code Visualization Tool Reviews
Below are my detailed summaries of the best code visualization tools that made it onto my shortlist. My reviews offer a detailed look at the key features, pros & cons, integrations, and ideal use cases of each tool to help you find the best one for you.

SonarQube is a code analysis and visualization platform that scans source code for bugs, vulnerabilities, and code quality issues, presenting results through interactive dashboards and detailed reports.
Who Is SonarQube Best For?
SonarQube is a strong fit for development teams in mid-size to enterprise organizations that need continuous code quality and security analysis built into their development workflow.
Why I Picked SonarQube
SonarQube earns its spot on my shortlist because of how deeply it surfaces security vulnerabilities within your codebase. I particularly like its taint analysis engine, which tracks data flows across files and functions to catch injection flaws like SQL injection and XSS—issues that basic static analysis tools routinely miss. Its secrets detection feature scans for leaked API keys, passwords, and security tokens using a combination of regex and semantic analysis, which reduces false positives. I also use the SAST engine regularly to catch vulnerabilities before they ever reach a pull request, with AI CodeFix generating one-click remediation suggestions right in the IDE.
SonarQube Key Features
- Quality gates: Set pass/fail thresholds on code quality and security metrics to automatically block non-compliant code from being merged or deployed.
- IaC scanning: Scans Terraform, CloudFormation, Kubernetes, ARM, and Ansible configurations to catch misconfigurations before they reach production.
- Software Composition Analysis (SCA): Identifies known CVEs in open-source dependencies, flags license compliance issues, and generates a software bill of materials (SBOM).
- Pull request decoration: Annotates pull requests directly with issue summaries and analysis results, so code review feedback appears right where your team is already working.
SonarQube Integrations
SonarQube offers native integrations with GitHub, Bitbucket, GitLab, Azure DevOps, and Atlassian Jira, and provides plugins for popular IDEs like Visual Studio Code, IntelliJ IDEA, and Eclipse. An API is available for custom integrations and CI/CD workflows.
Pros and Cons
Pros:
- Supports over 35 programming languages for comprehensive coverage
- Quality gates in pipelines block merges that fail quality thresholds
- Dashboards visualize coverage, technical debt, and complexity across projects
Cons:
- Scan times may be long on very large codebases
- Can generate false positives, requiring manual verification
New Product Updates from SonarQube

SonarQube Cloud Adds Azure DevOps Analysis and SCIM Automation
SonarQube Cloud introduces Automatic Analysis for Azure DevOps and SCIM User Lifecycle Management (Beta). These updates automate code analysis and user management, reducing manual setup and improving efficiency. For more information, visit SonarQube Cloud’s official site.
 .
.
Lucidchart is a cloud-based diagramming platform for developers who need to create, visualize, and collaborate on code architecture, flowcharts, and system diagrams.
Who Is Lucidchart Best For?
Lucidchart is a strong fit for software development teams that need a shared space to map out system architecture, data flows, and code logic together.
Why I Picked Lucidchart
Lucidchart earns its spot on my shortlist because of how well it handles real-time collaboration on technical diagrams. When my team is working through a complex system architecture or debugging a data flow, multiple people can edit the same diagram simultaneously—with cursor tracking and inline commenting so nothing gets lost in a side thread. I also like the UML sequence markup tool, which lets you auto-generate a sequence diagram from text input instead of dragging and dropping each element. The ERD shape library and conditional formatting make it easy to build and visually annotate relational database diagrams that communicate to both engineers and non-technical stakeholders.
Lucidchart Key Features
- Data linking: Connect live data from external sources to shapes on your diagram so values update as the data changes.
- Layers: Build diagrams with multiple layers to toggle between current and future states of a system or architecture without creating separate documents.
- AI-generated diagrams: Use text prompts to auto-generate diagram content directly on the canvas, including flowcharts and system maps.
- Network and cloud shape libraries: Access pre-built shape sets for AWS, Azure, and network infrastructure to diagram cloud architecture accurately.
Lucidchart Integrations
Lucidchart offers native integrations with Google Drive, Microsoft 365, Atlassian (Confluence and Jira), Slack, GitHub, Salesforce, AWS, Azure, and Dropbox. An API is available for custom integrations.
Pros and Cons
Pros:
- Strong template library
- Real-time team collaboration
- Diagram as code support
Cons:
- Can feel complex initially
- Limited offline access
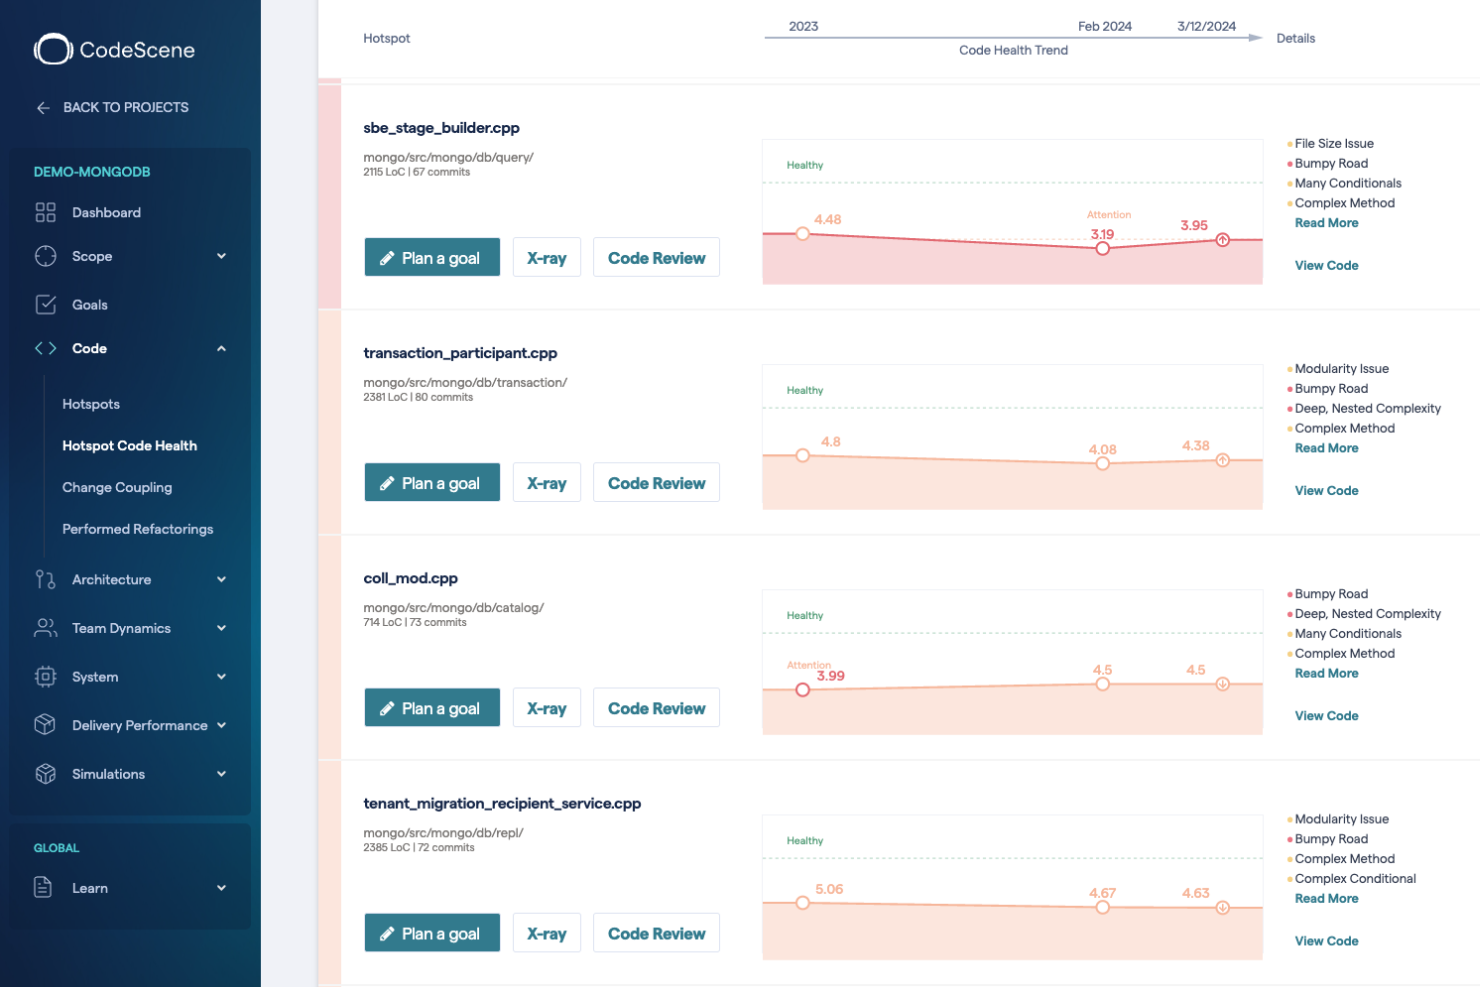
CodeScene is a code visualization platform that maps codebases, analyzes code health, detects hotspots, and provides interactive architectural diagrams for developers.
Who Is CodeScene Best For?
CodeScene is a good fit for software engineering teams and developers working with large, complex codebases who need data-driven insights into code quality and architecture.
Why I Picked CodeScene
I picked CodeScene as one of the best because of how it layers behavioral data on top of code quality metrics—something most static analysis tools simply don't do. The hotspot analysis uses Git activity to identify which files your team changes most frequently, then cross-references that with code health scores to surface where poor-quality code is actively slowing development down. I also find the change coupling visualization particularly useful: it maps files that frequently change together, exposing hidden architectural dependencies that you'd never catch by reading the code alone. The knowledge distribution dashboard tracks which developers own which parts of the codebase, so you can spot knowledge silos and bus factor risks before they cause problems.
CodeScene Key Features
- Code health scoring: Calculates a code health value for individual files and modules by measuring complexity, code smells, and risk probability.
- Branch analysis: Tracks and compares development branches to surface delivery bottlenecks and assess the risk of merging changes.
- Pull request integration: Automatically reviews pull requests and measures the code health impact of changes before they're merged.
- Unplanned work tracking: Monitors and quantifies unplanned work costs tied to specific hotspots and subsystems within your codebase.
CodeScene Integrations
Integrations include GitHub, Bitbucket, GitLab, Azure DevOps, Jira, Trello, Slack, Gerrit, Visual Studio, IntelliJ IDEA, and PyCharm.
Pros and Cons
Pros:
- Supports multiple version control systems
- Identifies code hotspots
- Offers predictive analytics
Cons:
- Requires learning curve
- Complexity in large codebases
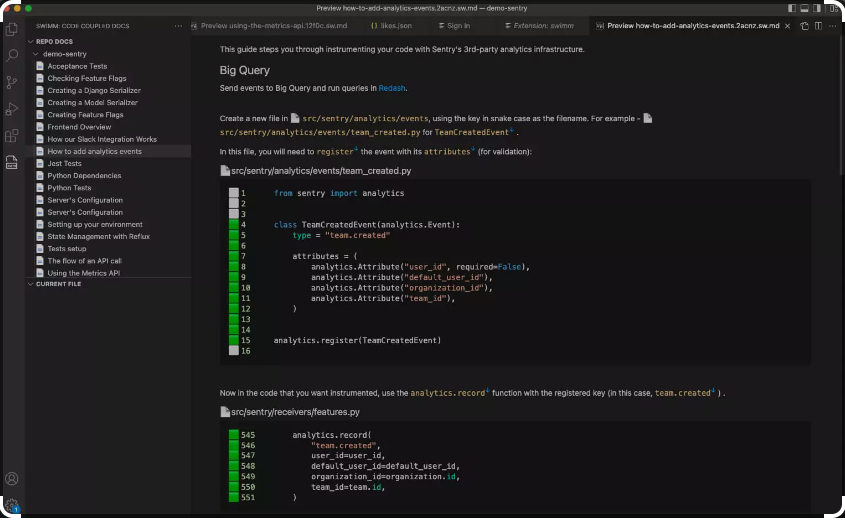
Swimm is a code documentation and visualization platform that lets developers create, maintain, and embed walkthroughs and tutorials directly within their codebase.
Who Is Swimm Best For?
Swimm is a strong fit for engineering teams at growing companies that need to bring new developers up to speed on complex codebases.
Why I Picked Swimm
I picked Swimm as one of the best because of how it handles the documentation side of developer onboarding. When a new developer joins a team, the biggest blocker isn't access to the codebase—it's understanding it. Swimm's IDE plugin surfaces relevant documentation directly in the editor as developers write code, so new team members don't have to go hunting through wikis or Slack threads. I also like that Swimm auto-generates documentation from pull requests and code snippets, which means the knowledge base stays current instead of going stale once changes are merged.
Swimm Key Features
- Dependency diagrams: Automatically generate visual diagrams that map how programs, jobs, and data flows connect across your codebase.
- Doc rules: Surface documentation alerts directly in the IDE when developers use unwanted coding practices, catching issues before code review.
- Domain glossary: Unify code-derived terminology and team-defined concepts into a single, searchable source of truth.
- Swimm MCP: Integrate Swimm's understanding layer across agentic tools and frameworks to provide governed, structured context for AI-assisted development.
Swimm Integrations
Swimm offers native integrations with GitHub, GitLab, and Bitbucket, and provides an API for custom integrations.
Pros and Cons
Pros:
- Supports multiple programming languages
- Auto-updates documentation with code changes
- Excellent for onboarding new developers
Cons:
- May require initial setup time
- Limited to certain integrations

Code Graph is a code visualization extension for Visual Studio that generates interactive code graphs, maps dependencies, and helps developers explore complex codebases visually.
Who Is Code Graph Best For?
Code Graph is a good fit for software developers and engineers who work primarily in Visual Studio and need to navigate or understand large, complex codebases.
Why I Picked Code Graph
Code Graph earns its spot on my shortlist because it plugs directly into Visual Studio as a native extension, so there's no context-switching to an external tool when I need to understand how a codebase fits together. I particularly like the call graph and class hierarchy visualization—when I'm working through an unfamiliar C++ or C# solution, I can place my cursor on any function and press
Alt+F
to instantly surface it in the graph. The ability to save and load relationship graphs as
.graph
bookmark files is also useful, since my team can preserve specific views of complex dependency chains and reload them without re-running a full solution analysis.
Code Graph Key Features
- Variable usage visualization: Map how variables are referenced and used across your codebase using
Alt+Uto surface all references in the graph. - File include graph: Visualize file-level include relationships to see how source files depend on one another across a solution.
- Symbol commenting: Add inline comments to functions, classes, and variables directly within the Symbol panel for annotation without leaving the graph.
- Custom edge creation: Manually connect any two items in the graph using middle-click drag to represent call relationships that doxygen can't detect automatically.
Code Graph Integrations
Integrations include GitHub, GitLab, Bitbucket, Visual Studio Code, IntelliJ IDEA, Slack, and Microsoft Teams.
Pros and Cons
Pros:
- Helps with legacy project analysis
- Visual maps update in real time
- Easy code navigation inside editor
Cons:
- Can slow performance on big codebases
- Limited outside Visual Studio

GitHub Codespaces is a cloud-based development environment from GitHub that provides instant access to configurable, containerized workspaces with integrated code navigation and visualization tools for developers.
Who Is GitHub Codespaces Best For?
GitHub Codespaces is a strong fit for distributed engineering teams and individual developers who need consistent, ready-to-code environments without managing local setup.
Why I Picked GitHub Codespaces
GitHub Codespaces earns its spot on my shortlist because it eliminates the biggest friction point in remote development: environment setup. I've opened a codespace directly from a pull request to investigate a bug without waiting for a local environment to spin up—that alone saves my team real time. I also like that dev container configuration files let me define the entire environment as code, so every developer on the team gets an identical, pre-configured workspace regardless of what machine they're on. Port forwarding and browser preview mean I can share a running instance of my work with teammates for quick feedback without deploying anything.
GitHub Codespaces Key Features
- Multi-IDE support: Connect to your codespace from a browser or a local IDE like Visual Studio Code or JetBrains, without changing how you work.
- Dotfiles repository sync: Carry your personal editor settings, themes, and preferences into every codespace automatically via a linked dotfiles repository.
- Scalable VM compute options: Choose from 2-core to 32-core cloud machines to match the demands of the codebase you're working in.
- Commit-level environment access: Open a codespace at a specific commit in a repository's history to inspect or debug code at an exact point in time.
GitHub Codespaces Integrations
GitHub Codespaces offers native integrations with GitHub repositories and Visual Studio Code, and provides an API for custom integrations.
Pros and Cons
Pros:
- Preconfigured with project dependencies
- Works in browser or desktop IDE
- Instant dev environment setup
Cons:
- Learning curve for workspace config
- Costs add up on heavy use
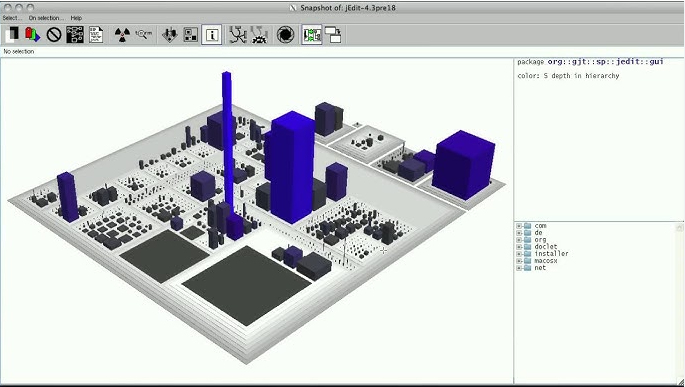
CodeCity is a code visualization platform that lets you explore software architecture and code metrics through interactive 3D models, tailored for developers who analyze large codebases.
Who Is CodeCity Best For?
CodeCity suits software developers and researchers who need to analyze and understand the structure of large, complex codebases.
Why I Picked CodeCity
CodeCity earns its spot on my shortlist because it uses the city metaphor to turn abstract code structure into something you can navigate. I like that classes render as buildings, with building width and length mapped to the number of attributes and height mapped to the number of methods—so a towering building immediately signals a class with excessive functionality, and a wide-footprint building flags one carrying too much state. My team uses CodeCity to spot patterns like god classes and antenna-shaped constructs at a glance, without having to dig through source files manually. The query mechanism and manual inspection tools let you drill into specific districts of the city, so you can zoom in on a problematic package while keeping your orientation in the broader system.
CodeCity Key Features
- Language-independent analysis: CodeCity works with Java, C++, and Smalltalk systems by parsing source code into a language-neutral FAMIX meta-model before rendering the visualization.
- Configurable view settings: Define which model elements to display, set figure types, and customize metric-to-visual property mappings to tailor the city layout to your analysis needs.
- Multi-platform support: CodeCity runs on all major operating systems, so you're not locked into a specific environment.
- Interactive navigation controls: Move through the 3D city using keyboard-driven orbiting, rotation, panning, and zoom to explore the codebase from any angle.
CodeCity Integrations
Integrations include Moose, Pharo, VisualWorks Smalltalk, and various software analysis tools via the MSE file format.
Pros and Cons
Pros:
- Helps spot code complexity fast
- Supports custom metric mapping
- Works well for legacy codebases
Cons:
- Requires Moose for full functionality
- Only supports object-oriented languages
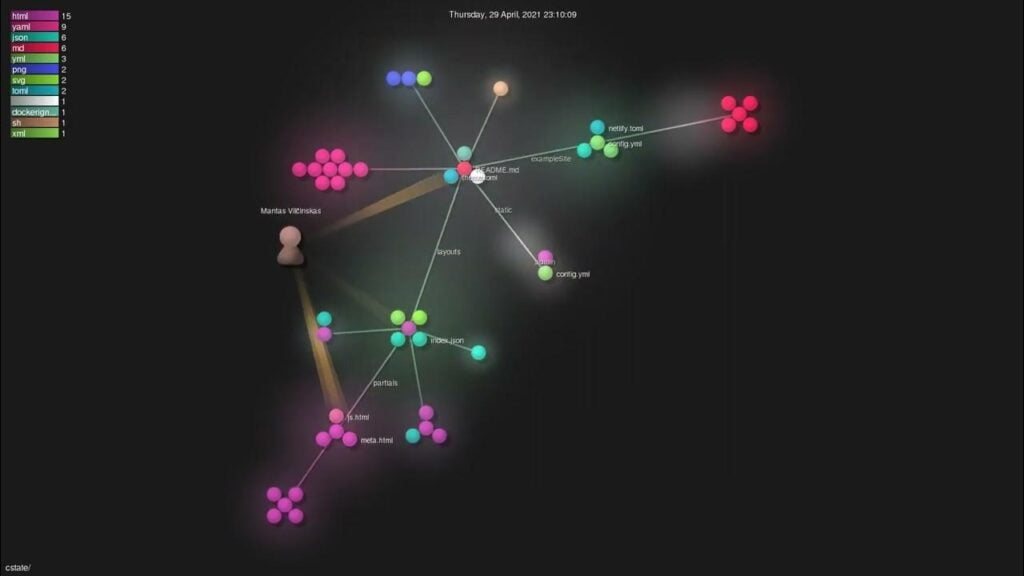
Gource is an open-source code visualization tool that creates animated representations of version control history, supporting Git, Mercurial, Bazaar, and SVN repositories.
Who Is Gource Best For?
Gource is a good fit for developers and engineering teams who want to visually explore how a codebase has evolved over time across version control systems.
Why I Picked Gource
Gource earns its spot as one of the best on my shortlist because of how it turns raw version control history into a living, animated visualization of your project's evolution. I love that it renders your repository as an animated tree, with directories as branches and files as leaves, so you can literally watch contributors appear and work across the codebase over time. I use the
--start-date
and
--stop-date
options to isolate specific sprints or release windows, which makes it easy to review exactly what changed and who drove it. The
--file-show-filter
flag is another feature I rely on to focus the visualization on specific parts of the codebase rather than watching the entire repo at once.
Gource Key Features
- Custom log format support: Gource accepts a custom log format, letting you pipe in activity data from tools and systems beyond its natively supported VCS options.
- Video output via FFmpeg: Pipe Gource's output directly into FFmpeg using
--output-streamto record and export visualizations as video files. - Caption file support: Overlay timed captions onto the visualization using a caption file, useful for annotating key project milestones or release events.
-
--user-show-filteroption: Filter the visualization to display only specific contributors, letting you focus on individual developer activity within the project history.
Gource Integrations
Gource supports native integrations with Git, Mercurial, Bazaar, and Subversion version control systems. An API is available for custom integrations.
Pros and Cons
Pros:
- Customizable visual outputs
- Supports multiple version control systems
- Unique project history visualization
Cons:
- No real-time collaboration
- Limited to visual analysis

CodeStory is a podcast and content platform focused on sharing in-depth interviews with software developers and founders about their coding journeys and project experiences.
Who Is CodeStory Best For?
CodeStory is a good fit for developers and founders who want to learn from real-world software development experiences through long-form interviews and storytelling.
Why I Picked CodeStory
CodeStory earns its spot as one of the best on my shortlist because it takes a narrative-first approach to explaining how software gets built. I love how each episode breaks down real development decisions—like why a team chose a particular architecture or how they debugged a tricky system failure—in a way that makes complex code concepts click. The long-form interview format lets developers walk through their actual codebase thinking, which I find far more useful than abstract documentation. It's one of the few platforms where storytelling with code feels genuinely educational rather than surface-level.
CodeStory Key Features
- Multi-platform episode access: Listen to episodes directly through Apple Podcasts, Google Podcasts, Pocket Casts, Breaker, or RSS feed without needing a dedicated app.
- Episodic series library: Browse episodes organized by season (S1–S12) and bonus content, with over 1,000 episodes available across 12+ seasons.
- Tag-based episode filtering: Filter episodes by topic tags like DevOps, AI, infrastructure, open source, and security to find relevant developer conversations.
- Bonus content format: Access shorter bonus episodes featuring additional founder and developer interviews alongside full-length main episodes.
CodeStory Integrations
Integrations include Visual Studio Code, GitHub, GitLab, Bitbucket, Slack, and Discord.
Pros and Cons
Pros:
- Auto-creates pull request summaries and changelogs
- AI-driven code editing simplifies modifications
- Generates contextual explanations for code changes
Cons:
- Dependence on accurate AI interpretations
- Limited to environments compatible with VSCode
Understand is a code visualization and static analysis tool for developers who require advanced code navigation, metrics, and graphical representations across multiple programming languages.
Who Is Understand Best For?
Understand is a good fit for software engineers and development teams working in safety-critical or highly regulated industries like aerospace, defense, and embedded systems.
Why I Picked Understand
Understand earns its spot on my shortlist because of how well it handles the scale and complexity that comes with large codebases. I use the dependency graphs and call trees constantly when working across multi-million-line projects—they let me trace exactly what a change will affect before I touch a single line. I also rely on the Hyper-Xref feature, which lets me bi-directionally navigate every named entity in the code, so I'm never guessing where a function is defined or what references it. For projects where a wrong change can cascade across hundreds of files, that level of visibility is what I need.
Understand Key Features
- Code metrics dashboard: Hundreds of built-in, cross-language industry-standard software metrics that you can visualize and export for team review.
- Architecture organization: Lets you rearrange code into custom logical groupings to map relationships between components across a large project.
- CodeCheck compliance validation: Enforces internal coding standards and validates against external standards like MISRA and AUTOSAR using pre-defined or custom checks.
- Code annotations: Attach comments, requirements, and reminders directly to specific code sections to keep documentation tied to the source.
Understand Integrations
Integrations include Visual Studio, Eclipse, Xcode, Jenkins, Azure DevOps, Jira, Git, Subversion, Perforce, and various compilers via build commands and JSON compilation databases.
Pros and Cons
Pros:
- Offers comprehensive reporting
- Supports multiple programming languages
- Handles large codebases efficiently
Cons:
- Not ideal for small projects
- Limited to static analysis
Other Code Visualization Tools
Here are some additional code visualization tools options that didn’t make it onto my shortlist, but are still worth checking out:
- Sourcetrail
For code exploration
- CppDepend
For C++ code analysis
- Embold
For detecting anti-patterns
- Cider
For security insights
- GitTrends
For GitHub analytics
- Sourcemeter
For multi-language analysis
- CodeGalaxy
For learning to code
- Sourcegraph
For universal code search
- Code Maat
For code evolution metrics
- CodeFlower
For visualizing code structure
- CodeViz
For call graph generation
- Polyspace
For static code verification
- SourceMiner
For code analysis plugins


How I Evaluate Code Visualization Tools
I split my evaluation into two layers: the baseline a tool must clear—like parsing large repos and rendering dependency graphs—and the differentiators that separate the genuinely useful options.
Core Functionality (Table Stakes for This List)
These core capabilities serve as the acceptance criteria for inclusion on my list of code visualization tools:
- Source Code Parsing: I check whether a tool can ingest full repositories directly from version control, not just manually uploaded snippets or single files.
- Dependency & Call Graphs: Rendering relationships across functions, classes, and modules matters—I look for layered graphs, not just flat file-tree diagrams.
- Multi-Language Support: Most engineering teams work across several languages, so I evaluate how many mainstream languages a tool parses with consistent depth.
- Interactive Navigation: I look for the ability to filter, drill down, and jump from a visual node straight to the relevant source code location in the repo.
- Repository & VCS Integration: A tool should connect natively to GitHub, GitLab, or Bitbucket and stay in sync as code changes, rather than requiring manual re-imports.
- Diagram Export & Sharing: I evaluate whether you can export to formats like SVG, PNG, or PDF and share via embeddable links for architecture reviews and documentation.
I rank each vendor on a scale from 0 (does not offer the functionality) to 5 (excels in this area) for each criterion.
Vendors need to achieve a minimum average score to be considered for inclusion on my list. From there, I consider what sets each platform apart.
Differentiating Factors (What Sets Vendors Apart)
Once I've curated my list, here's how I contrast and compare different vendors in the code visualization tools space:
Standout Features
I look for AI-powered code explanations that make grappling with complex or unfamiliar architectures much smoother, especially for onboarding and documentation. Live architecture sync and IDE plugin support are key—these features keep diagrams fresh as code evolves and surface visualizations right where developers work. I also pay close attention to custom diagram layers, which let teams highlight service boundaries, security zones, or ownership, helping align technical maps with real-world processes.
Beyond Features
Deployment and data security matter a lot here—teams working with proprietary code need to know whether a tool offers self-hosted or air-gapped options before sending a single file to the cloud. I also evaluate how well a tool handles codebase scale, since a platform that chokes on a monolith repository with hundreds of thousands of files isn't practical for mid-to-large engineering orgs. Pricing transparency is another factor I check, particularly whether licensing scales by seat, repo count, or usage.
How to Choose Code Visualization Tools
It’s easy to get bogged down in long feature lists and complex pricing structures. To help you stay focused as you work through your unique software selection process, here’s a checklist of factors to keep in mind:
| Factor | What to Consider |
| Scalability | Ensure the tool can grow with your team and handle larger codebases as your projects expand. Look for solutions that offer scalable features and pricing. |
| Integrations | Check if the tool integrates with your existing software like Git or Jenkins. Seamless integration can streamline workflows and boost productivity. |
| Customizability | Consider how much you can tailor the tool to fit your team's specific needs. Customizable dashboards and reports can enhance usability and relevance. |
| Ease of Use | Look for an intuitive interface that minimizes the learning curve. A user-friendly tool can save time and reduce frustration for your team. |
| Budget | Evaluate the cost against your budget. Consider both initial expenses and long-term value, including maintenance and potential upgrades. |
| Security Safeguards | Ensure the tool complies with industry security standards to protect your code and data. Look for features like encryption and access controls. |
| Support | Access to reliable customer support is crucial. Check for 24/7 availability, multiple support channels, and a comprehensive knowledge base. |
| Features | Prioritize features that directly address your team's pain points, like visualizing code dependencies or analyzing complexity. Focus on what adds value. |
Trends in Code Visualization Tools
In my research, I sourced countless product updates, press releases, and release logs from different code visualization tool vendors. Here are some of the emerging trends I’m keeping an eye on:
- Real-time Collaboration: Teams want to work together in real-time, even when apart. Tools are adding features that let multiple users view and edit visualizations simultaneously, enhancing teamwork. Some vendors now offer live collaboration features that reflect changes instantly.
- Behavioral Analytics: Understanding how code changes impact team dynamics is gaining traction. Tools are integrating analytics that show how coding patterns affect productivity and quality. This trend helps managers make informed decisions about team processes.
- 3D Visualization: More tools are offering 3D views of codebases to give a clearer picture of complex structures. This trend is becoming popular for its ability to simplify the understanding of large codebases. Vendors are using 3D graphics to depict code relationships in an engaging way.
- Technical Debt Management: Managing technical debt is crucial for long-term success. Tools are adding features to identify, track, and prioritize technical debt, helping teams focus on what matters. This trend is especially useful for maintaining code quality over time.
- Enhanced Security Features: With increasing cyber threats, security is a top priority. Tools are incorporating features that analyze code for vulnerabilities and ensure compliance with security standards. This trend is vital for businesses looking to protect their intellectual property.
What Are Code Visualization Tools?
Code visualization tools are software solutions that transform complex code structures into visual formats like graphs and charts. Software developers, project managers, and IT professionals generally use these tools to better understand and manage codebases.
Features like real-time collaboration, behavioral analytics, and 3D visualization help with enhancing team collaboration, understanding coding patterns, and simplifying large codebases. Overall, these tools provide significant value by making code more accessible and manageable for teams.
Features of Code Visualization Tools
When selecting code visualization tools, keep an eye out for the following key features:
- Real-time collaboration: Allows multiple users to view and edit visualizations simultaneously, enhancing team collaboration.
- Behavioral analytics: Provides insights into how coding patterns affect team productivity and software quality.
- 3D visualization: Offers a clearer picture of complex code structures, making large codebases easier to understand.
- Technical debt management: Identifies and prioritizes technical debt, helping teams maintain code quality over time.
- Security analysis: Analyzes code for vulnerabilities and ensures compliance with security standards to protect intellectual property.
- Code dependency mapping: Visualizes dependencies within the code, aiding in the understanding of code relationships.
- Customizable dashboards: Allows users to tailor visualizations and reports to fit their specific needs and preferences.
- Interactive code walkthroughs: Guides users through codebases with interactive tutorials, enhancing onboarding and learning.
- Version control integration: Seamlessly integrates with version control systems like Git to track changes and manage code history.
- Comprehensive reporting: Generates detailed reports on code metrics and quality, supporting informed decision-making.
Benefits of Code Visualization Tools
Implementing code visualization tools provides several benefits for your team and your business. Here are a few you can look forward to:
- Improved understanding: Visualizing code structures and dependencies makes it easier for your team to grasp complex codebases.
- Enhanced collaboration: Real-time collaboration features allow team members to work together more effectively, even when remote.
- Reduced technical debt: Tools that identify and manage technical debt help maintain code quality and prevent future issues.
- Increased security: Analyzing code for vulnerabilities ensures your software meets security standards, protecting your business.
- Better decision-making: Comprehensive reporting and behavioral analytics provide insights that support informed decisions on code improvements.
- Efficient onboarding: Interactive code walkthroughs and tutorials accelerate the onboarding process for new team members.
- Time savings: Automating code analysis and visualization tasks frees up your team to focus on development and innovation.
Costs and Pricing of Code Visualization Tools
Selecting code visualization tools requires an understanding of the various pricing models and plans available. Costs vary based on features, team size, add-ons, and more. The table below summarizes common plans, their average prices, and typical features included in code visualization tools solutions:
Plan Comparison Table for Code Visualization Tools
| Plan Type | Average Price | Common Features |
| Free Plan | $0 | Basic visualization, limited storage, and community support. |
| Personal Plan | $5-$25/user/month | Advanced visualization options, personal dashboards, and email support. |
| Business Plan | $30-$75/user/month | Team collaboration tools, technical support, and integration with version control. |
| Enterprise Plan | $100-$200/user/month | Customizable solutions, dedicated account manager, and enhanced security features. |
Code Visualization Tools: FAQs
Here are some answers to common questions about code visualization tools:
How do you visualize code structure?
Visualizing code structure involves creating diagrams that map relationships and dependencies within your code. These tools can generate class diagrams, flowcharts, or dependency graphs to help you understand how different parts of your codebase interact. Once integrated with profiling tools, this process helps in maintaining consistency with your system’s architecture.
How does real-time collaboration work in these tools?
Real-time collaboration allows multiple team members to view and edit code visualizations simultaneously. This feature is useful for remote teams, enabling them to work together effectively regardless of location. It ensures everyone sees updates immediately, which enhances teamwork and productivity.
What are the security features in code visualization tools?
Security features in these tools often include code analysis for vulnerabilities and compliance with industry standards. They help ensure your code is secure by identifying potential risks and providing solutions. This is crucial for protecting your intellectual property and maintaining trust with clients.
How do code visualization tools help manage technical debt?
These tools identify areas of your code that may lead to technical debt, such as code smells or high complexity. By highlighting these issues, they help prioritize refactoring efforts. This proactive approach aids in maintaining code quality and preventing future problems.
Can these tools integrate with version control systems?
Yes, many code visualization tools integrate with popular version control systems like Git, SVN, and Mercurial. This integration allows seamless tracking of code changes and history, which is essential for managing large projects and collaborating with team members.
What kind of support can I expect from vendors?
Support varies by vendor, but you can typically expect access to documentation, tutorials, and customer service via multiple channels. Some offer 24/7 support, live chat, and dedicated account managers to assist with any issues or questions you might have.
What's Next?
If you're in the process of researching code visualization tools, connect with a SoftwareSelect advisor for free recommendations.
You fill out a form and have a quick chat where they get into the specifics of your needs. Then you'll get a shortlist of software to review. They'll even support you through the entire buying process, including price negotiations.