Le 10 Migliori Soluzioni di Monitoraggio SRE nel 2026

Migliori strumenti di monitoraggio SRE Shortlist


Gli strumenti di monitoraggio SRE sono piattaforme che aiutano gli ingegneri di affidabilità dei siti a monitorare la salute dei sistemi, rilevare incidenti e analizzare le performance in infrastrutture complesse. Questi strumenti sono strettamente collegati ai tool di gestione degli incidenti e sono progettati per monitorare sistemi in produzione, supportando allo stesso tempo workflow moderni di sviluppo software. Raccolgono e analizzano metriche, log e tracce per offrire visibilità in tempo reale, permettendo ai team di identificare rapidamente i problemi e ridurre i tempi di inattività. Questa guida ti aiuta a orientarti tra le varie opzioni per confrontare le migliori soluzioni, capire cosa distingue ciascuno strumento e scegliere quello più adatto alle esigenze del tuo team nel 2026.
Perché Fidarti delle Nostre Recensioni Software
Testiamo e recensiamo software dal 2023. Come leader tecnologici, sappiamo quanto sia cruciale e difficile prendere la decisione giusta nella scelta di un software.
Investiamo in una ricerca approfondita per aiutare il nostro pubblico a effettuare scelte migliori di acquisto software. Abbiamo testato oltre 2.000 strumenti per diversi casi d’uso tecnologici e scritto più di 1.000 recensioni complete. Scopri come restiamo trasparenti e la nostra metodologia di recensione del software.
Riepilogo dei migliori strumenti di monitoraggio SRE
Questa tabella comparativa riassume i dettagli di prezzo delle mie principali scelte di strumenti di monitoraggio SRE per aiutarti a trovare la soluzione migliore in base al tuo budget e alle esigenze aziendali
| Tool | Best For | Trial Info | Price | ||
|---|---|---|---|---|---|
| 1 | Migliore per il monitoraggio full-stack | Piano gratuito disponibile | Da $49/utente/mese | Website | |
| 2 | Ideale per l’analisi dei log in cloud | Prova gratuita di 30 giorni + piano gratuito + demo gratuita disponibile | Da $79/mese (fatturazione annuale) | Website | |
| 3 | Ideale per metriche e alerting open-source | Utilizzo gratuito | Nessun costo di licenza | Website | |
| 4 | Ideale per l'osservabilità su Google Cloud | Piano gratuito disponibile | A partire da $0.1510/MiB per le metriche registrate | Website | |
| 5 | Ideale per il monitoraggio nativo su AWS | Piano gratuito disponibile | Prezzi su richiesta | Website | |
| 6 | Il migliore per la visualizzazione di dati di monitoraggio | Piano gratuito disponibile | Da $19/mese + utilizzo | Website | |
| 7 | Ideale per pipeline di elaborazione dei log | Prova gratuita di 7 giorni disponibile | Prezzo su richiesta | Website | |
| 8 | Ideale per il monitoraggio di dati di serie temporali | Prova gratuita di 30 giorni disponibile | Prezzo su richiesta | Website | |
| 9 | Ideale per il monitoraggio flessibile dell'infrastruttura | Prova gratuita di 14 giorni + demo gratuita disponibile | Da $3/nodo/mese (fatturazione annuale) | Website | |
| 10 | Ideale per il tracciamento degli errori in tempo reale | Piano gratuito + prova gratuita + demo gratuita disponibile | Da $26/mese (fatturato annualmente) | Website |
-

TestDevLab
Visit Website -
Site24x7
Visit WebsiteThis is an aggregated rating for this tool including ratings from Crozdesk users and ratings from other sites.4.7 -
GitHub Actions
Visit WebsiteThis is an aggregated rating for this tool including ratings from Crozdesk users and ratings from other sites.4.8


Recensioni dei migliori strumenti di monitoraggio SRE
Di seguito trovi i miei riepiloghi dettagliati degli strumenti di monitoraggio SRE che sono entrati nella shortlist. Le mie recensioni offrono uno sguardo approfondito a funzionalità, integrazioni e migliori casi d’uso di ogni piattaforma per aiutarti a trovare la soluzione perfetta per te.
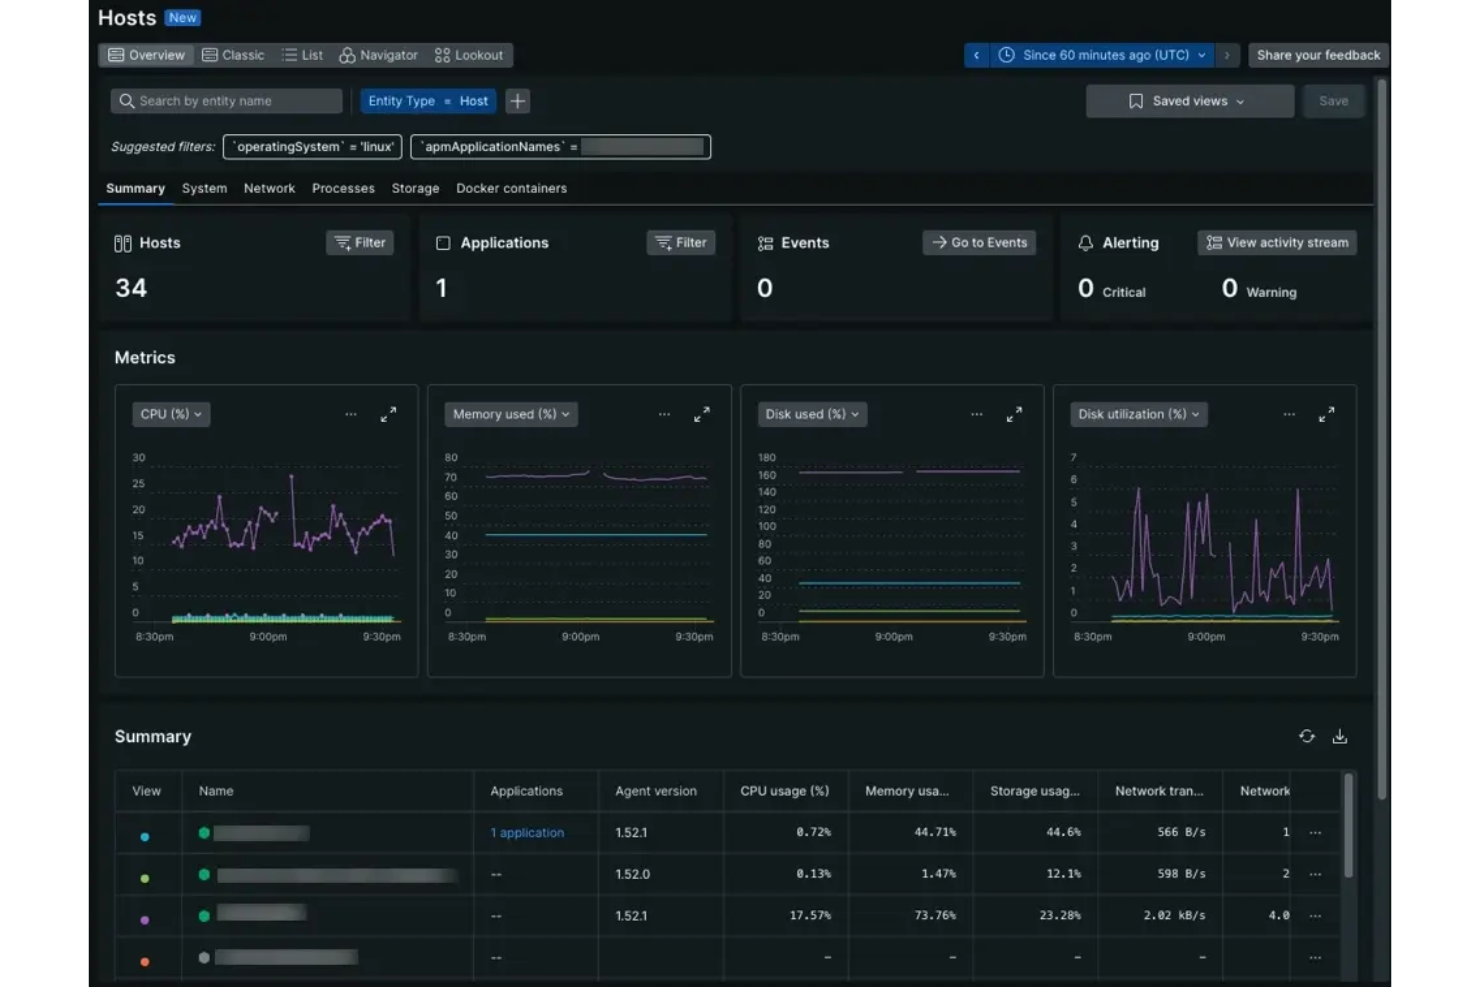
New Relic è una piattaforma di osservabilità full-stack per il monitoraggio SRE che riunisce il monitoraggio delle prestazioni delle applicazioni, il monitoraggio dell'infrastruttura, il tracing distribuito e la gestione dei log in un unico sistema.
Per chi è ideale New Relic?
New Relic è particolarmente indicato per i team SRE e gli ingegneri DevOps di medie e grandi organizzazioni che gestiscono applicazioni complesse basate su cloud.
Perché ho scelto New Relic
Ho scelto New Relic come uno dei migliori perché posso contare sulla sua piattaforma di telemetria unificata che raccoglie metriche, trace e log in un unico posto. Apprezzo come gli approfondimenti alimentati dall'intelligenza artificiale aiutino il mio team a identificare e risolvere rapidamente gli incidenti in tutto lo stack. Il mio team utilizza l’osservabilità full-stack di New Relic per monitorare in tempo reale tutto, dall’infrastruttura cloud alle prestazioni delle applicazioni.
Funzionalità chiave di New Relic
- Monitoraggio sintetico: Simula le interazioni degli utenti per testare la disponibilità e le prestazioni delle applicazioni.
- Tracing distribuito: Traccia le richieste mentre si spostano tra microservizi e infrastruttura.
- Dashboard personalizzabili: Permette di creare visualizzazioni su misura per le proprie esigenze di monitoraggio.
- Politiche di allerta: Consente di impostare soglie e automatizzare le notifiche sugli incidenti.
Integrazioni di New Relic
New Relic offre oltre 800 integrazioni native, compresi AWS, Azure, Google Cloud Platform, Kubernetes, Docker, Slack, PagerDuty, Jira, GitHub, ServiceNow e Salesforce, con un'API disponibile per integrazioni personalizzate.
Pros and Cons
Pros:
- Dati in streaming in tempo reale per una risposta rapida agli incidenti
- Dashboard personalizzabili per i flussi di lavoro SRE
- Offre osservabilità approfondita su stack cloud-native
Cons:
- Alti costi di acquisizione dati per ambienti di grandi dimensioni
- Opzioni limitate di distribuzione on-premises
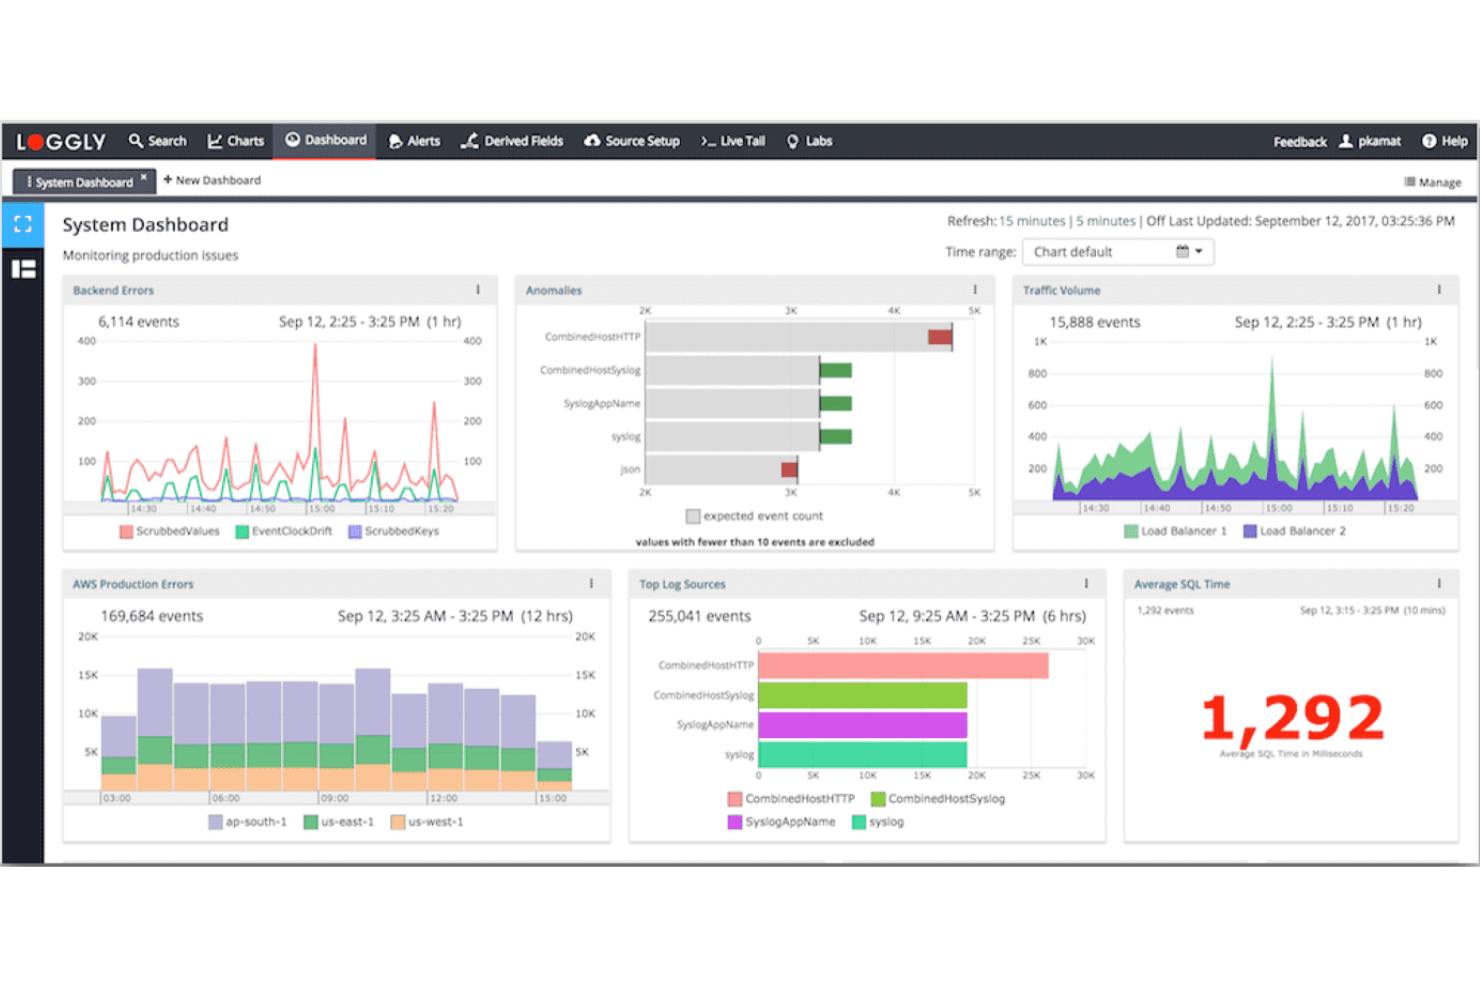
Loggly è una piattaforma cloud-based per la gestione dei log destinata al monitoraggio SRE che raccoglie, indicizza e analizza i dati di log provenienti da server, applicazioni e servizi cloud in tempo reale.
Per chi è consigliato Loggly?
Loggly è particolarmente adatto per SRE e team IT di organizzazioni di medie e grandi dimensioni che gestiscono infrastrutture cloud distribuite.
Perché ho scelto Loggly
Ho scelto Loggly tra i migliori perché faccio affidamento sulla sua gestione dei log basata su cloud per cercare e visualizzare rapidamente grandi volumi di log. Mi piace il modo in cui il suo explorer dinamico dei campi e le dashboard interattive mi permettono di approfondire i dati di log senza dover creare query personalizzate. Il mio team utilizza la ricerca in tempo reale e l’analisi automatica per monitorare sistemi distribuiti e individuare rapidamente i problemi.
Funzionalità principali di Loggly
- Avvisi automatici: Configura avvisi personalizzati basati su eventi di log e soglie.
- Archiviazione dei log: Conservazione e recupero dei dati di log storici per la conformità e le verifiche.
- Accesso API RESTful: Integrazione dei dati di log con strumenti e flussi di lavoro esterni.
- Supporto per fonti di log multiple: Raccolta dei log da server, piattaforme cloud e dispositivi di rete.
Integrazioni di Loggly
Loggly offre integrazioni native con AWS CloudWatch, GitHub, Jira, Slack, Microsoft Teams e PagerDuty, e mette a disposizione un’API per integrazioni personalizzate.
Pros and Cons
Pros:
- Gestisce formati e fonti di log diversificati
- Visualizza i dati di log tramite dashboard interattive
- Supporta formati di log strutturati e non strutturati
Cons:
- Nessun supporto integrato per il deployment on-premise
- Il sistema di avvisi non offre una logica avanzata di correlazione
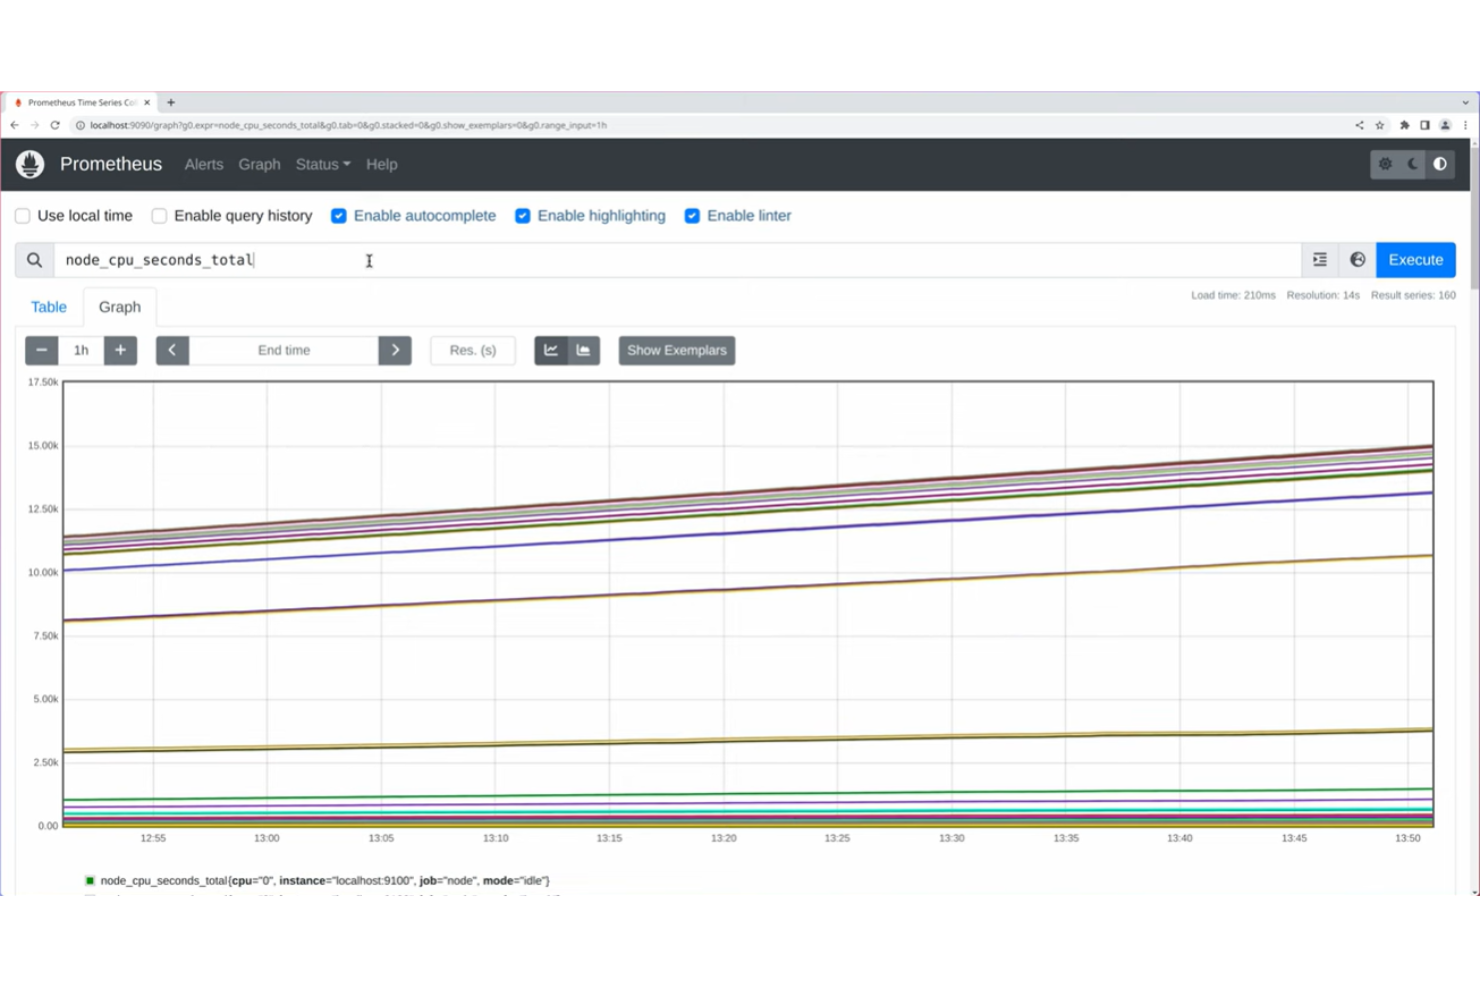
Prometheus è un sistema open-source di monitoraggio e alerting progettato per gli ingegneri dell'affidabilità dei siti che hanno bisogno di raccogliere, archiviare e interrogare metriche temporali provenienti da infrastrutture e applicazioni.
Per Chi È Più Indicato Prometheus?
Prometheus è particolarmente adatto per gli ingegneri dell'affidabilità dei siti e i team DevOps in organizzazioni orientate alla tecnologia che gestiscono infrastrutture containerizzate su larga scala.
Perché Ho Scelto Prometheus
Ho scelto Prometheus tra i migliori perché mi affido al suo toolkit open-source per raccogliere e archiviare dati temporali da infrastrutture dinamiche. Apprezzo il modo in cui il suo linguaggio di query flessibile consenta di creare dashboard e avvisi personalizzati per qualsiasi metrica rilevante per il mio team. Il mio team utilizza Prometheus per monitorare cluster Kubernetes e carichi di lavoro containerizzati, sfruttando la raccolta dati basata su pull e la service discovery automatica.
Caratteristiche Chiave di Prometheus
- Integrazione con Alertmanager: Invia avvisi tramite email, PagerDuty o Slack in base a regole personalizzate.
- Modello dati multi-dimensionale: Archivia metriche con etichette per query e filtri flessibili.
- Service discovery: Rileva automaticamente i target in ambienti cloud e containerizzati.
- Configurazione della conservazione dei dati: Imposta periodi di conservazione personalizzati per i dati delle serie temporali.
Integrazioni di Prometheus
Prometheus offre integrazioni native con Alertmanager, Grafana, Kubernetes, Consul e Docker, e mette a disposizione una API per integrazioni personalizzate.
Pros and Cons
Pros:
- La raccolta di metriche basata su pull supporta ambienti dinamici
- Linguaggio di query PromQL flessibile per metriche personalizzate
- Solida community open-source e ottima documentazione
Cons:
- Nessun storage integrato a lungo termine per le metriche
- Manca il supporto nativo per tracing distribuito
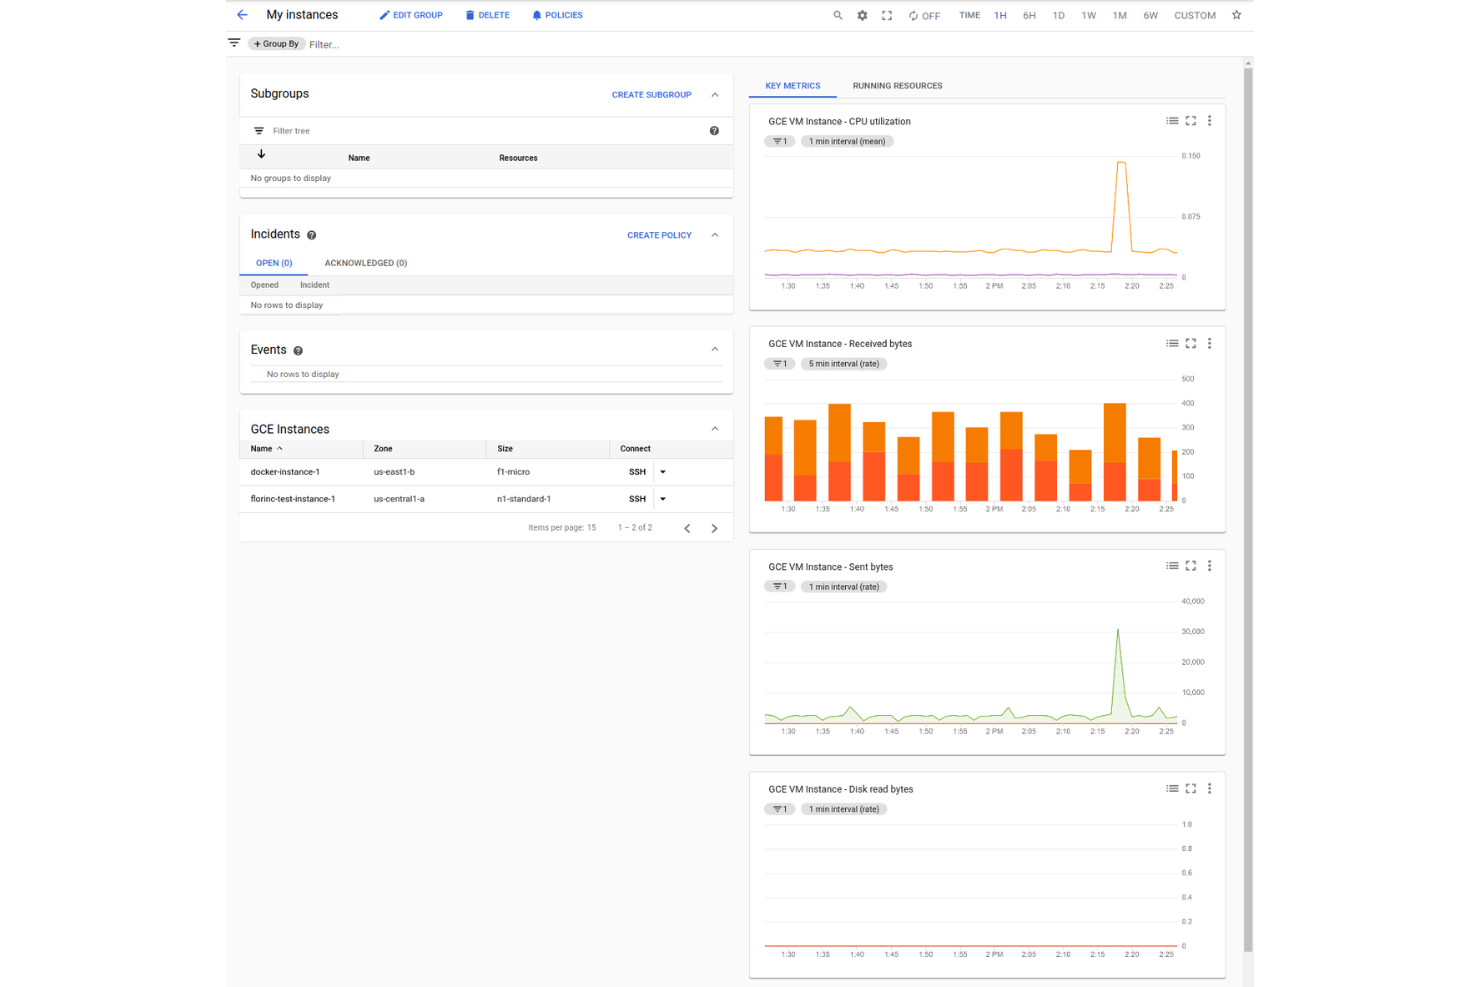
Google Cloud Monitoring è una piattaforma di monitoraggio cloud-nativa per l'ingegneria dell'affidabilità dei siti che raccoglie, visualizza e analizza metriche, eventi e log da Google Cloud e ambienti ibridi.
Per chi è ideale Google Cloud Monitoring?
Google Cloud Monitoring è particolarmente indicato per i team SRE che gestiscono carichi di lavoro su Google Cloud o in ambienti cloud ibridi.
Perché ho scelto Google Cloud Monitoring
Ho scelto Google Cloud Monitoring come uno dei migliori perché offre monitoraggio e osservabilità nativi su tutte le risorse Google Cloud senza configurazioni aggiuntive. Apprezzo la possibilità di visualizzare metriche, log e controlli di uptime per i miei carichi di lavoro cloud e ibridi in un unico posto. Il mio team utilizza le sue politiche di avviso e dashboard personalizzati per monitorare lo stato dei servizi e rispondere rapidamente agli incidenti.
Funzionalità chiave di Google Cloud Monitoring
- Monitoraggio multi-cloud: Raccoglie e visualizza metriche da AWS e sistemi on-premise insieme a quelle di Google Cloud.
- Monitoraggio SLO: Permette di definire e monitorare gli obiettivi di livello di servizio per l'affidabilità.
- Monitoraggio dell'uptime: Verifica continuamente la disponibilità dei servizi da più località globali.
- Cronologia degli incidenti: Visualizza incidenti ed eventi correlati in ordine cronologico per una risoluzione più rapida.
Integrazioni di Google Cloud Monitoring
Google Cloud Monitoring offre integrazioni native nell'intero ecosistema Google Cloud, inclusi Google Compute Engine, Google Kubernetes Engine, Google App Engine, Google Cloud Functions e Google Cloud Storage. È disponibile un'API per integrazioni personalizzate.
Pros and Cons
Pros:
- Supporta monitoraggio multi-cloud e ibrido
- Funzionalità personalizzabili di monitoraggio SLO e SLA
- Scalabile per ambienti ampi e distribuiti
Cons:
- La navigazione dell'interfaccia può risultare poco intuitiva per i nuovi utenti
- Il prezzo può aumentare rapidamente con alti volumi di dati
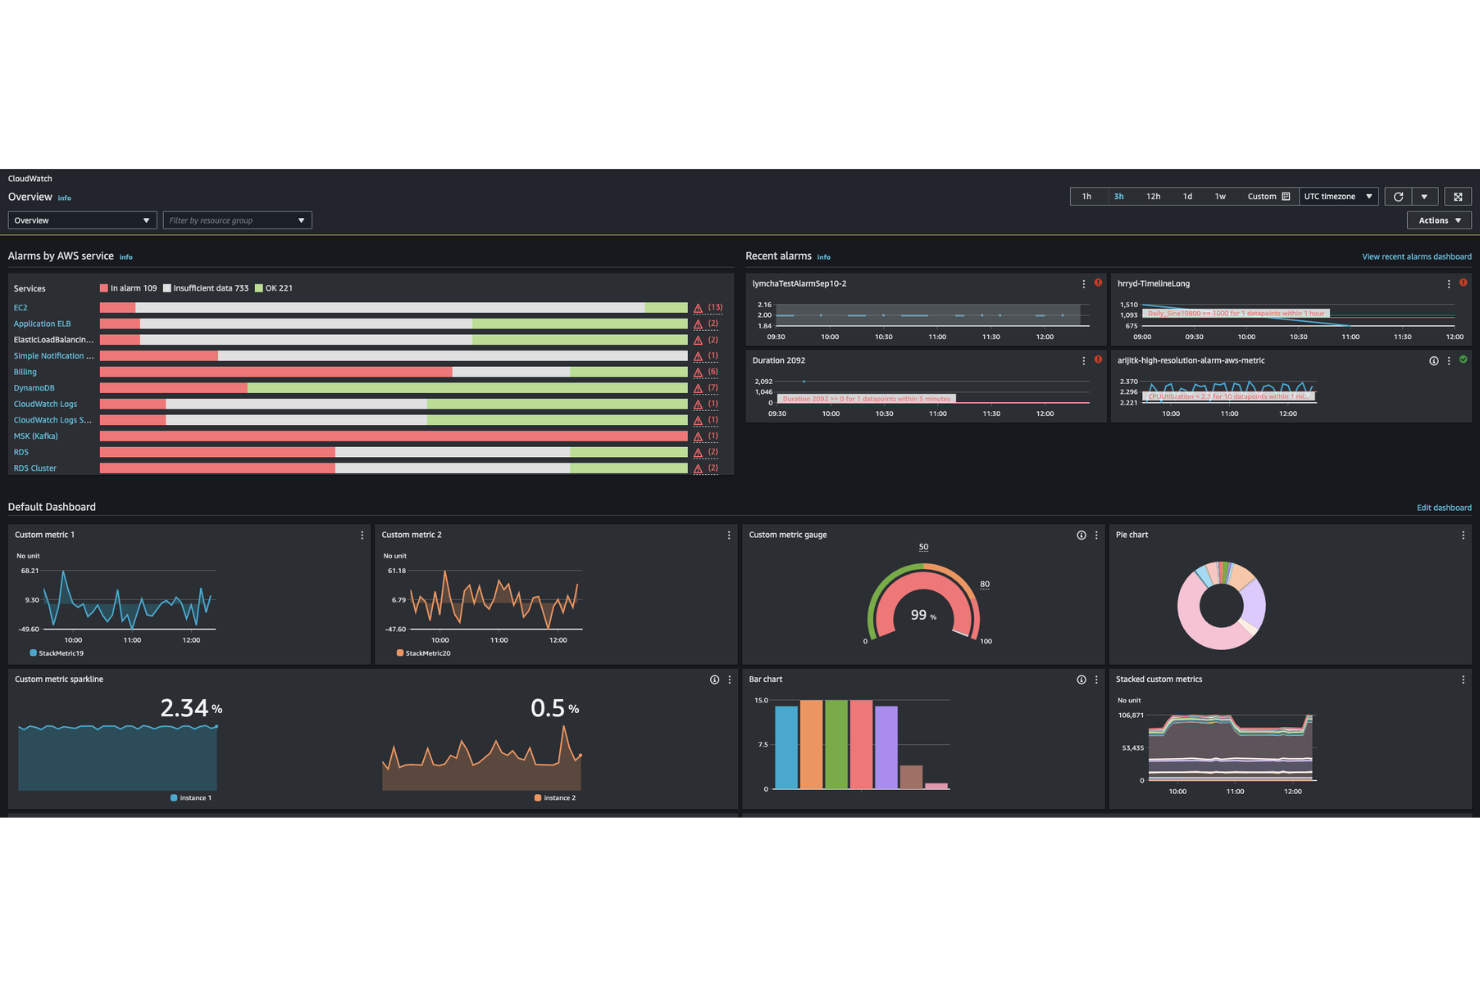
Amazon CloudWatch è una piattaforma cloud-native di monitoraggio e osservabilità di AWS che offre raccolta di metriche, gestione dei log, monitoraggio degli eventi e avvisi automatici per infrastrutture e applicazioni in esecuzione su AWS.
Per chi è ideale Amazon CloudWatch?
Amazon CloudWatch è particolarmente adatto per team SRE focalizzati su AWS e ingegneri di infrastruttura cloud in aziende di medie e grandi dimensioni.
Perché ho scelto Amazon CloudWatch
Ho scelto Amazon CloudWatch come uno dei migliori perché offre monitoraggio e osservabilità nativi di AWS senza configurazioni aggiuntive. Mi piace poter raccogliere e visualizzare metriche, log ed eventi di tutte le risorse AWS in un unico posto. Il mio team utilizza i suoi allarmi automatici e dashboard per monitorare in tempo reale lo stato dell'infrastruttura cloud e le prestazioni delle applicazioni.
Funzionalità principali di Amazon CloudWatch
- Metriche personalizzate: Invia e monitora metriche specifiche dell'applicazione insieme ai dati delle risorse AWS.
- Log Insights: Esegui query e analizza i dati dei log in modo interattivo per attività di troubleshooting.
- Rilevamento anomalie: Rileva automaticamente schemi anomali delle metriche utilizzando il machine learning.
- Monitoraggio sintetico: Simula le interazioni utente per monitorare la disponibilità e la latenza degli endpoint.
Integrazioni di Amazon CloudWatch
Amazon CloudWatch offre integrazioni native con oltre 70 servizi AWS, tra cui Amazon EC2, Amazon S3, Amazon API Gateway e Amazon RDS. Supporta anche l'integrazione con Amazon OpenSearch Service e mette a disposizione un'API per integrazioni personalizzate.
Pros and Cons
Pros:
- Integrazione profonda con servizi e risorse AWS
- Supporta metriche e dashboard personalizzate
- Permessi granulari grazie all'integrazione con AWS IAM
Cons:
- Visibilità limitata sugli ambienti non AWS
- Nessun workflow di gestione incidenti integrato
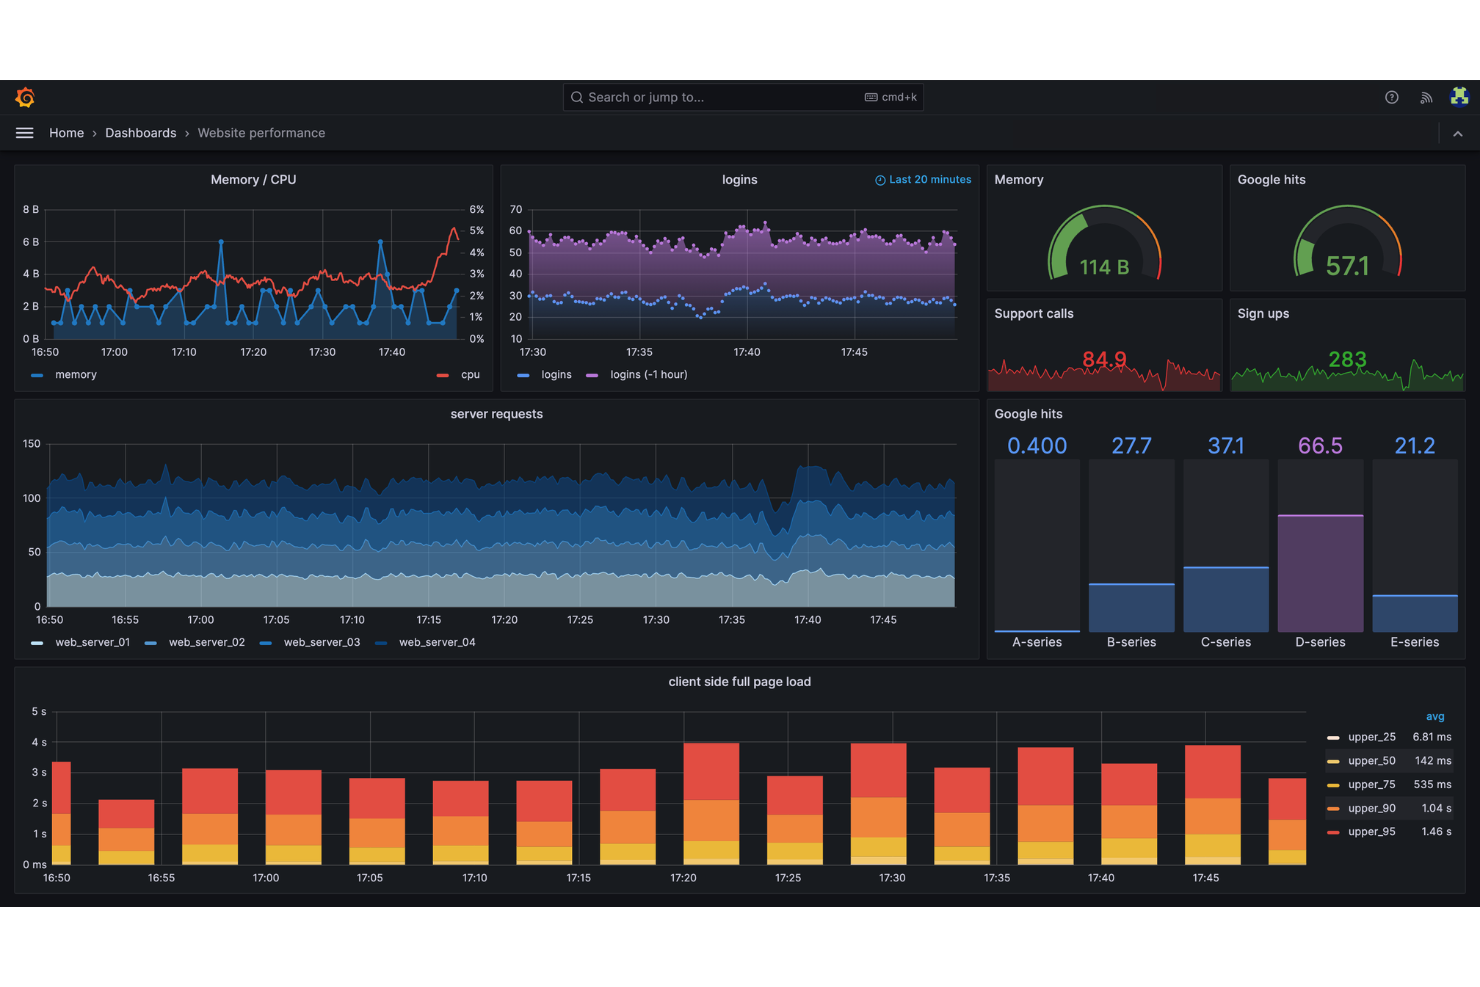
Grafana Labs è una piattaforma open-source di monitoraggio e analisi per site reliability engineer che consente di visualizzare, interrogare e correlare dati di serie temporali provenienti da più fonti in dashboard personalizzabili.
Per chi è più indicato Grafana Labs?
Grafana Labs è particolarmente adatto ai site reliability engineer e ai team DevOps di organizzazioni che necessitano di visualizzare e analizzare metriche da fonti di dati eterogenee.
Perché ho scelto Grafana Labs
Ho scelto Grafana Labs come uno dei migliori perché mi affido alle sue dashboard open-source per visualizzare serie temporali di dati da Prometheus, Loki e altre fonti in un unico luogo. Mi piace poter costruire pannelli e avvisi personalizzati per le metriche SRE, e poi condividere queste dashboard con il mio team. Il mio team usa Grafana Labs per correlare log, metriche e tracce al fine di rispondere più rapidamente agli incidenti.
Funzionalità principali di Grafana Labs
- Controllo degli accessi basato sui ruoli: Gestisci i permessi utente e limita l'accesso alle dashboard sensibili.
- Plugin per sorgenti dati: Connettiti a database come MySQL, PostgreSQL, InfluxDB ed Elasticsearch.
- Supporto per annotazioni: Segna eventi direttamente sulle dashboard per fornire contesto durante le revisioni degli incidenti.
- Modelli di dashboard: Utilizza variabili per creare dashboard dinamiche e riutilizzabili per diversi ambienti o team.
Integrazioni di Grafana Labs
Grafana Labs offre integrazioni native con MongoDB, AppDynamics, Jira, Oracle, GitLab, Salesforce, Splunk e mette a disposizione un'API per integrazioni personalizzate.
Pros and Cons
Pros:
- Supporta l'aggregazione di dati da più fonti in dashboard
- PromQL consente interrogazioni avanzate sulle metriche
- Solido ecosistema di plugin open-source
Cons:
- I dati ad alta cardinalità possono influenzare le prestazioni
- Il supporto per il tracing distribuito è limitato
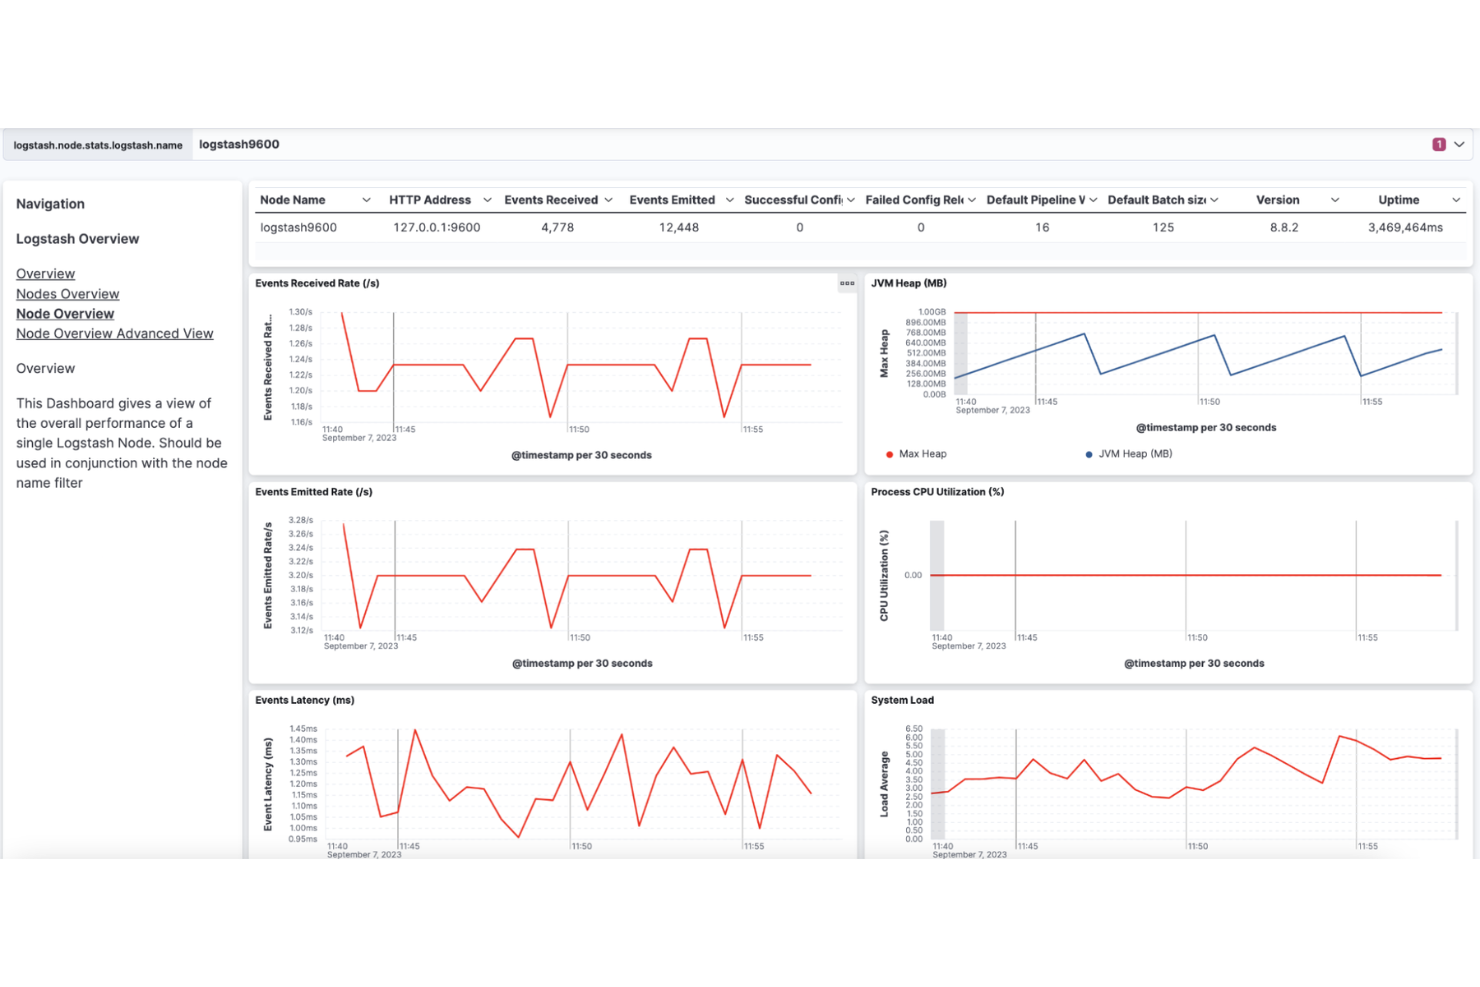
Logstash è uno strumento di pipeline dati in tempo reale per il monitoraggio SRE che acquisisce, trasforma e inoltra log e dati di evento da fonti diverse verso vari output.
A Chi È Adatto Logstash?
Logstash è particolarmente indicato per SRE e team IT di grandi aziende che hanno bisogno di centralizzare e gestire grandi volumi di log e dati su eventi.
Perché Ho Scelto Logstash
Ho scelto Logstash come uno dei migliori strumenti perché faccio affidamento sulla sua pipeline dati in tempo reale per acquisire, trasformare e inoltrare log da decine di fonti. Il mio team sfrutta il suo ricco ecosistema di plugin per analizzare, arricchire e indirizzare i dati verso Elasticsearch e altri output. Apprezzo la possibilità di costruire pipeline complesse per il monitoraggio SRE senza dover scrivere codice personalizzato per ogni fonte dati.
Funzionalità Chiave di Logstash
- Gestione centralizzata delle pipeline: Configura e monitora più pipeline da un'unica interfaccia.
- Supporto esteso ai codec: Gestisce vari formati dati come JSON, CSV e syslog.
- Code persistenti: Mette in buffer gli eventi su disco per prevenire la perdita di dati durante i guasti.
- Coda dei messaggi non recapitabili: Cattura e isola gli eventi che hanno avuto esito negativo per una successiva revisione e risoluzione dei problemi.
Integrazioni di Logstash
Logstash offre oltre 200 plugin nativi per input, filtri e output, inclusi collegamenti nativi con Elasticsearch, Amazon S3, Kafka, JDBC e AWS CloudWatch, e fornisce un'API per lo sviluppo di plugin personalizzati.
Pros and Cons
Pros:
- Gestisce l'analisi e l'arricchimento di log complessi
- Offre code persistenti per la durabilità dei dati
- Configurazione della pipeline flessibile per flussi di lavoro personalizzati
Cons:
- La risoluzione degli errori nella pipeline può essere complessa
- Problemi di compatibilità dei plugin dopo aggiornamenti maggiori
InfluxDB è un database di serie temporali e una piattaforma di monitoraggio progettata per i team SRE che necessitano di raccogliere, archiviare e analizzare metriche di rete e infrastruttura ad alto volume.
Per chi è ideale InfluxDB?
InfluxDB è particolarmente adatto per SRE e team DevOps in organizzazioni che gestiscono il monitoraggio di rete e infrastruttura ad alto throughput.
Perché ho scelto InfluxDB
Ho scelto InfluxDB tra i migliori perché è progettato specificamente per dati di serie temporali ad alte prestazioni, che sono essenziali per il monitoraggio di rete su larga scala. Mi piace poter acquisire, archiviare e interrogare milioni di metriche al secondo senza ritardi. Il mio team utilizza il linguaggio di query Flux per analizzare i modelli di traffico di rete e rilevare anomalie in tempo reale. La flessibilità dello schema di InfluxDB ci consente di adattarci rapidamente man mano che evolvono le nostre esigenze di monitoraggio.
Funzionalità principali di InfluxDB
- Supporto nativo all'agente Telegraf: Raccoglie metriche da centinaia di fonti tramite plugin leggeri.
- Policy di aggregazione e conservazione dei dati: Gestisce automaticamente lo storage aggregando ed eliminando i dati più vecchi.
- Dashboard personalizzabili: Permette di costruire visualizzazioni per dati di rete in tempo reale e storici.
- Motore di allerta: Attiva notifiche basate su soglie e condizioni definite dall'utente.
Integrazioni di InfluxDB
InfluxDB offre integrazioni native con Telegraf, Grafana, Kapacitor, Chronograf e MQTT, e mette a disposizione un'API per integrazioni personalizzate.
Pros and Cons
Pros:
- Gestisce grandi volumi di dati di serie temporali in ingresso
- Policy di conservazione e aggregazione flessibili
- Il linguaggio di query Flux consente analisi avanzate
Cons:
- Mancano funzionalità di machine learning integrate
- Nessun sistema di allerta nativo nella versione open source
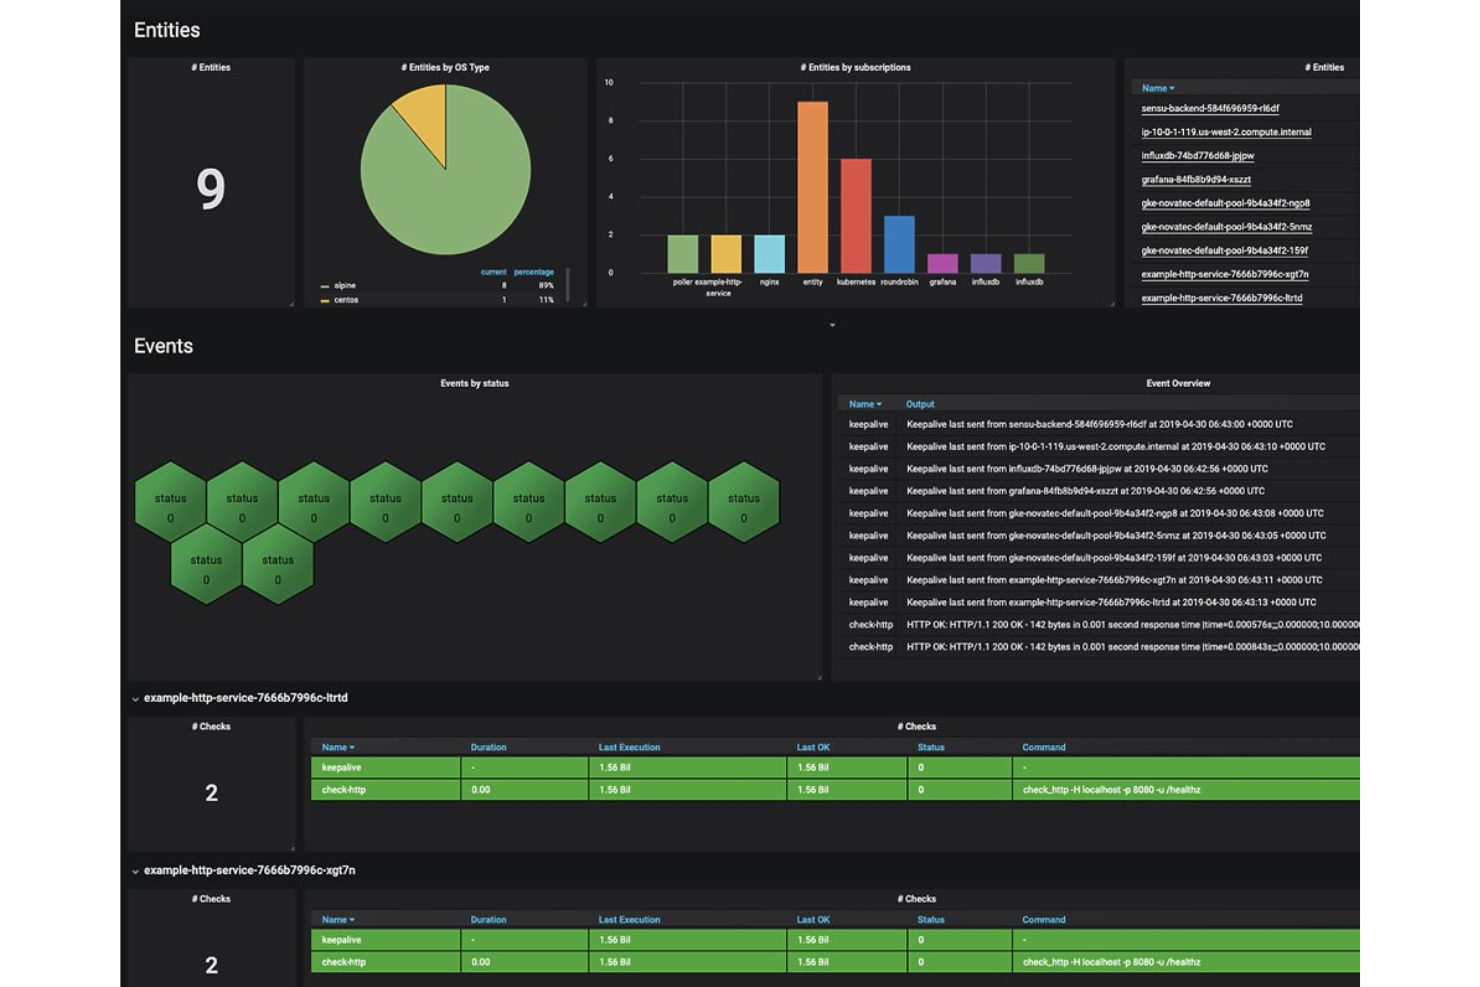
Sensu è una piattaforma di monitoraggio open-source per SRE che offre elaborazione degli eventi, controlli di salute, raccolta di telemetria e rimedio automatico per infrastrutture dinamiche e ambienti cloud-native.
Per chi è ideale Sensu?
Sensu è particolarmente adatto a SRE e team DevOps che gestiscono infrastrutture complesse e dinamiche in ambienti cloud-native o ibridi.
Perché ho scelto Sensu
Ho scelto Sensu come uno dei migliori perché apprezzo la flessibilità di monitoraggio che offre per infrastrutture dinamiche, specialmente in contesti cloud-native e ibridi. Il mio team utilizza il suo event pipeline per automatizzare i controlli di salute, la raccolta della telemetria e i flussi di rimedio. Mi affido al suo supporto per controlli e plugin personalizzati per adattare il monitoraggio ai nostri ambienti specifici.
Caratteristiche principali di Sensu
- Controllo degli accessi basato sui ruoli: Gestione dei permessi utente e accesso alle risorse di monitoraggio.
- Silenziare e modalità manutenzione: Soppressione temporanea degli avvisi durante manutenzioni pianificate o problemi noti.
- Gestione integrata dei segreti: Archivia e gestisci in modo sicuro le credenziali sensibili per i controlli e gli handler.
- Scoperta dinamica delle entità: Registrazione e deregistrazione automatica dei componenti infrastrutturali durante lo scaling.
Integrazioni Sensu
Sensu offre integrazioni native con PagerDuty, Slack, InfluxDB, Nagios, Prometheus e ServiceNow, oltre a fornire un'API per integrazioni personalizzate.
Pros and Cons
Pros:
- Supporta plugin personalizzati per esigenze di monitoraggio uniche
- Gestisce infrastrutture dinamiche su larga scala
- L'event pipeline consente flussi di rimedio automatizzati
Cons:
- La sintassi di configurazione può risultare complessa per i principianti
- Visualizzazione e dashboarding integrati limitati
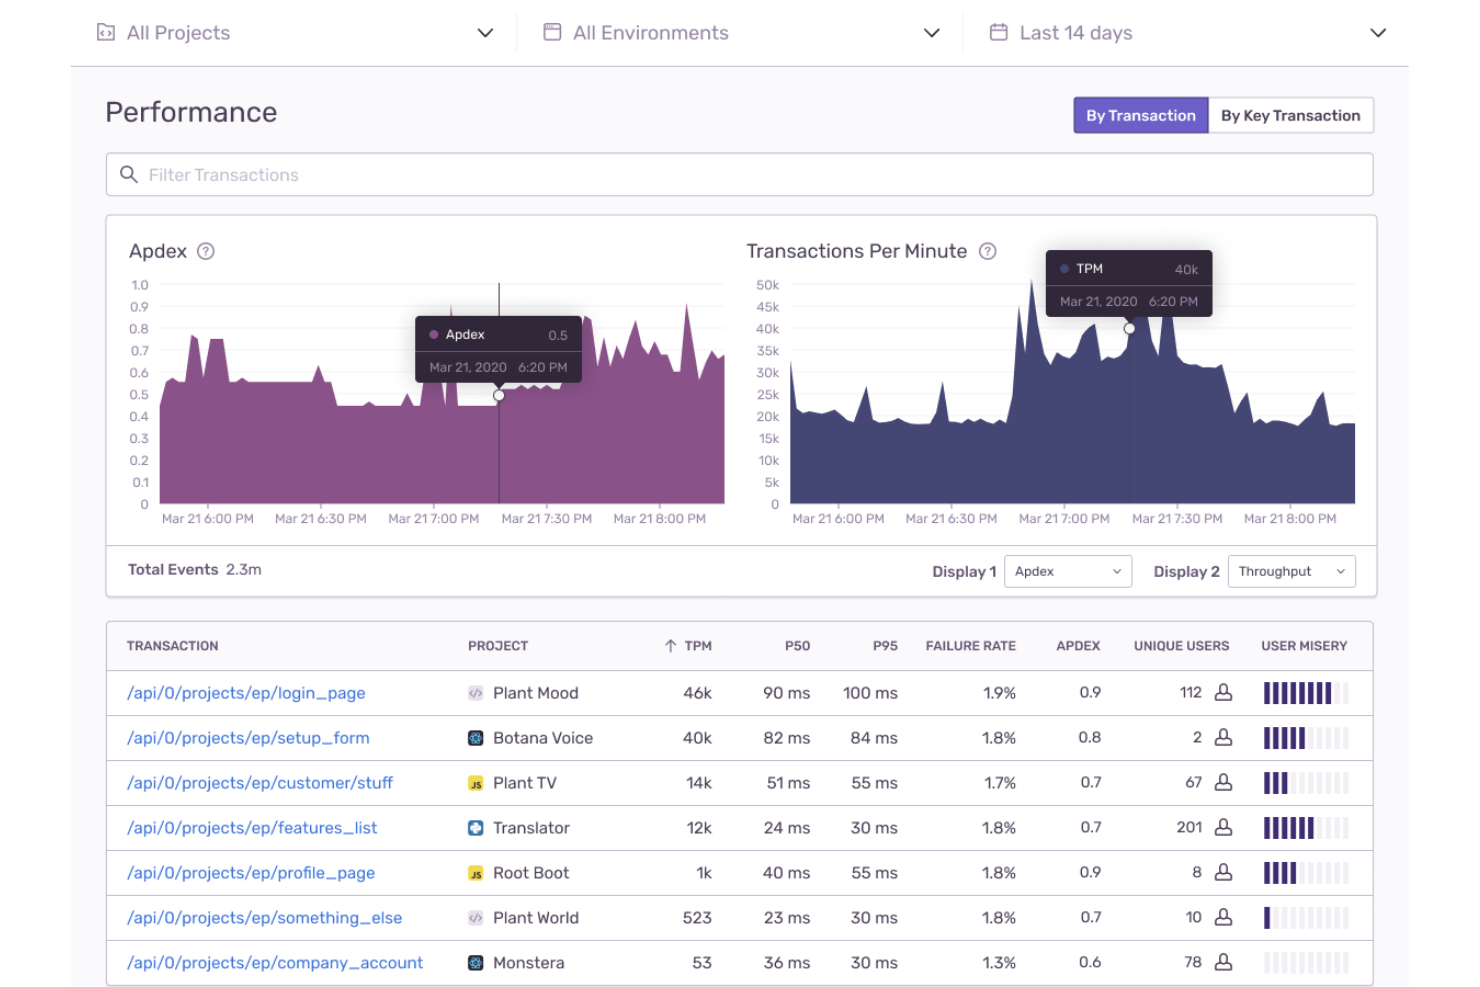
Sentry è una piattaforma di monitoraggio delle applicazioni per ingegneri dell'affidabilità dei siti che si concentra sul tracciamento degli errori in tempo reale, sul monitoraggio delle prestazioni e sulla salute dei rilasci attraverso diversi linguaggi di programmazione e framework.
Per chi è ideale Sentry?
Sentry è adatto a team di ingegneria presso aziende tecnologiche che necessitano di visibilità in tempo reale sugli errori delle applicazioni e sulle prestazioni.
Perché ho scelto Sentry
Ho scelto Sentry come uno dei migliori perché faccio affidamento sul suo tracciamento degli errori in tempo reale per individuare i problemi non appena si verificano. Mi piace come raggruppa gli errori in base alla causa principale e fornisce dettagliate tracce dello stack, il che aiuta il mio team a individuare e risolvere rapidamente i problemi. La funzione di monitoraggio dello stato dei rilasci ci consente di controllare la stabilità delle nuove distribuzioni senza necessità di configurazioni aggiuntive.
Caratteristiche principali di Sentry
- Monitoraggio delle prestazioni: Monitora la latenza delle applicazioni, la velocità di elaborazione e le tracce delle transazioni tra servizi.
- Etichettatura degli ambienti: Filtra e analizza gli errori per ambiente, come produzione, staging o sviluppo.
- Monitoraggio dell'impatto sugli utenti: Visualizza quali utenti sono colpiti da errori specifici o crash.
- Integrazioni con terze parti: Connettiti a strumenti come Slack, Jira e GitHub per notifiche e automazione dei flussi di lavoro.
Integrazioni Sentry
Sentry offre integrazioni native con Slack, Jira, GitHub, GitLab, Trello, PagerDuty, Datadog, Microsoft Teams, Bitbucket e Azure DevOps. Una API è disponibile per integrazioni personalizzate.
Pros and Cons
Pros:
- Tracciamento degli errori in tempo reale con contesto dettagliato
- Monitoraggio dello stato dei rilasci per nuove distribuzioni
- Supporta diversi linguaggi di programmazione e framework
Cons:
- Funzionalità limitate di monitoraggio di infrastruttura e server
- Non include funzionalità di aggregazione o analisi dei log integrate
New Product Updates from Sentry

Sentry Adds Heatmaps to Application Metrics
Sentry introduced heatmaps for Application Metrics to visualize metric value distributions over time, helping teams spot patterns like latency bursts and use heatmaps in Custom Dashboards. For more information, visit Sentry's official site.
 .
.Altri strumenti di monitoraggio SRE
Ecco alcune soluzioni di monitoraggio SRE aggiuntive che non sono entrate nella mia shortlist, ma che vale comunque la pena considerare:


Come valuto gli strumenti di monitoraggio SRE
Divido la mia valutazione in due livelli: la base che ogni piattaforma SRE deve raggiungere e i fattori differenzianti che fanno la differenza.
Funzionalità di base (Requisiti indispensabili per questa lista)
Queste funzionalità di base servono come criteri di accettazione per l'inclusione nella mia lista:
- Osservabilità Full-Stack: Controllo se metriche, log e tracce sono unificati in una singola vista correlata—e non in dashboard separate che costringono a cambiare contesto durante un'interruzione.
- Monitoraggio SLO e Error Budget: Definire indicatori di livello di servizio e osservare i tassi di consumo in tempo reale è il modo in cui i team SRE danno priorità al lavoro; quindi valuto quanto ogni strumento supporta nativamente questo workflow.
- Allerta e risposta agli incidenti: Cerco avvisi multi-condizione con instradamento delle chiamate e politiche di escalation che si integrano nativamente con strumenti come PagerDuty o Opsgenie.
- Rilevamento anomalie e RCA: Quando un servizio degrada, valuto se lo strumento evidenzia segnali correlati e cause probabili, oppure se invia solo una marea di avvisi non collegati.
- Monitoraggio sintetico e reale degli utenti: Controlli proattivi di uptime e monitoraggio dell'esperienza utente reale (RUM) a livello di sessione aiutano a identificare i problemi prima che li segnalino gli utenti.
- Integrazioni e standard di telemetria: Il supporto per OpenTelemetry, Prometheus, i principali cloud provider e Kubernetes è essenziale—verifico l'ampiezza e la profondità del catalogo di integrazione.
Valuto ogni fornitore su una scala da 0 (funzionalità non presente) a 5 (eccelle in quest'area) per ciascun criterio.
I fornitori devono raggiungere un punteggio medio minimo per essere considerati nella mia lista. Da qui in poi, considero cosa distingue ogni piattaforma.
Fattori differenzianti (Cosa distingue i fornitori)
Dopo aver creato la mia lista, ecco come confronto e metto in contrasto i diversi fornitori:
Caratteristiche distintive
Le analisi predittive basate su intelligenza artificiale individuano i rischi di affidabilità latenti prima che si aggravino, un aspetto critico negli ambienti in rapida espansione. Considero anche la mappatura della topologia che scopre automaticamente le dipendenze tra microservizi, aiutando i team a individuare l'estensione degli effetti negativi durante incidenti caotici. Per gli scenari avanzati, si distingue l'instrumentazione basata su eBPF per la raccolta di telemetria granulare e a basso impatto, senza agenti o modifiche al codice.
Oltre le caratteristiche
Il modello di pricing qui è importante—una fatturazione basata sull'ingestione può diventare insostenibile quando si inviano milioni di serie temporali da un cluster Kubernetes, quindi valuto come ogni fornitore gestisca i controlli sui costi come tiering dei dati e limiti di cardinalità. Anche la scalabilità ad alta cardinalità è un altro fattore che considero, poiché spesso le performance delle query peggiorano all'aumentare delle combinazioni di label. Per i team regolamentati, verifico le certificazioni SOC 2 Type II, HIPAA e FedRAMP insieme a RBAC e audit logging.
Come scegliere gli strumenti di monitoraggio SRE
È facile perdersi tra lunghe liste di funzionalità e tariffe complicate. Per aiutarti a restare concentrato durante il tuo processo di selezione software, ecco una checklist di fattori da tenere a mente:
| Fattore | Cosa considerare |
| Scalabilità | Lo strumento è in grado di gestire le dimensioni attuali e future della tua infrastruttura? Cerca supporto comprovato per ambienti grandi e dinamici. |
| Integrazioni | Si collega nativamente ai tuoi strumenti di allerta, ticketing e messaggistica? Verifica la compatibilità con il tuo stack esistente. |
| Personalizzazione | Puoi personalizzare controlli, avvisi e workflow secondo le necessità del team? Valuta il supporto per plugin o script personalizzati. |
| Facilità d’uso | Il tuo team sarà in grado di adottare e gestire rapidamente lo strumento? Considera la curva di apprendimento e la chiarezza dell’interfaccia. |
| Implementazione e onboarding | Quanto tempo richiede il deploy e la configurazione? Chiedi del supporto per la migrazione, della documentazione e delle risorse di onboarding disponibili. |
| Costo | I livelli di prezzo sono trasparenti e prevedibili? Considera sia i costi iniziali sia quelli ricorrenti, inclusi moduli aggiuntivi o tariffe basate sull’utilizzo. |
| Tutele di sicurezza | Lo strumento offre crittografia, controlli di accesso e audit log? Assicurati che risponda agli standard di sicurezza della tua azienda. |
| Disponibilità del supporto | C’è un supporto reattivo quando ne hai bisogno? Verifica copertura 24/7, SLA e accesso a competenze tecniche. |
Cosa sono gli strumenti di monitoraggio SRE?
Gli strumenti di monitoraggio SRE sono piattaforme software che aiutano gli site reliability engineer a tracciare, analizzare e rispondere alle prestazioni e all'affidabilità dei sistemi. Questi strumenti forniscono strumentazione per raccogliere metriche, log e tracce, supportando la visibilità end-to-end su applicazioni e infrastrutture. Si integrano con piattaforme di gestione degli incidenti e flussi di lavoro come la pianificazione dei turni di reperibilità per avvisare i tecnici in servizio gestendo l’intero ciclo di vita degli incidenti. Funzionalità come runbook e orchestrazione aiutano ad automatizzare le risposte e la risoluzione degli incidenti. Gli strumenti SRE si collegano anche con APM, gestione della configurazione e infrastructure as code (IaC), supportando processi di provisioning e debug.
Funzionalità degli strumenti di monitoraggio SRE
Quando scegli gli strumenti di monitoraggio SRE, fai attenzione alle seguenti caratteristiche fondamentali:
- Raccolta di metriche in tempo reale: Raccoglie continuamente dati sulle prestazioni di sistema e applicazioni, fornendo informazioni sempre aggiornate per monitoraggio proattivo e risoluzione dei problemi.
- Alerting personalizzato: Consente di definire soglie e condizioni specifiche che scatenano notifiche, così il tuo team può rispondere rapidamente a incidenti e anomalie.
- Risposta automatizzata agli incidenti: Supporta flussi di lavoro che eseguono automaticamente passaggi di correzione o l’escalation dei problemi in base a regole predefinite, riducendo l’intervento manuale.
- Controllo degli accessi basato sui ruoli: Consente di gestire i permessi utente e limitare l’accesso ai dati di monitoraggio sensibili e alle impostazioni di configurazione.
- Supporto all’integrazione: Si collega nativamente con strumenti popolari per alerting, ticketing, messaggistica e gestione delle infrastrutture, rendendo più efficienti i flussi di lavoro.
- Conservazione storica dei dati: Archivia i dati di monitoraggio nel tempo, consentendo analisi delle tendenze, pianificazione della capacità e revisioni post-incidente.
- Scoperta dinamica delle entità: Rileva e registra automaticamente nuovi componenti infrastrutturali mentre l’ambiente cresce o cambia.
- Gestione dei segreti: Conserva e gestisce in modo sicuro credenziali od informazioni sensibili necessarie per controlli, integrazioni o attività di automazione.
- Modalità manutenzione: Consente di sopprimere temporaneamente gli avvisi durante interventi di manutenzione programmata o interruzioni note, evitando notifiche inutili.
- Supporto per plugin personalizzati: Permette di estendere le funzionalità di monitoraggio con script o plugin su misura per i tuoi sistemi e requisiti specifici.
Funzionalità comuni di AI negli strumenti di monitoraggio SRE
Oltre alle funzionalità di base elencate sopra, molte di queste soluzioni stanno integrando l’intelligenza artificiale con caratteristiche come:
- Rilevamento delle anomalie: Utilizza algoritmi di AI per identificare automaticamente schemi insoliti o deviazioni nelle metriche di sistema, aiutando i team a intercettare incidenti prima che si aggravino.
- Alerting predittivo: Sfrutta il machine learning per prevedere possibili outage o problemi di prestazioni sulla base di dati storici e tendenze, consentendo interventi proattivi.
- Analisi automatizzata della causa radice: Applica l’AI per correlare eventi e log, individuando la probabile origine degli incidenti e riducendo il tempo necessario per indagini manuali.
- Riduzione intelligente del rumore: Filtra e raggruppa gli avvisi correlati tramite AI, minimizzando l’affaticamento da alert e mostrando solo le notifiche più rilevanti e azionabili.
- Prioritizzazione degli incidenti: Utilizza l’AI per valutare l’impatto potenziale degli incidenti e classificarli automaticamente, aiutando il team a concentrarsi prima sulle problematiche più critiche.
Benefici degli strumenti di monitoraggio SRE
L’implementazione di strumenti di monitoraggio SRE porta vantaggi sia per il team che per l’azienda. Ecco alcuni benefici a cui puoi puntare:
- Risposta più rapida agli incidenti: L’automazione degli avvisi e dei flussi di lavoro per gli incidenti consente al tuo team di individuare e risolvere i problemi più velocemente, riducendo i tempi di inattività.
- Affidabilità del sistema migliorata: Il monitoraggio continuo e le funzionalità di remediation proattiva supportano una maggiore disponibilità e servizi più stabili.
- Pianificazione delle risorse più efficiente: La conservazione dei dati storici e l’analisi delle tendenze permettono una pianificazione della capacità e un’ottimizzazione dell’infrastruttura più intelligenti.
- Riduzione dell’affaticamento da alert: Le notifiche intelligenti e la riduzione del rumore assicurano che il team riceva solo segnalazioni su cui possa effettivamente intervenire.
- Maggiore sicurezza e conformità: Il controllo degli accessi basato sui ruoli e la gestione dei segreti proteggono i dati sensibili e supportano i requisiti normativi.
- Collaborazione semplificata: L’integrazione con strumenti di messaggistica e ticketing mantiene tutti allineati durante gli incidenti e i postmortem.
- Scalabilità per ambienti dinamici: La scoperta dinamica delle entità e le integrazioni flessibili facilitano il monitoraggio di infrastrutture in crescita o in cambiamento.
Costi e prezzi degli strumenti di monitoraggio SRE
La scelta degli strumenti di monitoraggio SRE richiede la comprensione dei vari modelli e piani di prezzo disponibili. I costi variano in base alle funzionalità, alla dimensione del team, agli add-on e ad altri fattori. La tabella qui sotto riassume i piani più comuni, i loro prezzi medi e le funzionalità tipiche incluse nelle soluzioni di strumenti di monitoraggio SRE:
Tabella di confronto dei piani per strumenti di monitoraggio SRE
| Tipo di piano | Prezzo medio | Funzionalità comuni |
| Piano gratuito | $0 | Monitoraggio di base, segnalazione limitata, supporto della community e accesso per un piccolo team. |
| Piano personale | $5-$25/user/month | Maggiori metriche, segnalazioni personalizzate, integrazioni con strumenti di messaggistica e reportistica di base. |
| Piano business | $25-$75/user/month | Risposta avanzata agli incidenti, controllo degli accessi basato sui ruoli, conservazione storica dei dati e supporto migliorato. |
| Piano enterprise | $75-$150/user/month | Supporto per plugin personalizzati, scoperta dinamica delle entità, funzionalità di sicurezza avanzate, onboarding dedicato e SLA. |
FAQ sugli Strumenti di Monitoraggio SRE
Ecco alcune risposte alle domande più comuni sugli strumenti di monitoraggio SRE:
In cosa differiscono gli strumenti di monitoraggio SRE dalle soluzioni di monitoraggio tradizionali?
Gli strumenti di monitoraggio SRE si concentrano sulle pratiche di ingegneria dell’affidabilità, offrendo funzionalità come la risposta automatizzata agli incidenti, il budget degli errori e la scoperta dinamica dell’infrastruttura. Gli strumenti di monitoraggio tradizionali possono solo tracciare metriche e inviare avvisi, mentre gli strumenti SRE aiutano i team a gestire obiettivi di affidabilità e semplificare i flussi di lavoro legati agli incidenti.
Gli strumenti di monitoraggio SRE possono integrarsi con le toolchain DevOps esistenti?
Sì, la maggior parte degli strumenti di monitoraggio SRE offre integrazioni con piattaforme DevOps popolari, sistemi di ticketing, app di messaggistica e pipeline CI/CD. Questo permette al tuo team di collegare i dati di monitoraggio con la gestione degli incidenti, la collaborazione e le automazioni che già utilizzi.
Cosa devo considerare quando scalo gli strumenti di monitoraggio SRE in un ambiente in crescita?
Cerca soluzioni che supportano la scoperta dinamica delle entità, integrazioni flessibili e una conservazione dei dati scalabile. Assicurati che lo strumento possa gestire un aumento di volume dati, utenti aggiuntivi e infrastrutture più complesse senza problemi di prestazioni o costi eccessivi.
Ci sono rischi di sicurezza nell'implementazione degli strumenti di monitoraggio SRE?
Sì, come per qualsiasi soluzione di monitoraggio, ci sono considerazioni di sicurezza. Scegli strumenti con solidi controlli di accesso, archiviazione dei dati crittografata e registrazione degli audit. Esamina come lo strumento gestisce le credenziali sensibili e assicurati che sia conforme alle politiche di sicurezza della tua organizzazione.
Quanto tempo serve per implementare uno strumento di monitoraggio SRE?
I tempi di implementazione variano a seconda dello strumento e della complessità dell’ambiente. Molte soluzioni offrono guide rapide, template e supporto all’onboarding, così i piccoli team possono iniziare in poche ore o giorni. Ambienti più ampi o complessi possono richiedere una pianificazione maggiore e un’implementazione graduale.