Datadog vs. Prometheus: Comparison and Expert Reviews for 2026


Choosing between Datadog and Prometheus means weighing an all-in-one, fully managed platform against a flexible, open-source powerhouse—both stand out as top cloud monitoring tools for teams who need deep visibility and reliable alerting. If you want a plug-and-play solution with seamless integrations and minimal maintenance, Datadog delivers a polished experience. If you prefer total control, custom metrics, and open-source extensibility, Prometheus puts you in the driver’s seat.
This article breaks down how each tool handles real-world monitoring challenges, so you can confidently pick the right fit for your infrastructure, team, and future growth.
Datadog vs. Prometheus: An Overview
Datadog
Prometheus

Why Trust Our Software Reviews
We’ve been testing and reviewing software since 2023. As tech leaders ourselves, we know how critical and difficult it is to make the right decision when selecting software.
We invest in deep research to help our audience make better software purchasing decisions. We’ve tested more than 2,000 tools for different tech use cases and written over 1,000 comprehensive software reviews. Learn how we stay transparent & our software review methodology.
Datadog vs. Prometheus Pricing Comparison
| Datadog | Prometheus | |
|---|---|---|
| Free Trial | Free plan available | Free to use |
| Pricing | From $15/host/month (billed annually) | No licensing cost |
Datadog vs. Prometheus Pricing & Hidden Costs
Datadog uses a subscription-based pricing model, charging per host, feature, and data volume. You pay for what you use, but costs can add up quickly as you enable more integrations, increase data retention, or scale your environment. Prometheus, on the other hand, is open-source and free to use, but you’ll need to factor in the costs of hosting, maintaining, and scaling your own monitoring infrastructure. Hidden costs with Prometheus often come from the time and resources needed for setup, ongoing management, and integrating with visualization or alerting tools.
To choose the right pricing model, look beyond the sticker price and consider your team’s capacity for ongoing maintenance, the complexity of your environment, and your need for support or advanced features. If you want predictable costs and minimal operational overhead, a managed service like Datadog may be worth the premium. If you have the expertise and resources to manage your own stack—and value flexibility—Prometheus could offer long-term savings. Evaluate the total cost of ownership, including both direct expenses and the time your team will spend on setup and support.
Datadog vs. Prometheus Feature Comparison
Datadog and Prometheus overlap heavily in their core purpose: both are monitoring and alerting tools designed to track the performance of infrastructure and applications using time-series metrics. Each supports real-time data collection, alerting, and visualization, helping teams detect issues and analyze system behavior in distributed environments. They also integrate with modern cloud-native stacks and are commonly used for container and Kubernetes monitoring, making them foundational tools in DevOps observability workflows.
Where they diverge is in scope and philosophy. Datadog stands out as a fully managed, SaaS-based observability platform that goes beyond metrics to include logs, traces, security monitoring, and even machine learning–driven insights in a single unified interface. Prometheus, by contrast, is uniquely powerful as an open-source, self-hosted system with a pull-based metrics model and flexible query language (PromQL), offering deep customization and control—especially in Kubernetes environments—but requiring additional tools for full observability.
| Datadog | Prometheus | |
|---|---|---|
| AI Integration | ||
| API | ||
| Automated Testing | ||
| Browser Compatibility Testing | ||
| Bug Tracking | ||
| Code Review | ||
| Custom Reports | ||
| Data Export | ||
| Data Import | ||
| Developer Tools | ||
| External Integrations | ||
| Malware Protection | ||
| Multi-User | ||
| Notifications | ||
| Performance Testing | ||
| Process Reporting | ||
| Static Analysis | ||
| Status Notifications | ||
| Workflow Management |
Datadog vs. Prometheus Integrations
| Integration | Datadog | Prometheus |
| AWS CloudWatch | ✅ | ✅ |
| Microsoft Azure | ✅ | ✅ |
| Google Cloud | ✅ | ✅ |
| Kubernetes | ✅ | ✅ |
| Slack | ✅ | ✅ |
| PagerDuty | ✅ | ✅ |
| Salesforce | ✅ | ✅ |
| ServiceNow | ✅ | ✅ |
| Jenkins | ✅ | ✅ |
| Docker | ✅ | ✅ |
| API | ✅ | ✅ |
| Zapier | ✅ | ❌ |
Datadog has a significantly broader and more plug-and-play integration ecosystem, offering hundreds of native integrations across cloud providers, databases, SaaS tools, and infrastructure, along with APIs and an agent that automatically collects and unifies data from these sources. Prometheus, by contrast, relies on a more modular model built around exporters and APIs, integrating deeply with cloud-native tools like Kubernetes but typically requiring manual setup and additional components (e.g., Grafana or custom pipelines) to extend functionality.
Datadog vs. Prometheus Security, Compliance & Reliability
| Factor | Datadog | Prometheus |
| Data Encryption | Encrypts data in transit and at rest using industry standards. | Supports TLS for data in transit; at-rest encryption requires custom setup. |
| Regulatory Compliance | Offers built-in support for SOC 2, GDPR, HIPAA, and more. | Compliance depends on your deployment and configuration choices. |
| Access Controls | Provides granular role-based access controls and SSO integration. | Basic authentication and authorization; advanced controls require add-ons. |
| High Availability | Delivers managed, multi-region redundancy and automated failover. | Requires manual setup for redundancy and failover. |
| Audit Logging | Includes detailed audit logs and monitoring of user actions. | Audit logging must be configured and managed by the user. |
Datadog leads with built-in security, compliance, and reliability features that reduce your operational burden, while Prometheus puts more responsibility on your team to configure and maintain these protections. Datadog’s managed environment is ideal if you need strong compliance and minimal hands-on security work, while Prometheus gives you flexibility but demands more expertise and vigilance.
Datadog vs. Prometheus Ease of Use
| Factor | Datadog | Prometheus |
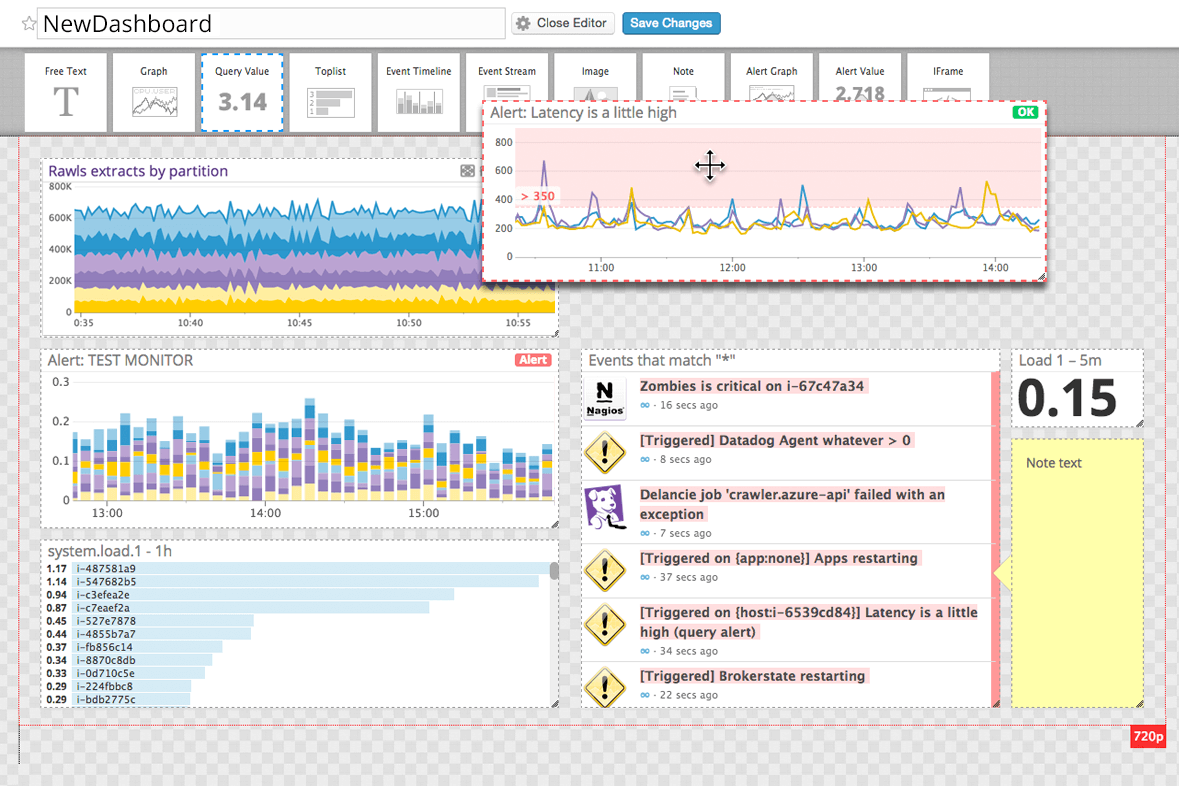
| User Interface | Offers a polished, intuitive dashboard with drag-and-drop widgets. | Provides a basic web UI focused on querying and metrics. |
| Onboarding | Guided setup, in-app tutorials, and extensive documentation speed up adoption. | Requires manual configuration and a steeper learning curve. |
| Setup Process | Fast, automated agent installation and integration setup. | Involves manual deployment, configuration, and integration work. |
| Support | 24/7 support, live chat, and a large knowledge base. | Community-driven support with forums and open-source resources. |
| Customization | Prebuilt templates and easy-to-use customization options. | Highly customizable but requires YAML and scripting knowledge. |
Datadog is much easier to get started with and manage day to day, while Prometheus rewards users who want to build and customize everything from the ground up. Datadog’s user-friendly interface and support make it ideal for teams who want quick wins, while Prometheus is best for those who value flexibility and don’t mind a hands-on approach.
Datadog vs Prometheus: Pros & Cons
Datadog
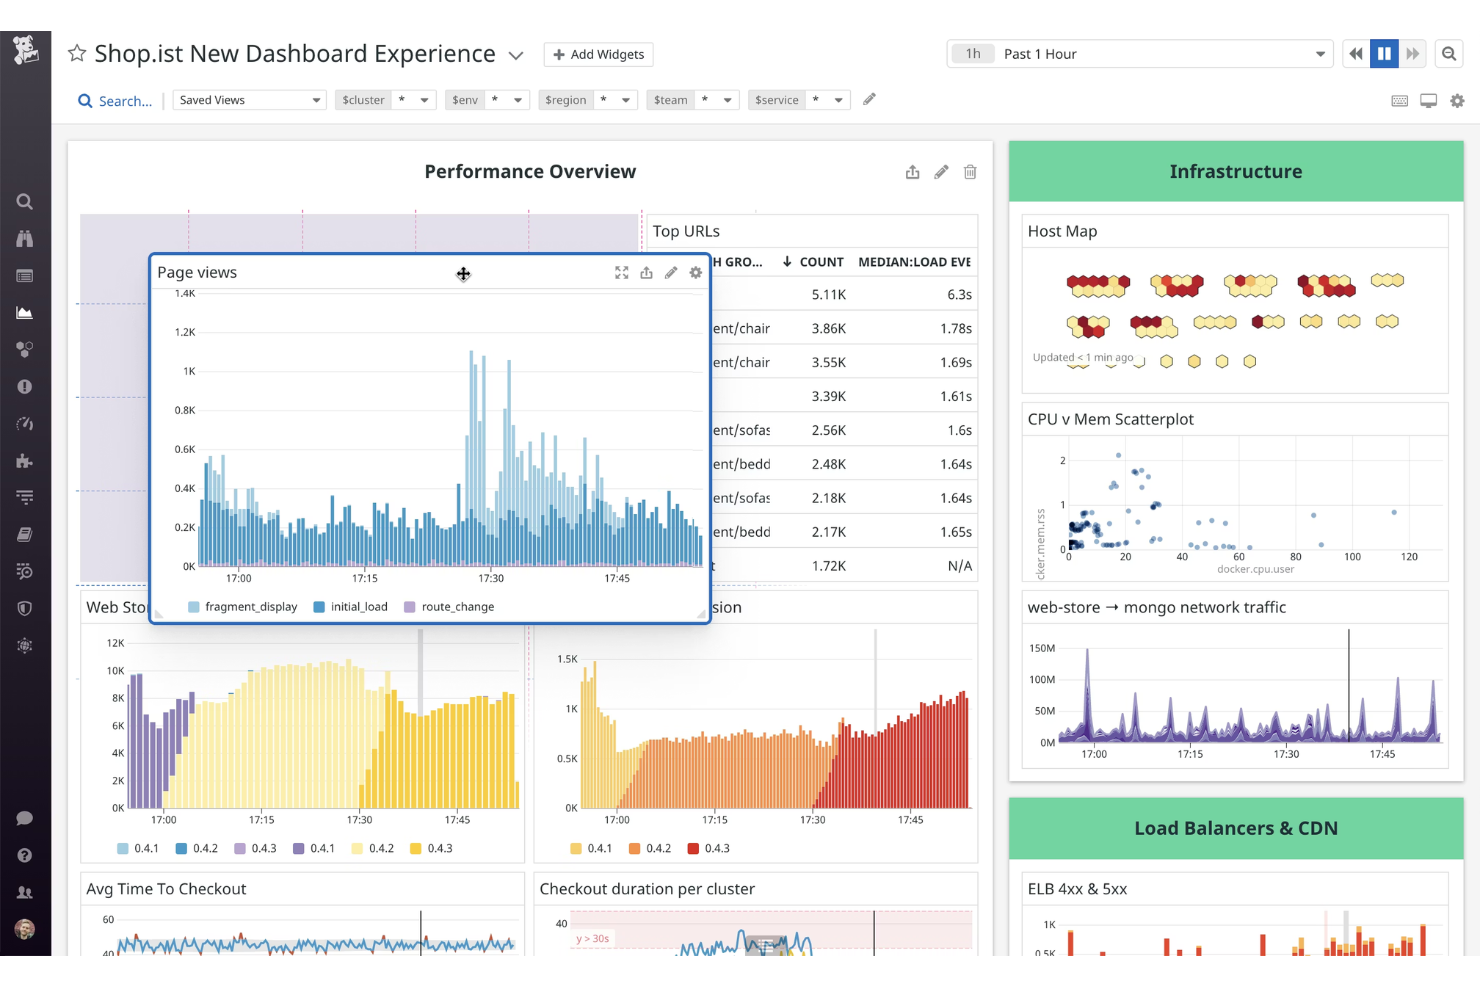
- Highly customizable dashboards for visualizing key metrics
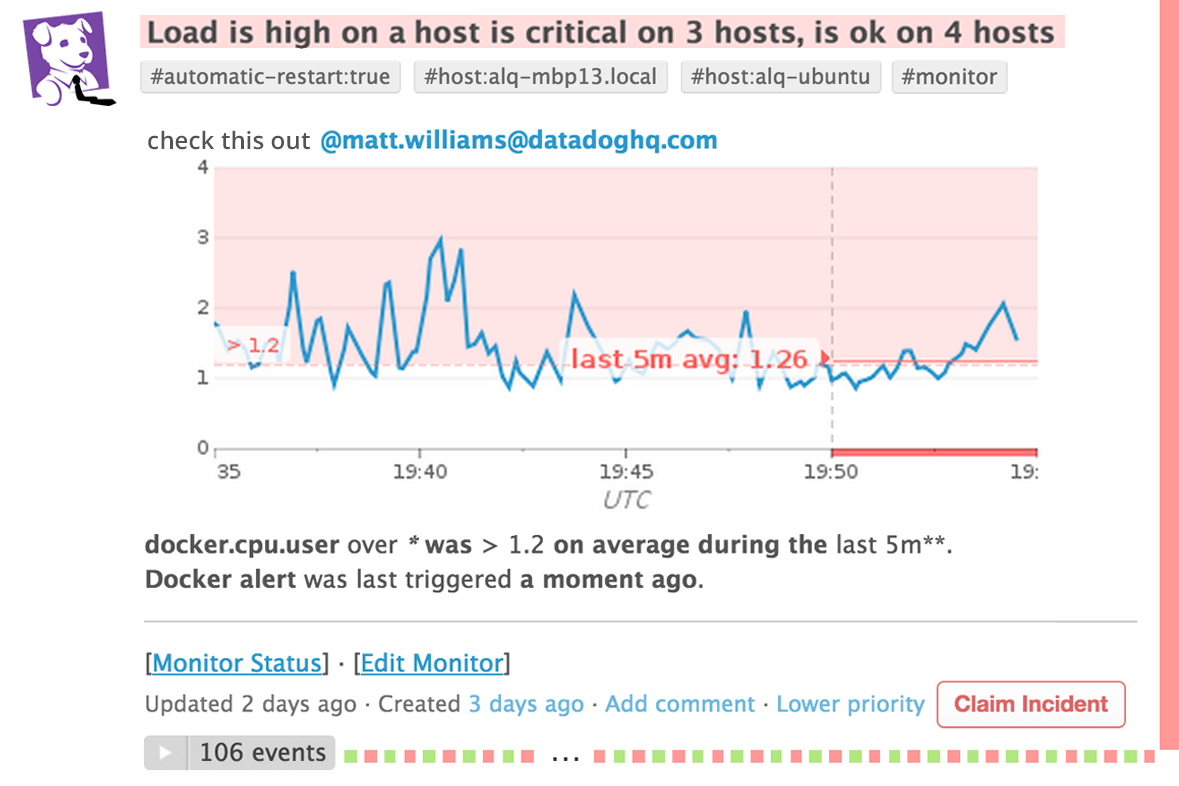
- Advanced alerting and anomaly detection features
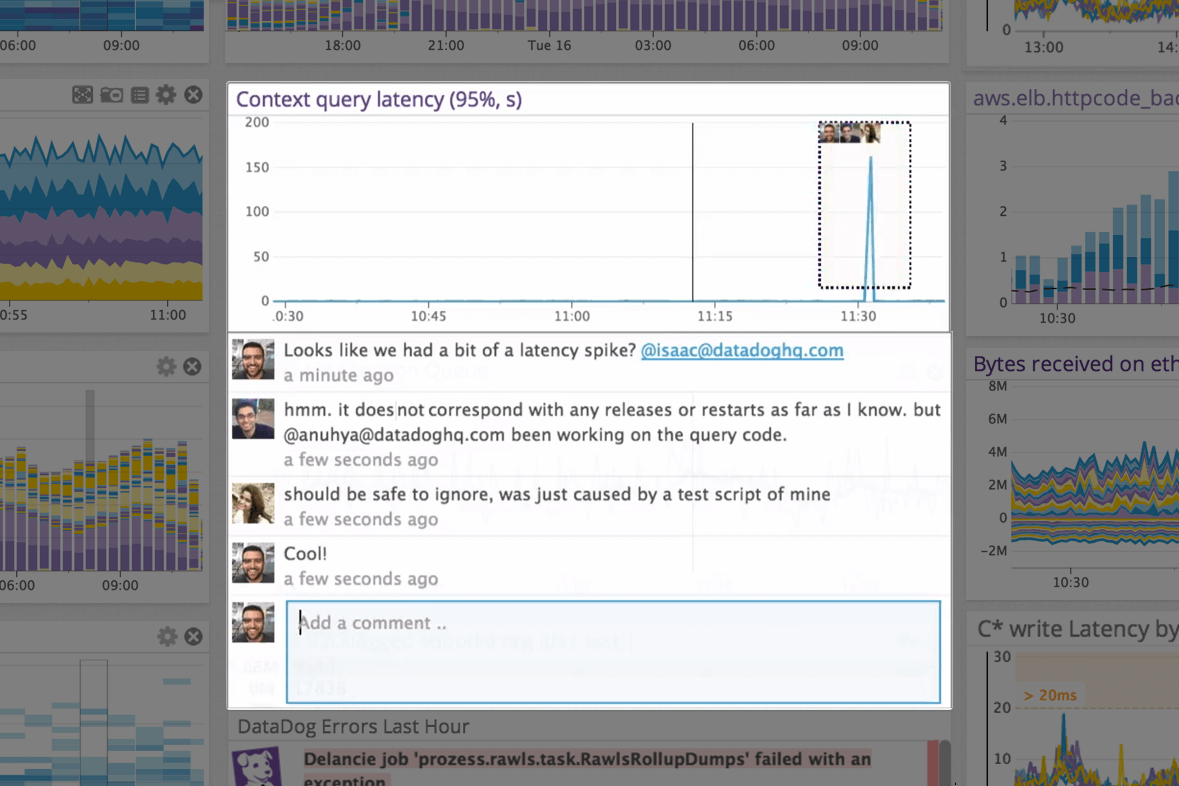
- Real-time monitoring across infrastructure, applications, and logs
- Setup complexity grows in large or hybrid environments
- Data retention limits can restrict historical analysis
- Pricing increases quickly with data volume and features
Prometheus
- Prometheus's real-time alerting helps your team react swiftly to system changes.
- It offers extensive customization for monitoring metrics that matter to your work.
- The open-source nature allows you to tailor it exactly to your IT environment.
- Prometheus's steep learning curve might challenge your newer team members.
- Its lack of native long-term storage can complicate historical data analysis.
- The complex setup may require more initial time investment from your team.
Best Use Cases for Datadog and Prometheus
Datadog
- Hybrid IT Departments Unified dashboards simplify monitoring across on-premises and cloud resources.
- Ecommerce Platforms Transaction tracing and anomaly detection support high-traffic reliability.
- SaaS Providers End-to-end application monitoring ensures uptime and user experience.
- DevOps Teams Automated alerting and integrations streamline incident response and troubleshooting.
- Large Enterprises Centralized observability and advanced analytics help manage sprawling infrastructure.
- Cloud-Native Startups Datadog’s real-time monitoring and automation support rapid scaling and deployment.
Prometheus
- Cloud Services Prometheus is perfect for monitoring dynamic cloud environments due to its real-time data processing and alerting capabilities.
- Large Enterprises Its scalability ensures your team can monitor extensive networks and infrastructure without performance issues.
- Tech Startups You can leverage its open-source nature for cost-effective, customizable solutions in fast-paced development environments.
- IT Departments Prometheus provides your team with the tools needed for detailed system monitoring and prompt issue detection.
- DevOps Teams Its customizable metrics and alerting systems are tailored for your continuous integration and deployment processes.
- Data Centers Prometheus excels in environments requiring precise monitoring and quick response to hardware or network changes.
Who Should Use Datadog, And Who Should Use Prometheus?
Datadog is best suited for teams that want an all-in-one, fully managed observability platform without the overhead of maintaining their own monitoring infrastructure. It’s a strong fit for mid-sized to large organizations, especially those running complex, multi-cloud or hybrid environments that need unified visibility across metrics, logs, and traces in one place. Teams with less in-house DevOps bandwidth—or those who prioritize ease of use, fast setup, and built-in integrations—will benefit most from Datadog’s SaaS approach.
Prometheus, on the other hand, is ideal for engineering-driven teams that prefer open-source tools and want full control over their monitoring stack. It’s especially well-suited for Kubernetes-heavy environments and organizations that are comfortable managing their own infrastructure and stitching together tools like Grafana for visualization. Startups, platform teams, and companies with strong DevOps maturity often choose Prometheus for its flexibility, powerful query language, and cost efficiency at scale.
Differences Between Datadog and Prometheus
| Datadog | Prometheus | |
|---|---|---|
| Automation | Built-in automation for alerting, integrations, and workflows. | Requires manual setup and scripting for automation. |
| Data Retention | Managed, configurable retention with long-term storage options. | Retention depends on local storage and manual management. |
| Deployment Model | Fully managed SaaS platform with hosted infrastructure. | An open-source, self-hosted monitoring system you manage. |
| Observability | Unified platform covering metrics, logs, traces, and security monitoring. | Metrics-focused tool requiring additional tools for full observability stack. |
| Setup & Maintenance | Minimal setup required, no infrastructure to manage internally. | Requires ongoing setup, scaling, and maintenance effort. |
| Read Datadog ReviewOpens new window | Read Prometheus ReviewOpens new window |
Similarities Between Datadog and Prometheus
| API Access | Each tool provides robust APIs for custom integrations and data export, supporting automation and scripting. |
|---|---|
| Alerting | Both offer flexible alerting systems—Datadog with built-in workflows, Prometheus with custom alert rules. |
| Cloud Monitoring | Both provide deep visibility into cloud infrastructure and applications, supporting AWS, Azure, and GCP. |
| Kubernetes Support | Both are widely used for Kubernetes monitoring, with native integrations and strong community adoption. |
| Read Datadog ReviewOpens new window Read Prometheus ReviewOpens new window | |
| Real-Time Metrics | Each delivers real-time metric collection and visualization, helping you spot issues as they happen. |
| Time-Series Database | Both are built around a time-series data model, optimized for storing and querying metric data over time. |
| Read Datadog ReviewOpens new window Read Prometheus ReviewOpens new window | |