14 migliori alternative a Netdata per il 2026

Shortlist alternative a Netdata


Una valida alternativa a Netdata offre monitoraggio applicativo in tempo reale, integrazioni flessibili e visualizzazioni chiare per ambienti complessi. Se stai cercando alternative a Netdata, probabilmente hai bisogno di un sistema di monitoraggio scalabile che supporti le pratiche di osservabilità moderne e possa crescere insieme alla tua infrastruttura. Molti team cercano piattaforme all-in-one che offrano monitoraggio completo, funzionalità avanzate e integrazioni senza soluzione di continuità, mantenendo i costi contenuti e la facilità di implementazione. Questo elenco confronta le principali soluzioni per il 2026, aiutandoti a valutare funzionalità, facilità d’uso e capacità di monitoraggio per scegliere una soluzione intuitiva adatta all’infrastruttura e alle esigenze operative del tuo team.
Che cos’è Netdata?
Netdata è uno strumento di monitoraggio applicativo open source che fornisce informazioni in tempo reale sulle prestazioni di sistema, sull’utilizzo delle risorse e sulla salute delle applicazioni. Raccoglie metriche da server, container e applicazioni, mostrando i dati tramite dashboard interattivi. Netdata è utilizzato da specialisti IT e team operativi per individuare anomalie, risolvere problemi e mantenere un’infrastruttura affidabile. Il suo design leggero e le numerose integrazioni lo rendono adatto al monitoraggio sia di ambienti moderni che legacy.
Riepilogo migliori alternative a Netdata
u003cspan style=u0022font-weight: 400;u0022u003eQuesta tabella comparativa riepiloga i dettagli sui prezzi delle migliori alternative a Netdata selezionate, così puoi trovare quella più adatta al tuo budget e alle tue esigenze aziendali.u003c/spanu003e
| Tool | Best For | Trial Info | Price | ||
|---|---|---|---|---|---|
| 1 | Migliore per la visibilità sulle infrastrutture multi-cloud | Piano gratuito disponibile | Da $15/host/mese (fatturato annualmente) | Website | |
| 2 | Ideale per la correlazione tra frontend e backend | Prova gratuita di 14 giorni + demo gratuita disponibile | Da $49/host/mese (fatturato annualmente) | Website | |
| 3 | Ideale per il monitoraggio delle transazioni a livello aziendale | Versione di prova gratuita disponibile | Prezzo su richiesta | Website | |
| 4 | Ideale per il tracing distribuito in tempo reale | Piano gratuito disponibile | Da $49/utente/mese | Website | |
| 5 | Ideale per la raccolta di metriche temporali | Gratuito da usare | Nessun costo di licenza | Website | |
| 6 | Ideale con integrazioni dati open-source | Prova gratuita di 7 giorni + piano free disponibile | Da $99/mese | Website | |
| 7 | Ideale per visualizzazioni avanzate di dashboard | Piano gratuito disponibile | Da $19/mese | Website | |
| 8 | Ideale per il monitoraggio nativo delle risorse AWS | Prova gratuita disponibile | Prezzi su richiesta | Website | |
| 9 | Ideale per supporto agli ambienti ibridi | Prova gratuita di 30 giorni disponibile | Da $7/node/mese | Website | |
| 10 | Ideale per il monitoraggio degli errori nelle distribuzioni di codice | Piano gratuito + prova gratuita + demo gratuita disponibili | Da $26/mese (fatturazione annuale) | Website |
Perché Fidarti delle Nostre Recensioni Software
Testiamo e recensiamo software dal 2023. Come leader tecnologici, sappiamo quanto sia cruciale e difficile prendere la decisione giusta nella scelta di un software.
Investiamo in una ricerca approfondita per aiutare il nostro pubblico a effettuare scelte migliori di acquisto software. Abbiamo testato oltre 2.000 strumenti per diversi casi d’uso tecnologici e scritto più di 1.000 recensioni complete. Scopri come restiamo trasparenti e la nostra metodologia di recensione del software.
-

TestDevLab
Visit Website -
Site24x7
Visit WebsiteThis is an aggregated rating for this tool including ratings from Crozdesk users and ratings from other sites.4.7 -
GitHub Actions
Visit WebsiteThis is an aggregated rating for this tool including ratings from Crozdesk users and ratings from other sites.4.8


Recensioni alternative a Netdata
u003cspan style=u0022font-weight: 400;u0022u003eQui sotto trovi le mie sintesi approfondite delle migliori alternative a Netdata che sono entrate nella mia shortlist. Le recensioni offrono una panoramica dettagliata delle funzionalità, delle integrazioni e dei casi d’uso ideali di ciascuna piattaforma di monitoraggio, per aiutarti a trovare quella più adatta a te.u003c/spanu003e
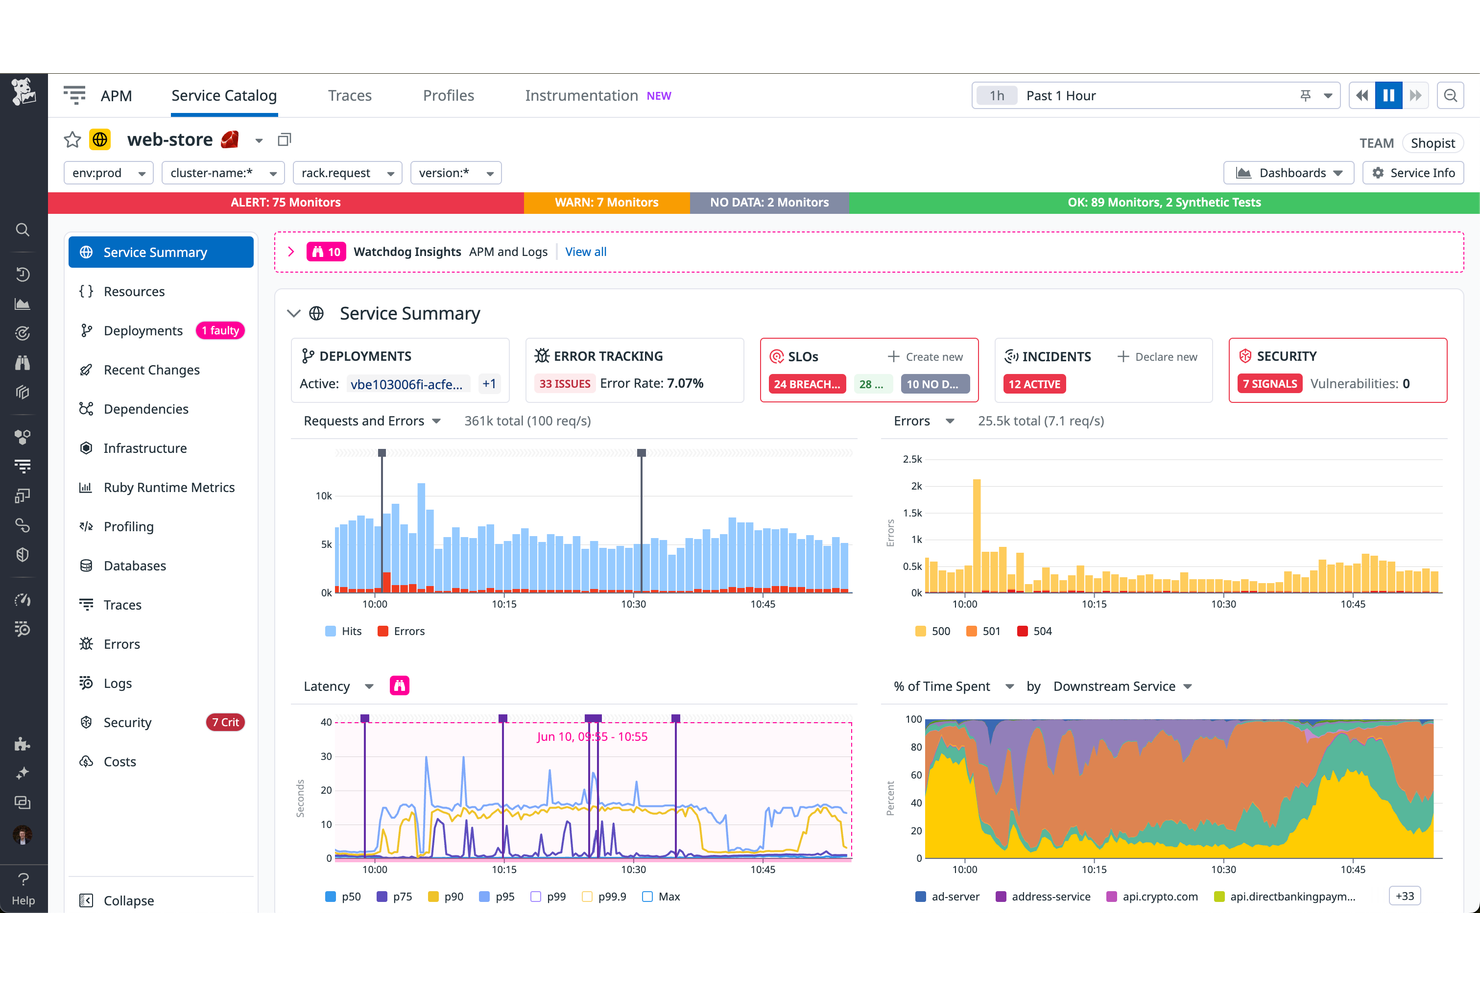
Datadog aiuta i team a monitorare in tempo reale le prestazioni dell'infrastruttura e le metriche di sistema su infrastruttura, applicazioni, servizi e dispositivi di rete come i router. Datadog si distingue da Netdata grazie alle sue integrazioni avanzate, dashboard personalizzabili e supporto per il monitoraggio delle modifiche di configurazione (gestione della configurazione) e dei sistemi distribuiti su larga scala.
Perché Datadog è una buona alternativa a Netdata
Quando cerco uno strumento di monitoraggio che eccella nella visibilità sulle infrastrutture multi-cloud, Datadog si distingue. La sua dashboard unificata permette di monitorare le risorse su AWS, Azure, Google Cloud e sistemi on-premises da un'unica interfaccia. Le funzionalità di auto-scoperta e tagging della piattaforma rendono facile tracciare le risorse man mano che l'ambiente cresce o cambia. Per i team che gestiscono infrastrutture ibride o distribuite, Datadog offre un livello di visibilità e controllo che va oltre ciò che propone Netdata.
Caratteristiche principali di Datadog
Altre funzionalità di Datadog lo rendono una scelta flessibile per il monitoraggio delle applicazioni:
- Gestione dei log in tempo reale: Raccogli, cerca e analizza i log da più fonti per identificare rapidamente problemi e tendenze.
- APM (Application Performance Monitoring): Traccia le richieste tra sistemi distribuiti e individua i colli di bottiglia nel codice delle applicazioni.
- Monitoraggio sintetico: Simula le interazioni degli utenti e monitora gli endpoint applicativi per garantire uptime e prestazioni.
- Monitoraggio della sicurezza: Rileva minacce e configurazioni errate in tempo reale correlando i segnali di sicurezza con i dati di infrastruttura e applicazioni.
Integrazioni Datadog
Le integrazioni includono AWS, Azure, Google Cloud, Kubernetes, Docker, Slack, PagerDuty, GitHub, Jira, ServiceNow e altre ancora.
Pros and Cons
Pros:
- Offre dashboard personalizzabili e in tempo reale
- Include funzionalità di sicurezza integrate
- Si integra con i principali strumenti DevOps e IT
Cons:
- La conservazione dei log è limitata nei piani inferiori
- Richiede l'installazione di un agente su ogni host monitorato
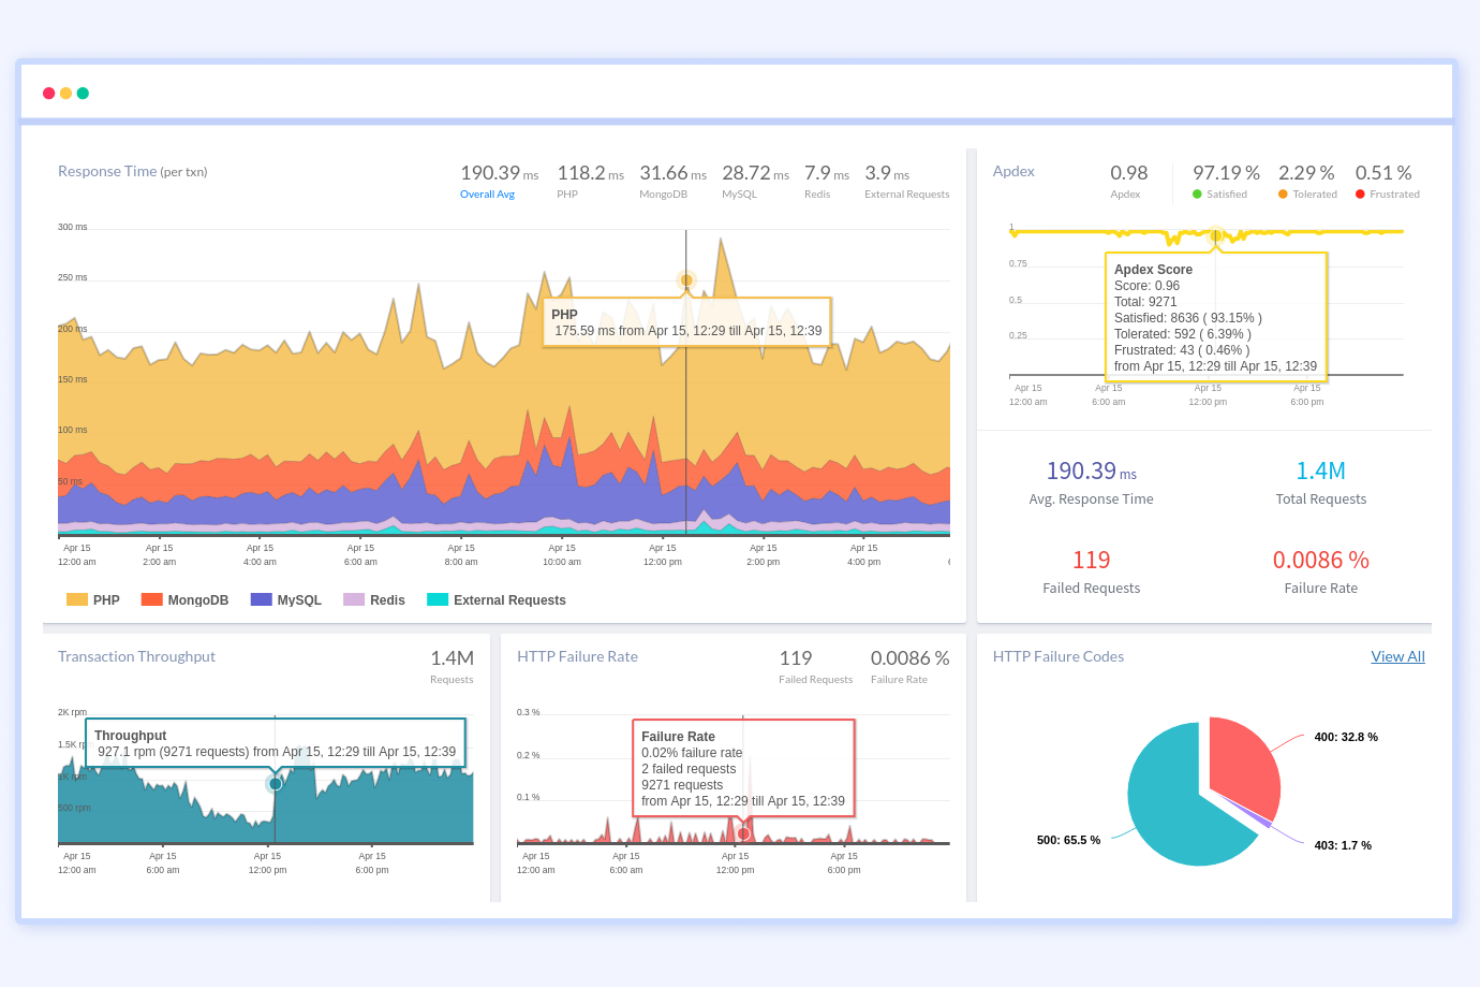
Se hai bisogno di tracciare i problemi sia nei sistemi frontend che backend, Atatus è stato progettato per offrire questo livello di visibilità. Questo strumento è ideale per i team IT e gli sviluppatori che desiderano correlare i problemi di esperienza utente con i dati sulle prestazioni del backend in tempo reale. A differenza di Netdata, Atatus collega il monitoraggio di browser, API e server per permetterti di individuare esattamente dove iniziano i problemi e come influenzano gli utenti.
Perché Atatus è una buona alternativa a Netdata
A differenza di Netdata, Atatus offre una visione unificata delle prestazioni sia del frontend sia del backend, rendendo più semplice individuare i problemi lungo tutto lo stack. Puoi monitorare errori del browser, chiamate API e metriche del server in un unico luogo, il che aiuta i team a collegare rapidamente i problemi di esperienza utente alle cause di backend. Apprezzo come Atatus visualizza l'intero percorso della transazione, così puoi vedere esattamente dove si verificano colli di bottiglia o errori. Questo livello di correlazione è particolarmente utile per i team IT e gli sviluppatori che devono risolvere incidenti complessi che coinvolgono più sistemi.
Funzionalità principali di Atatus
Altre funzionalità di Atatus aiutano i team a coprire una vasta gamma di esigenze di monitoraggio e risoluzione dei problemi:
- Real User Monitoring (RUM): Traccia le sessioni reali degli utenti e le metriche delle prestazioni dai browser.
- Gestione dei log: Raccoglie, ricerca e analizza i log da più fonti in un'unica dashboard.
- Dashboard personalizzate: Ti permette di creare viste personalizzate con i widget per le metriche più importanti per il tuo team.
- Avvisi e notifiche: Invia avvisi tramite canali come Slack, PagerDuty ed email quando vengono superate determinate soglie.
Integrazioni di Atatus
Le integrazioni includono Slack, Jira, Asana, PagerDuty, OpsGenie, VictorOps, BigPanda, Flowdock, HipChat, Campfire e altre ancora.
Pros and Cons
Pros:
- Gestione e ricerca dei log integrata
- Supporta avvisi verso diversi strumenti di gestione degli incidenti
- Dashboard personalizzate per metriche specifiche del team
Cons:
- Nessuna opzione di distribuzione on-premises
- Mancano plugin della community open source
Ideale per il monitoraggio delle transazioni a livello aziendale
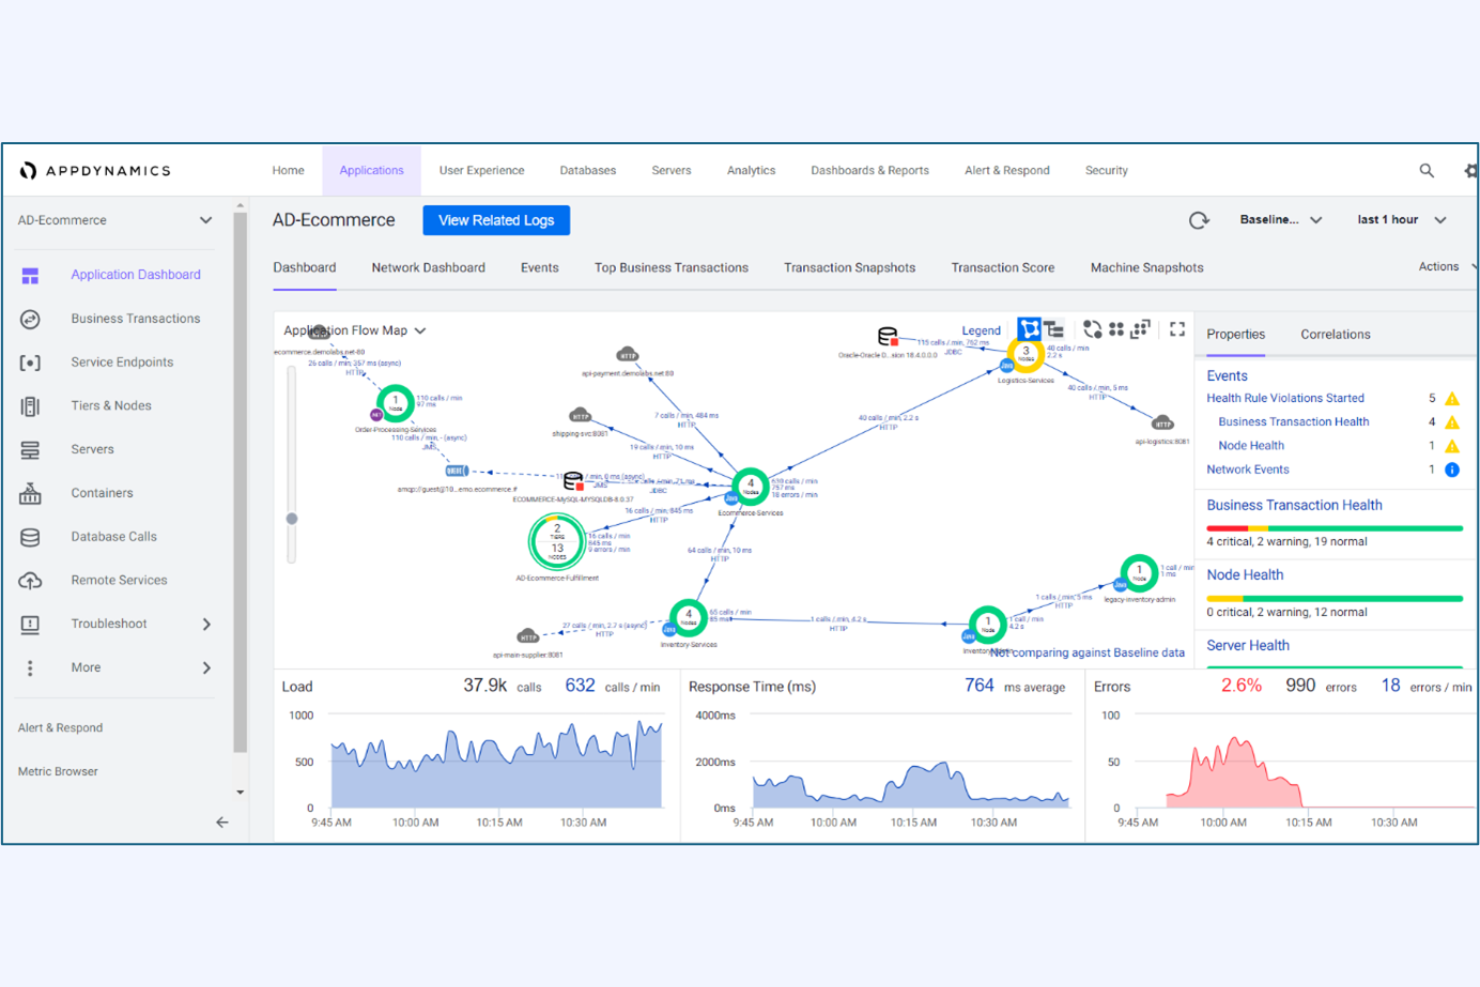
Per le organizzazioni che necessitano di una profonda visibilità sulle transazioni fondamentali per il business, AppDynamics offre monitoraggio e analisi a livello aziendale. È particolarmente adatto ai team IT delle grandi imprese che devono tracciare transazioni complesse e distribuite su più servizi. A differenza di Netdata, AppDynamics fornisce un tracciamento end-to-end delle transazioni e un'analisi dell'impatto sul business, aiutando i team a individuare e risolvere rapidamente i colli di bottiglia nelle prestazioni.
Perché AppDynamics è una valida alternativa a Netdata
AppDynamics è progettato appositamente per monitorare transazioni complesse su scala aziendale che si estendono su più applicazioni e servizi. La sua funzione di tracciamento delle transazioni consente di seguire ogni fase di un processo aziendale, dall'interazione dell'utente ai sistemi di backend, cosa che Netdata non offre a questo livello di dettaglio. Apprezzo il modo in cui AppDynamics mette in correlazione le prestazioni applicative con i parametri di business, permettendo ai team IT di dare priorità ai problemi che influiscono sui ricavi o sull'esperienza dei clienti. Ciò lo rende una scelta forte per le organizzazioni che vogliono collegare il monitoraggio tecnico ai risultati aziendali.
Funzionalità principali di AppDynamics
Altre funzionalità di AppDynamics aiutano i team a gestire e ottimizzare i propri ambienti:
- Avvisi a baseline dinamica: Stabilisce automaticamente baseline di prestazioni e attiva avvisi quando le metriche si discostano dai modelli normali.
- Diagnostica a livello di codice: Fornisce informazioni dettagliate sull'esecuzione del codice per aiutare a identificare metodi lenti e chiamate problematiche al database.
- Cruscotti personalizzati: Permette agli utenti di creare visualizzazioni su misura per team, applicazioni o unità di business specifiche.
- Monitoraggio cloud-native: Supporta il monitoraggio di Kubernetes, AWS, Azure e altre piattaforme cloud.
Integrazioni di AppDynamics
Le integrazioni includono Splunk Platform, Splunk Observability Cloud, Splunk IT Service Intelligence, ThousandEyes, SAP Solutions, Log Observer Connect e altre.
Pros and Cons
Pros:
- Correlazione tra impatto sul business e incidenti
- Diagnostica a livello di codice per le problematiche applicative
- Baselining dinamico per il rilevamento delle anomalie
Cons:
- Supporto limitato per exporter open-source
- La conservazione delle metriche personalizzate è limitata dal piano

Se hai bisogno di una visibilità approfondita e in tempo reale nelle applicazioni distribuite, New Relic è progettato proprio per questa sfida. È particolarmente adatto a team IT e site reliability engineer che vogliono tracciare le richieste attraverso microservizi e ambienti cloud-native. A differenza di Netdata, New Relic è specializzato nel tracing distribuito end-to-end e nell'analisi dettagliata delle transazioni per stack complessi e moderni.
Perché New Relic è una valida alternativa a Netdata
Per i team che devono seguire ogni richiesta in tempo reale nei sistemi distribuiti, New Relic offre un livello di tracing che Netdata non raggiunge. La sua funzione di tracing distribuito permette di visualizzare e analizzare le transazioni mentre si spostano tra microservizi, API e funzioni serverless. Apprezzo come i dati di tracing di New Relic siano collegati direttamente a log e metriche, facilitando l’individuazione della causa principale dei problemi di performance. Questo focus sulla visibilità in tempo reale, end-to-end, è particolarmente prezioso per gli ambienti moderni e cloud-native.
Funzionalità principali di New Relic
Altre funzionalità offerte da New Relic rafforzano le sue capacità di monitoraggio:
- Monitoraggio dell’infrastruttura: Monitora in tempo reale la salute e le prestazioni di server, container e risorse cloud.
- Monitoraggio sintetico: Esegui test utente automatizzati e simulati per monitorare l’uptime applicativo e la reattività degli endpoint.
- Dashboard personalizzate: Crea e condividi visualizzazioni utilizzando una vasta gamma di metriche e fonti dati.
- Avvisi e gestione degli incidenti: Imposta policy di avviso flessibili e integra strumenti di risposta agli incidenti per gestire tempestivamente i problemi.
Integrazioni di New Relic
Le integrazioni includono AWS, Azure, Google Cloud, Kubernetes, Docker, Jenkins, PagerDuty, Slack, ServiceNow, Prometheus e molto altro.
Pros and Cons
Pros:
- Tracing distribuito in tempo reale attraverso i microservizi
- Analisi dettagliata delle transazioni per applicazioni cloud-native
- Monitoraggio sintetico automatico per endpoint API
Cons:
- Limiti di conservazione dei dati nei piani di fascia bassa
- Metriche ad elevata cardinalità possono aumentare i costi
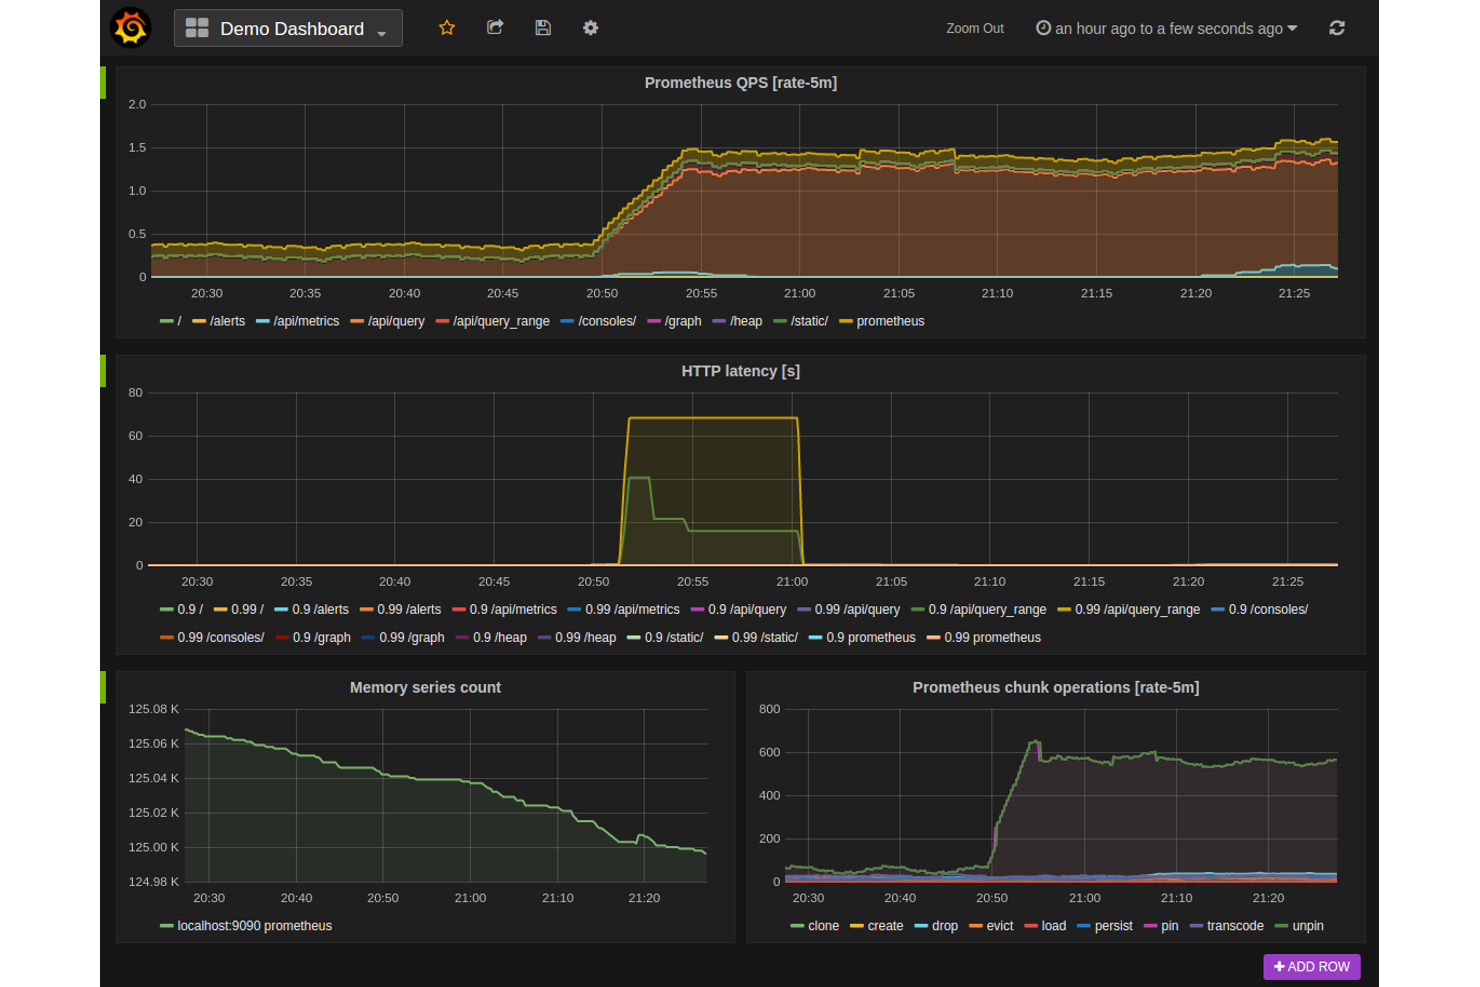
Prometheus è progettato appositamente per i team che necessitano di raccogliere e interrogare metriche temporali su larga scala. È particolarmente popolare tra specialisti IT e ingegneri dell'affidabilità (SRE) che desiderano una soluzione open-source e flessibile per il monitoraggio di infrastrutture e applicazioni. A differenza di Netdata, Prometheus offre un potente linguaggio di interrogazione e supporto nativo per dati multidimensionali, rendendolo una scelta valida per ambienti con requisiti complessi in termini di metriche.
Perché Prometheus è una buona alternativa a Netdata
Per i team focalizzati sulla raccolta e l'analisi delle metriche temporali, Prometheus offre un approccio specializzato che lo distingue da Netdata. Ho scelto Prometheus perché utilizza un modello di raccolta pull per l'acquisizione delle metriche, che consente un controllo dettagliato su quali dati raccogliere e quando. Il suo linguaggio di interrogazione PromQL permette di suddividere, aggregare e visualizzare le metriche con un elevato grado di flessibilità. Questo rende Prometheus particolarmente utile per gli specialisti IT che devono monitorare ambienti complessi e dinamici, oltre a voler costruire dashboard o regole di allerta personalizzate.
Caratteristiche principali di Prometheus
Altre funzionalità di Prometheus permettono ai team di gestire ed estendere la configurazione del monitoraggio:
- Integrazione con Alertmanager: Consente l'instradamento degli alert in base a regole personalizzate e supporta silenziamento e inibizione.
- Service Discovery: Rileva automaticamente i target in ambienti dinamici come Kubernetes o piattaforme cloud.
- Configurazione della conservazione dati: Consente di controllare la durata di archiviazione locale delle metriche.
- Ecosistema di exporter: Offre una vasta gamma di exporter per raccogliere metriche da sistemi e servizi di terze parti.
Integrazioni di Prometheus
Le integrazioni includono Kubernetes, Docker, Grafana, Alertmanager, Etcd, Consul, RabbitMQ, MySQL, Apache, HAProxy e altro ancora.
Pros and Cons
Pros:
- PromQL consente interrogazioni avanzate delle metriche
- Modello pull che supporta ambienti dinamici
- Vasto ecosistema di exporter per sistemi di terze parti
Cons:
- Manca la visualizzazione in tempo reale al secondo
- Richiede strumenti esterni per la creazione di dashboard

Per i team che desiderano unificare il monitoraggio delle applicazioni utilizzando fonti dati open-source, Elastic Observability offre un approccio flessibile. Questo strumento è particolarmente adatto a specialisti IT e team DevOps che hanno bisogno di acquisire, analizzare e correlare dati da un'ampia gamma di fonti open-source e personalizzate. A differenza di Netdata, Elastic Observability si integra profondamente con Elastic Stack, facilitando la combinazione di log, metriche e tracce provenienti da ambienti diversi.
Perché Elastic Observability è una buona alternativa a Netdata
Se hai bisogno di unificare dati provenienti da strumenti open-source e fonti personalizzate, Elastic Observability si distingue per la sua flessibilità. Ho scelto Elastic Observability perché permette di acquisire e correlare log, metriche e tracce da quasi qualsiasi fonte utilizzando Elastic Stack. Puoi utilizzare agenti e integrazioni open-source per monitorare tutto, dalle app cloud-native ai sistemi legacy. Questo approccio è particolarmente utile per i team IT che desiderano costruire una piattaforma di osservabilità unificata su misura per il proprio ambiente.
Funzionalità principali di Elastic Observability
Altre funzionalità di Elastic Observability aiutano i team a gestire e analizzare le prestazioni delle applicazioni su larga scala:
- Tracing distribuito: Visualizza i flussi delle richieste end-to-end tra microservizi e infrastruttura.
- Mappe dei servizi: Genera automaticamente mappe interattive delle dipendenze e dello stato dei servizi.
- Rilevamento anomalie: Utilizza il machine learning per identificare pattern insoliti nelle prestazioni delle applicazioni.
- Dashboard personalizzate: Ti permette di creare e condividere dashboard su misura per le esigenze di monitoraggio del tuo team.
Integrazioni APM di Elastic Observability
Le integrazioni includono Amazon CloudWatch, Azure Monitor, Google Cloud, Kubernetes, Prometheus, Jaeger, OpenTelemetry, PagerDuty, ServiceNow, Slack e altro ancora.
Pros and Cons
Pros:
- Supporta agenti open-source e acquisizione dati
- Offre tracing distribuito per microservizi
- Machine learning integrato per il rilevamento delle anomalie
Cons:
- Richiede un'infrastruttura separata per l'hosting autonomo
- Uso di risorse superiore rispetto ad agenti leggeri
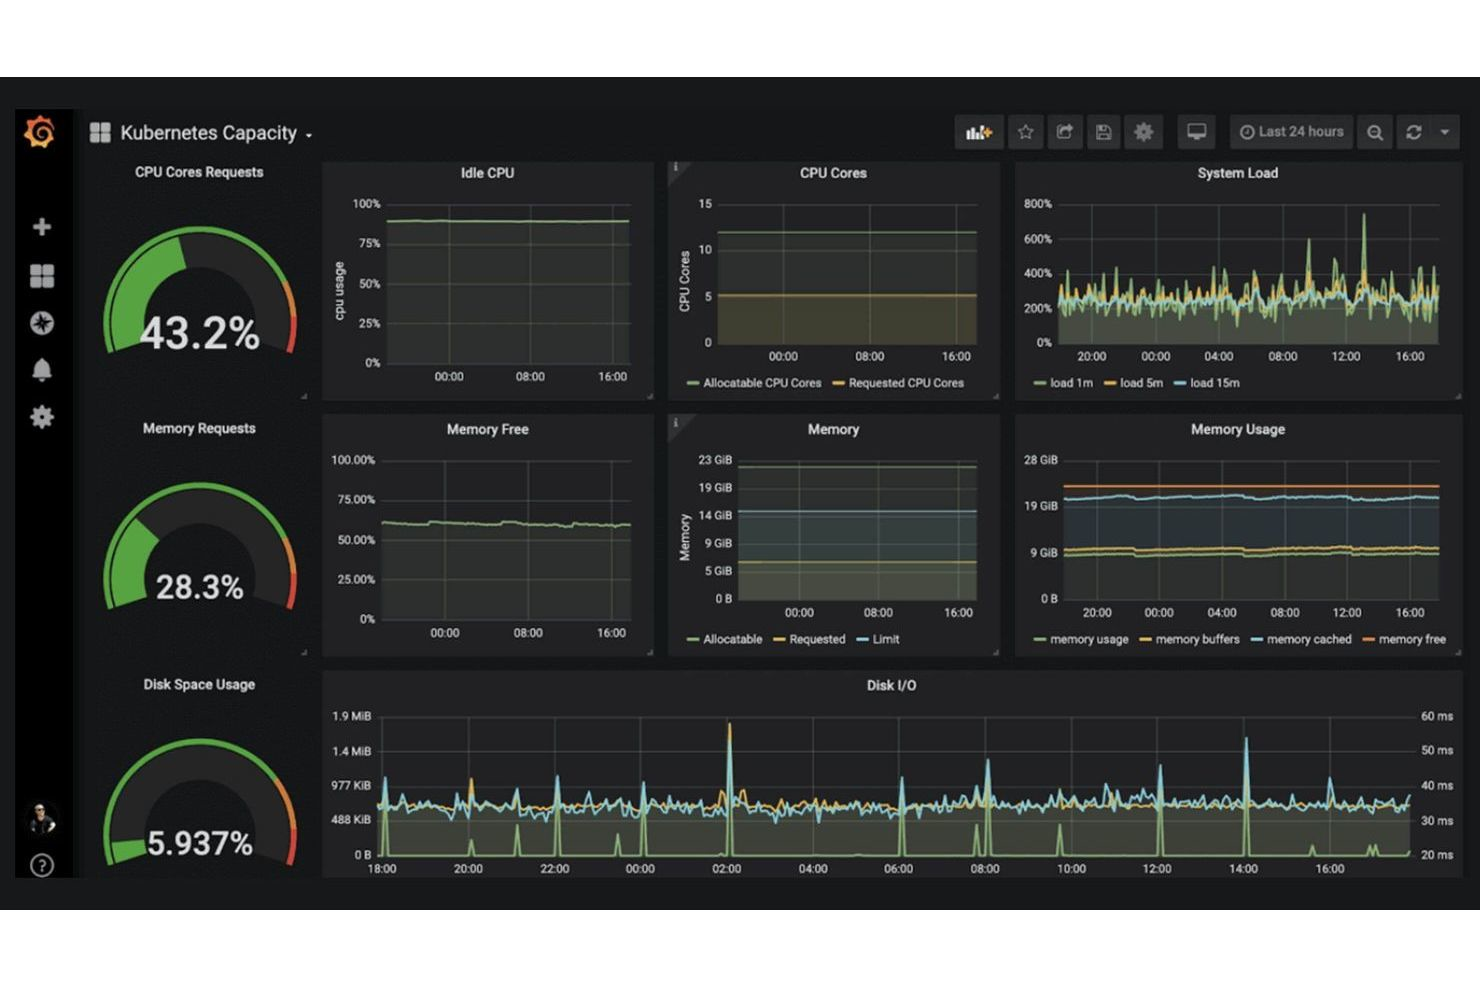
Grafana Cloud si distingue per i team che necessitano di visualizzazioni avanzate e personalizzabili dei dashboard attraverso molteplici fonti di dati. È particolarmente adatto a specialisti IT, ingegneri DevOps e analisti che desiderano unificare metriche, log e tracce in un unico punto. A differenza di Netdata, Grafana Cloud consente di creare dashboard altamente personalizzabili che attingono da una vasta gamma di strumenti di monitoraggio e osservabilità.
Perché Grafana Cloud è una buona alternativa a Netdata
Se hai bisogno di visualizzazioni di dashboard avanzate che vadano oltre quanto offerto da Netdata, Grafana Cloud è una scelta solida. Ho selezionato Grafana Cloud perché consente di creare dashboard altamente personalizzabili che combinano dati da molteplici fonti, comprese metriche, log e tracce. Il suo editor di pannelli supporta un'ampia varietà di tipi di visualizzazione, da grafici a serie temporali a heatmap e geomap. Questa flessibilità aiuta i team IT e gli ingegneri a costruire viste di monitoraggio che rispecchiano le esigenze specifiche della propria infrastruttura e delle applicazioni.
Funzionalità principali di Grafana Cloud
Altre funzionalità di Grafana Cloud aiutano i team a estendere le capacità di monitoraggio e visualizzazione:
- Motore di alerting: Supporta notifiche multicanale e regole di avviso personalizzate.
- Controlli di accesso utente: Permette di gestire permessi e ruoli per diversi membri del team.
- Marketplace dei plugin: Offre un'ampia scelta di plugin per fonti dati e visualizzazioni.
- Condivisione di snapshot: Permette di condividere lo stato dei dashboard con altri per collaborare o risolvere problemi.
Integrazioni di Grafana Cloud
Le integrazioni includono Prometheus, Loki, Tempo, Mimir, Graphite, InfluxDB, Elasticsearch, MySQL, AWS CloudWatch, Zabbix e altro ancora.
Pros and Cons
Pros:
- Fornisce un ampio marketplace di plugin per le estensioni
- Permette la condivisione dei dashboard tramite link snapshot
- Si integra nativamente con i principali strumenti di monitoraggio cloud
Cons:
- Nessun monitoraggio integrato a livello di processi o di sistema
- Conservazione limitata dei dati storici senza piani a pagamento
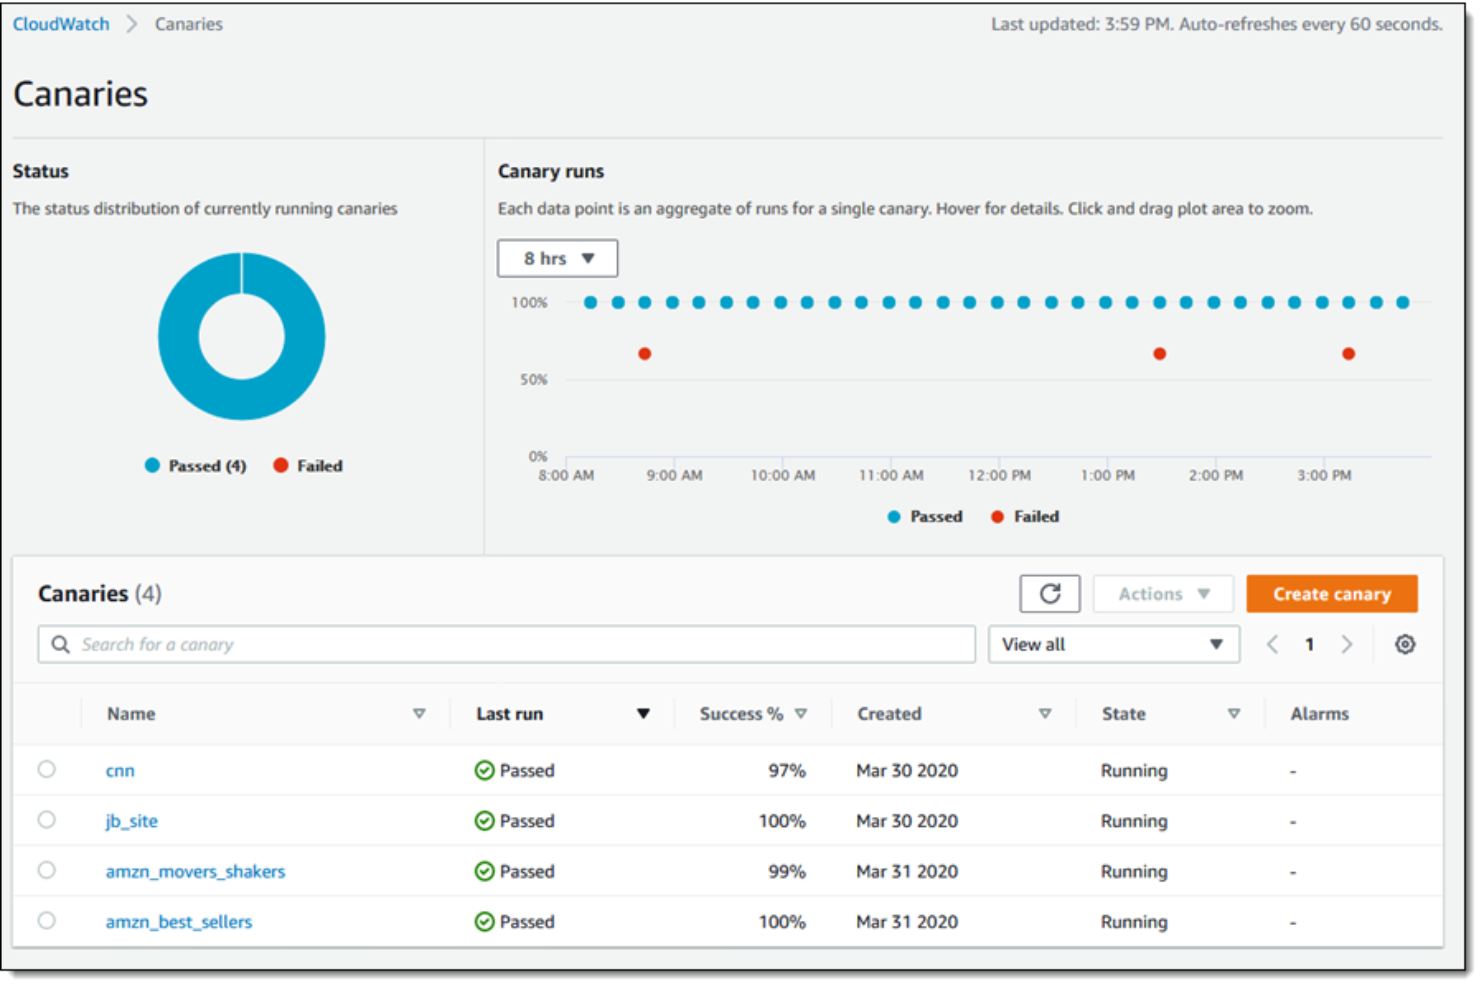
AWS CloudWatch è stato progettato appositamente per i team che gestiscono carichi di lavoro su AWS e necessitano di una visibilità approfondita e nativa sulle proprie risorse cloud. È particolarmente utile per specialisti IT e ingegneri cloud che desiderano monitorare, registrare e automatizzare le risposte tra EC2, Lambda, RDS e altri servizi AWS. A differenza di Netdata, CloudWatch offre un'integrazione diretta con l'infrastruttura AWS, semplificando il monitoraggio dello stato e delle prestazioni delle risorse senza configurazioni aggiuntive.
Perché AWS CloudWatch è una buona alternativa a Netdata
Per i team che gestiscono l'infrastruttura AWS, CloudWatch offre un monitoraggio nativo profondamente integrato con i servizi AWS. Ho scelto CloudWatch perché raccoglie automaticamente metriche e log da EC2, Lambda, RDS e altre risorse AWS senza configurazioni aggiuntive. Il suo cruscotto unificato consente di visualizzare lo stato delle risorse, impostare avvisi e automatizzare azioni basate su dati in tempo reale. Questo collegamento diretto ai servizi AWS rende CloudWatch una valida alternativa a Netdata per gli ambienti focalizzati sul cloud.
Funzionalità principali di AWS CloudWatch
Altre funzionalità di AWS CloudWatch aiutano i team a gestire e analizzare più a fondo i propri ambienti AWS:
- Metriche personalizzate: ti consente di pubblicare e monitorare le metriche delle tue applicazioni o attività direttamente insieme ai dati delle risorse AWS.
- Log Insights: fornisce un motore di query per cercare e analizzare i dati di log in tempo reale.
- Rilevamento delle anomalie: utilizza l'apprendimento automatico per rilevare automaticamente schemi anomali nelle metriche.
- Condivisione delle dashboard: ti permette di condividere dashboard interattive con altri utenti o team AWS.
Integrazioni AWS CloudWatch
Le integrazioni includono Amazon EC2, Amazon RDS, AWS Lambda, Amazon S3, Amazon ECS, Amazon EKS, Amazon DynamoDB, Amazon SNS, Amazon SQS, Amazon Kinesis e altro ancora.
Pros and Cons
Pros:
- Integrazione nativa con tutti i servizi AWS
- Raccolta automatica di metriche e log per le risorse AWS
- Supporta il rilevamento delle anomalie tramite apprendimento automatico
Cons:
- Visibilità limitata sulle infrastrutture non AWS
- Le metriche personalizzate possono aumentare i costi mensili

I team IT che gestiscono infrastrutture sia on-premises che cloud troveranno SolarWinds Observability SaaS progettato per la visibilità in ambienti ibridi. La piattaforma è ideale per le organizzazioni che necessitano di un monitoraggio unificato su server, container e servizi cloud senza dover gestire più strumenti. A differenza di Netdata, AppOptics offre monitoraggio integrato di infrastruttura e applicazioni con supporto per il tracing distribuito in ambienti misti.
Perché SolarWinds Observability SaaS è una valida alternativa a Netdata
Per le organizzazioni che utilizzano sia sistemi cloud che on-premises, SolarWinds Observability SaaS si distingue per il supporto agli ambienti ibridi. Lo strumento offre un monitoraggio unificato per server, container e servizi cloud-native, qualcosa che Netdata non gestisce nativamente su ambienti misti. Apprezzo il fatto che AppOptics includa tracing distribuito e monitoraggio infrastrutturale in un'unica piattaforma, rendendo più semplice tracciare le prestazioni dell'intero stack. Questo approccio aiuta i team IT a mantenere visibilità e a risolvere i problemi indipendentemente da dove vengono eseguiti i carichi di lavoro.
Caratteristiche principali di SolarWinds Observability SaaS
Altre funzionalità di AppOptics aiutano i team a ottenere di più dal loro monitoraggio:
- Supporto metriche personalizzate: Raccoglie e visualizza metriche applicative e di business personalizzate insieme alla telemetria standard.
- Libreria di integrazioni predefinite: Offre un'ampia gamma di integrazioni pronte all'uso per database popolari, web server e sistemi di messaggistica.
- Profilazione del codice live: Fornisce analisi in tempo reale a livello di codice per individuare colli di bottiglia nelle prestazioni in produzione.
- Regole di avviso e notifica: Permette agli utenti di configurare policy di avviso flessibili e inviare le notifiche via email, Slack o altri canali.
Integrazioni di SolarWinds Observability SaaS
Le integrazioni includono AWS, Azure, Cisco, Slack, Java, MySQL, MongoDB, PostgreSQL, Amazon Aurora, Redis e altro ancora.
Pros and Cons
Pros:
- Offre profilazione del codice in tempo reale per le applicazioni
- Include integrazioni predefinite per i principali database
- Offre dashboard e visualizzazioni personalizzabili
Cons:
- Nessuna opzione di distribuzione solo on-premises
- Manca di funzionalità integrate di gestione dei log
Sentry
Ideale per il monitoraggio degli errori nelle distribuzioni di codice
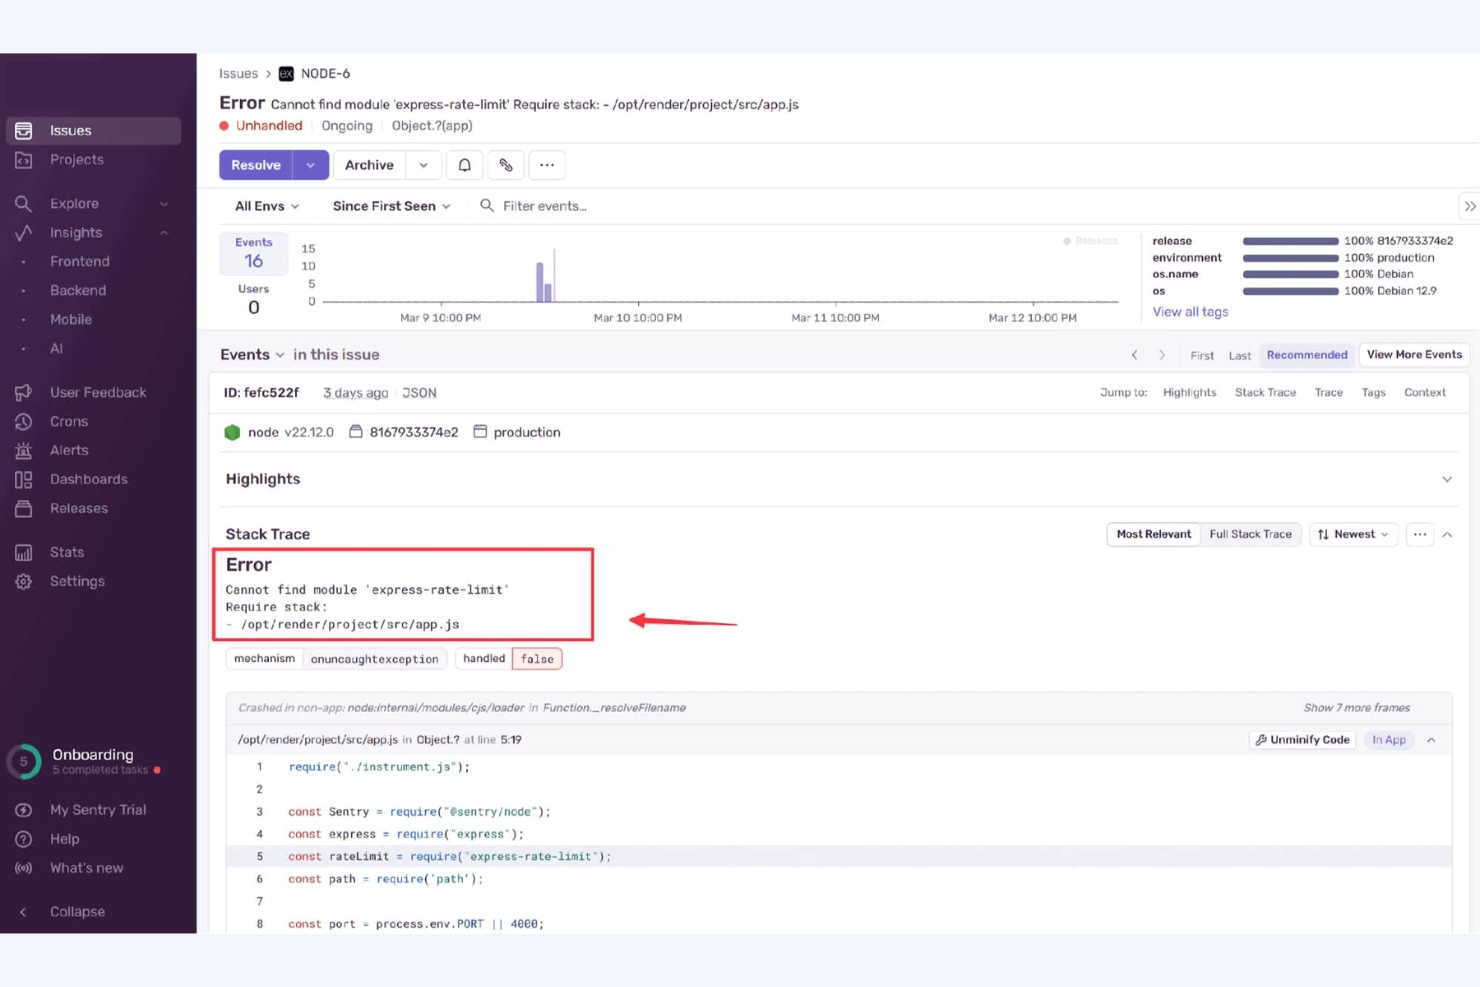
Sviluppatori e team di ingegneria che cercano una profonda visibilità sugli errori nelle loro distribuzioni di codice spesso si affidano a Sentry. La piattaforma è specializzata nel monitoraggio in tempo reale degli errori e delle prestazioni delle applicazioni su più linguaggi e framework. A differenza di Netdata, Sentry individua problemi a livello di codice e regressioni nelle release, aiutando i team a risolvere bug prima che impattino gli utenti.
Perché Sentry è una valida alternativa a Netdata
Se la tua principale preoccupazione è individuare e risolvere errori nelle distribuzioni di codice, Sentry offre una soluzione mirata che Netdata non affronta. Sentry traccia le eccezioni e i problemi di prestazioni a livello di codice, fornendo dettagliate stack trace e monitoraggio delle release per individuare la causa principale dei malfunzionamenti. Personalmente apprezzo come Sentry evidenzi i nuovi errori introdotti nelle release recenti, permettendoti di identificare rapidamente le regressioni. Questo lo rende una scelta solida per i team che devono monitorare la salute delle applicazioni dalla prospettiva degli sviluppatori.
Funzionalità principali di Sentry
Altre funzionalità di Sentry aiutano i team a ottenere di più dai loro flussi di lavoro di monitoraggio:
- Monitoraggio delle prestazioni: Monitora i tempi delle transazioni e la latenza delle applicazioni per aiutare a identificare eventuali rallentamenti.
- Analisi dell'impatto sugli utenti: Mostra quali utenti sono interessati da specifici errori o problemi di prestazioni.
- Monitoraggio della salute delle release: Tiene traccia dell'adozione, delle sessioni senza crash e della stabilità per ogni release.
- Integrazioni con terze parti: Si collega con strumenti come GitHub, Jira e Slack per una gestione delle segnalazioni più snella.
Integrazioni Sentry
Le integrazioni includono GitHub, Slack, Jira, GitLab, Azure DevOps, Vercel, Bitbucket, PagerDuty, Microsoft Teams, Datadog e altri.
Pros and Cons
Pros:
- Traccia gli errori fino ai singoli commit di codice
- Offre avvisi in tempo reale per i nuovi problemi
- Fornisce metriche sulla salute delle release per le distribuzioni
Cons:
- La conservazione dei dati degli eventi dipende dal piano scelto
- Richiede l'integrazione dell'SDK per ogni applicazione
New Product Updates from Sentry

Sentry Adds Heatmaps to Application Metrics
Sentry introduced heatmaps for Application Metrics to visualize metric value distributions over time, helping teams spot patterns like latency bursts and use heatmaps in Custom Dashboards. For more information, visit Sentry's official site.
 .
.Altre alternative a Netdata
Ecco alcune altre alternative a Netdata che non sono rientrate nella mia shortlist, ma che vale comunque la pena prendere in considerazione:
- Dynatrace
Ideale per il rilevamento di anomalie basato su IA
- ManageEngine Applications Manager
Ideale per flussi di lavoro di allerta personalizzabili
- Riverbed
Ideale per approfondimenti sulle prestazioni di rete


Criteri di selezione delle alternative a Netdata
Per selezionare le migliori alternative a Netdata da includere in questo elenco, ho considerato le esigenze e le principali difficoltà riscontrate da chi acquista strumenti di monitoraggio applicativo, come il monitoraggio di ambienti cloud distribuiti e la riduzione degli allarmi inutili. Per mantenere la valutazione strutturata ed equa, ho seguito il framework seguente:
Funzionalità principali (25% del punteggio totale)
Per essere inserita in questo elenco, ogni soluzione doveva soddisfare questi casi d’uso comuni:
- Monitorare lo stato di salute di applicazioni e infrastrutture
- Raccogliere e visualizzare metriche in tempo reale
- Generare e gestire allarmi
- Archiviare e ricercare dati di log
- Supportare integrazioni con piattaforme popolari
Funzionalità aggiuntive distintive (25% del punteggio totale)
Per restringere ulteriormente la selezione, ho valutato anche funzionalità uniche come:
- Analisi automatizzata delle cause dei problemi
- Rilevamento delle anomalie basato su AI
- Funzionalità di tracing distribuito
- Creazione di metriche e dashboard personalizzati
- Workflow integrati per la gestione degli incidenti
Usabilità (10% del punteggio totale)
Per valutare il livello di usabilità di ogni sistema, ho considerato i seguenti aspetti:
- Dashboard semplice e intuitivo per la navigazione
- Opzioni di visualizzazione dati chiare
- Processo logico di configurazione degli avvisi
- Interfaccia reattiva e accessibile
- Passaggi di configurazione minimi per le funzionalità principali
Onboarding (10% del punteggio totale)
Per valutare l’esperienza di onboarding di ciascuna piattaforma, ho considerato i seguenti aspetti:
- Disponibilità di guide di configurazione passo-passo
- Accesso a video formativi e documentazione
- Tour o walkthrough del prodotto interattivi
- Template predefiniti per i casi d’uso più comuni
- Supporto alla migrazione dei dati da altri strumenti
Assistenza clienti (10% del punteggio totale)
Per valutare i servizi di assistenza clienti di ciascun fornitore software, ho considerato quanto segue:
- Molteplici canali di supporto tra cui chat ed email
- Tempi di risposta rapidi per problemi tecnici
- Accesso a una knowledge base o centro assistenza
- Disponibilità di forum o gruppi di utenti della community
- Opzione per la gestione dedicata dell’account
Rapporto qualità-prezzo (10% del punteggio totale)
Per valutare il rapporto qualità-prezzo di ciascuna piattaforma, ho preso in considerazione i seguenti aspetti:
- Struttura dei prezzi trasparente e prevedibile
- Piani flessibili per diversi team
- Funzionalità incluse nei piani base
- Costo dello scaling con dati o utenti aggiuntivi
- Disponibilità di prova gratuita o piano gratuito
Recensioni dei clienti (10% del punteggio totale)
Per avere un’idea della soddisfazione generale dei clienti, ho preso in esame i seguenti punti leggendo le recensioni:
- Coerenza dei feedback positivi tra le piattaforme
- Segnalazioni di affidabilità e uptime
- Feedback su supporto e onboarding
- Commenti degli utenti sull’utilità delle funzionalità
- Frequenza degli aggiornamenti e dei miglioramenti
Perché Cercare un’Alternativa a Netdata?
Anche se Netdata è una buona scelta come strumento di monitoraggio applicativo, ci sono diversi motivi per cui alcuni utenti cercano soluzioni alternative. Potresti essere alla ricerca di un’alternativa a Netdata perché…
- Hai bisogno di una maggiore integrazione con AWS o altre piattaforme cloud
- Desideri il supporto nativo per il tracing distribuito
- Richiedi il rilevamento avanzato delle anomalie tramite l’IA
- Necessiti di monitoraggio centralizzato su ambienti ibridi o multi-cloud
- Vuoi una conservazione dei log più lunga senza configurazioni aggiuntive
- Hai bisogno di funzionalità aziendali per controllo degli accessi e conformità
Se ti riconosci in questi casi, sei nel posto giusto. Il mio elenco contiene diverse opzioni di strumenti di monitoraggio delle applicazioni, più adatte ai team che affrontano queste sfide con Netdata e cercano soluzioni alternative.
Funzionalità Principali di Netdata
Ecco alcune delle funzionalità principali di Netdata, per aiutarti a confrontare cosa offrono le soluzioni alternative:
- Monitoraggio in tempo reale di metriche di sistema e applicazione
- Dashboard interattivi con visualizzazioni personalizzabili
- Rilevamento automatico di centinaia di metriche e servizi
- Agente leggero per un consumo minimo di risorse
- Monitoraggio della salute con allarmi preconfigurati
- Streaming e archiviazione a lungo termine delle metriche
- Raccolta di dati distribuita da più nodi
- Accesso API per integrazioni personalizzate
- Granularità al secondo per dati ad alta risoluzione
- Architettura open source con supporto attivo della community