Die 10 besten Website-Überwachungstools 2026

Kurzliste der besten Website-Überwachungstools


In der schnelllebigen Technikwelt ist es entscheidend, dass Ihre Website zuverlässig läuft. Ausfallzeiten kosten nicht nur Geld, sondern auch Ihren guten Ruf. Als Technikexperte kennen Sie den Frust bei unerwarteten Ausfällen oder langsamen Ladezeiten. Genau hier kommen Website-Überwachungstools ins Spiel.
Mit diesen Tools behalten Sie die Leistung Ihrer Website im Blick und stellen sicher, dass alles reibungslos funktioniert. Nach meiner Erfahrung kann das richtige Tool Ihrem Team Zeit und Nerven sparen.
In diesem Artikel stelle ich meine Top-Auswahl an Website-Überwachungstools vor. Sie erhalten eine unabhängige, fundierte Bewertung, damit Sie das passende Tool für Ihre Anforderungen finden. Lassen Sie uns gemeinsam dafür sorgen, dass Ihre Website in Bestform bleibt.
Warum Sie unseren Software-Bewertungen vertrauen können
Wir testen und bewerten seit 2023 Software. Als Technologie-Führungskräfte wissen wir, wie kritisch und herausfordernd es ist, die richtige Entscheidung bei der Softwareauswahl zu treffen.
Wir investieren viel in gründliche Recherche, um unserer Zielgruppe zu helfen, bessere Kaufentscheidungen zu treffen. Wir haben über 2.000 Tools für verschiedene Technikanwendungsfälle getestet und mehr als 1.000 umfassende Softwarebewertungen geschrieben. Erfahren Sie wie wir transparent bleiben und unsere Methodik der Softwarebewertung.
Zusammenfassung der besten Website-Überwachungstools
Diese Vergleichstabelle fasst die Preisinformationen meiner am besten bewerteten Website-Überwachungstools zusammen, damit Sie das passende für Ihr Budget und Ihre Geschäftsanforderungen finden.
| Tool | Best For | Trial Info | Price | ||
|---|---|---|---|---|---|
| 1 | Am besten für KI-gesteuerte Analysen | Kostenlose Demo + 15-tägige kostenlose Testversion verfügbar | Ab $25/Nutzer/Monat (jährliche Abrechnung) | Website | |
| 2 | Am besten für die Überwachung von Website-Fehlern in Echtzeit | Kostenloser Tarif + kostenlose Demo verfügbar | Ab $26/Monat (jährliche Abrechnung) | Website | |
| 3 | Am besten geeignet für Echtzeit-Überwachungsdashboards | 14-tägige kostenlose Testversion + kostenloser Tarif verfügbar | Ab $15/Nutzer/Monat (jährliche Abrechnung) | Website | |
| 4 | Am besten geeignet für die kombinierte Überwachung von Anwendungen und Websites | 30-tägige kostenlose Testphase + kostenlose Demo + kostenloser Plan verfügbar | Ab $945 für 25 Monitore (jährliche Abrechnung) | Website | |
| 5 | Am besten für weltweite Abdeckung mit 110+ Standorten | Kostenlose Demo + 30 Tage kostenloser Testzugang verfügbar | Ab $9/Nutzer/Monat (jährliche Abrechnung) | Website | |
| 6 | Am besten für SSL-Monitoring | Kostenloser Tarif + kostenlose Demo verfügbar | Ab $8/10 Monitore/Monat (jährlich abgerechnet) | Website | |
| 7 | Am besten geeignet für die Überwachung hybrider Infrastrukturen | Kostenlose 15-tägige Testversion | Preise auf Anfrage | Website | |
| 8 | Am besten geeignet für Echtzeitdaten zur Nutzerinteraktion | Kostenlose Testversion + kostenlose Demo verfügbar | Preis auf Anfrage | Website | |
| 9 | Am besten für reale Einblicke in das Nutzererlebnis | 14-tägige kostenlose Testversion + kostenlose Demo verfügbar | Ab $8/Nutzer/Monat (jährliche Abrechnung) | Website | |
| 10 | Am besten für die Überwachung von Webanwendungen | 30-tägige kostenlose Testversion + kostenlose Demo verfügbar | Ab $15/Nutzer/Monat (jährliche Abrechnung) | Website |
-

TestDevLab
Visit Website -
Site24x7
Visit WebsiteThis is an aggregated rating for this tool including ratings from Crozdesk users and ratings from other sites.4.7 -
GitHub Actions
Visit WebsiteThis is an aggregated rating for this tool including ratings from Crozdesk users and ratings from other sites.4.8


Bewertungen der besten Website-Überwachungstools
Nachfolgend finden Sie meine ausführlichen Zusammenfassungen der besten Website-Überwachungstools, die es auf meine Kurzliste geschafft haben. Meine Bewertungen bieten einen detaillierten Überblick über die wichtigsten Funktionen, Vor- und Nachteile, Integrationen und idealen Anwendungsfälle jedes Tools, damit Sie das beste auswählen können.
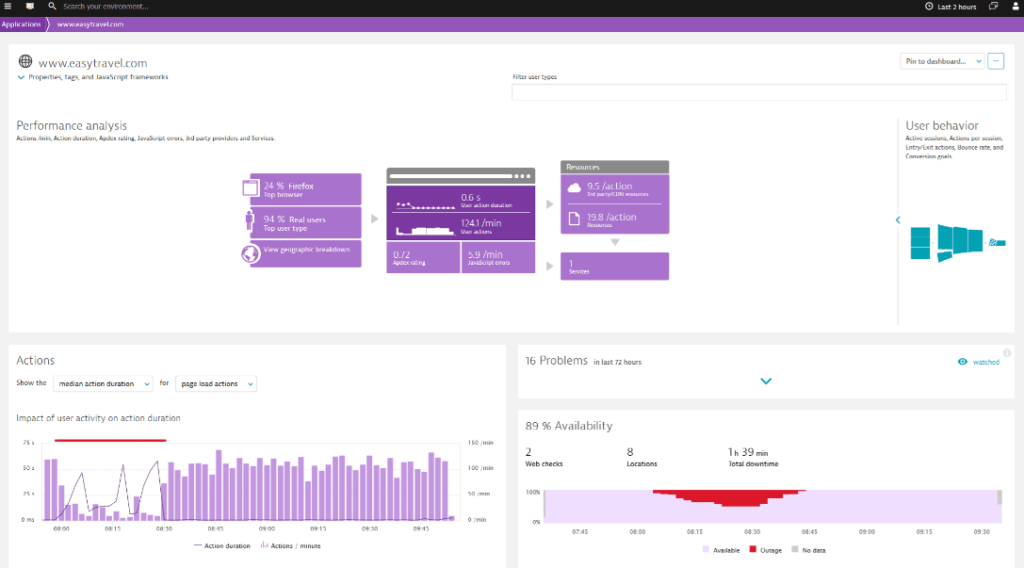
Dynatrace ist eine Software-Intelligenz-Plattform, die Anwendungsleistung, Cloud-Infrastrukturüberwachung und Einblicke in das digitale Erlebnis bietet. Durch den Einsatz von KI liefert sie Echtzeitanalysen zur Sicherstellung optimaler Software- und Infrastrukturgesundheit, was für Organisationen, die auf KI-gesteuerte Erkenntnisse setzen, von entscheidender Bedeutung ist.
Warum ich Dynatrace ausgewählt habe: Im Rahmen meiner Auswahl von Software-Intelligence-Tools hat sich Dynatrace deutlich hervorgehoben. Der besondere Vorteil liegt in den KI-basierten Analysen, die ich als fortschrittlicher als bei vielen anderen Plattformen empfand.
Gemessen an seinen Fähigkeiten ist offensichtlich, dass Dynatrace am besten für Unternehmen geeignet ist, die KI-gesteuerte Analysen benötigen, um ihre Software- und Infrastrukturleistung zu verbessern.
Herausragende Funktionen & Integrationen:
Die KI-Engine von Dynatrace erkennt und analysiert automatisch Abhängigkeiten von Anwendungen und optimiert die Leistung mit minimalem manuellem Aufwand. Das Digital Experience Monitoring der Plattform erfasst Nutzererfahrungen über verschiedene Kanäle hinweg und vermittelt einen umfassenden Überblick über die Performance.
Bei den Integrationen ist Dynatrace mit gängigen Cloud-Anbietern wie AWS, Azure und Google Cloud kompatibel und lässt sich problemlos in CI/CD-Tools wie Jenkins einbinden.
Pros and Cons
Pros:
- Fortschrittliche KI-Analytik zur automatischen Problemerkennung und -behebung
- Umfassende Überwachung von Anwendungen, Cloud und digitalen Kanälen
- Vielseitige Integrationen mit Cloud-Anbietern und CI/CD-Tools
Cons:
- Für neue Nutzer kann eine steile Lernkurve erforderlich sein
- Die Preisgestaltung kann für kleinere Organisationen hoch ausfallen
- Komplexe Konfigurationen können spezielles Fachwissen erfordern
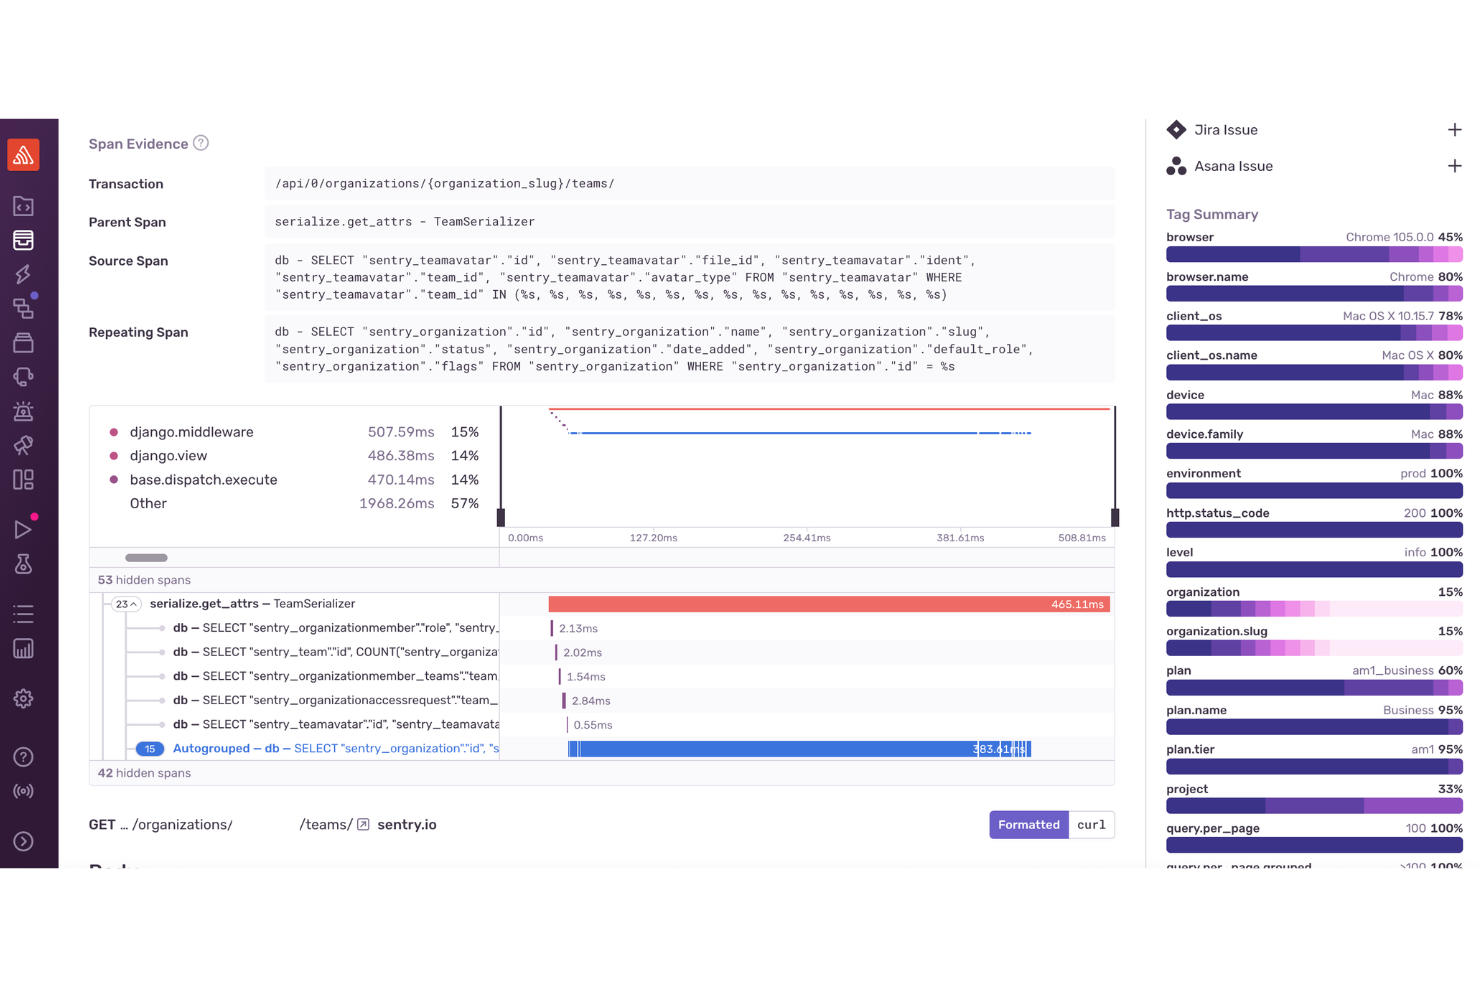
Sentry bietet eine umfassende Lösung für Unternehmen, die ihre Überwachungsfunktionen für Websites verbessern möchten. Entwickelt zur Unterstützung von Entwicklern und Softwareteams, stellt Sentry Werkzeuge bereit, mit denen Sie Fehler klar erkennen und Probleme schneller lösen können. Das macht Sentry zu einer attraktiven Wahl für verschiedene Branchen, darunter Webentwicklung und E-Commerce. Mit Funktionen wie Fehlerverfolgung, Verfügbarkeitsüberwachung und Sitzungsaufzeichnung hilft Sentry dabei, eine optimale Leistung Ihrer Anwendung und Benutzererfahrung zu gewährleisten und typische Herausforderungen wie unerwartete Ausfallzeiten und Performance-Flaschenhälse zu adressieren.
Warum ich Sentry gewählt habe
Ich habe Sentry aufgrund seines besonderen Fokus auf detaillierte Einblicke in Anwendungsleistung und Fehlerverfolgung ausgewählt. Ein herausragendes Merkmal ist das Echtzeit-Fehlermonitoring, das Fehler direkt bei ihrem Auftreten erfasst, sodass Sie Probleme schnell diagnostizieren und beheben können. Ein weiteres zentrales Feature ist die Verfügbarkeitsüberwachung, die sicherstellt, dass Ihre Website stets erreichbar ist, indem sie Sie über Ausfallzeiten informiert. Zusätzlich bietet Sentrys Sitzungsaufzeichnung eine visuelle Darstellung von Nutzerinteraktionen, die Ihnen hilft, Benutzererfahrungsprobleme effizienter zu verstehen und zu beheben.
Sentry Hauptfunktionen
Neben der Echtzeit-Fehlerverfolgung für Websites bietet Sentry:
- Tracing: Liefert Einblicke in API-Aufrufe und Datenbankabfragen, um Performance-Engpässe innerhalb Ihrer Anwendung zu identifizieren.
- Automatische Ursachenanalyse: Nutzt KI, um die zugrundeliegenden Fehlerursachen zu erkennen und den Debugging-Prozess zu beschleunigen.
- KI-gestützte Fehlerbehebung: Bietet automatisierte Codeüberprüfungen und Vorschläge, um die Zeit zur Lösung komplexer Probleme zu verkürzen.
- Integration mit Entwicklungstools: Verbindet sich nahtlos mit Plattformen wie GitHub und Slack und sorgt so für einen reibungslosen Workflow für Ihr Entwicklungsteam.
Sentry Integrationen
Zu den Integrationen gehören GitHub, Slack, Jira, Bitbucket, GitLab, Trello, Azure DevOps, PagerDuty, AWS Lambda und Microsoft Teams.
Pros and Cons
Pros:
- Bietet Echtzeit-Fehlerverfolgung für Web-, Mobil- und Backend-Anwendungen
- Verteiltes Tracing zeigt Leistungsdaten auf Transaktions-Ebene
- Erweitertes Fehlergruppieren hilft, Probleme effizient zu priorisieren und schnell zu beheben
Cons:
- Nicht alle Integrationen sind nativ verfügbar und benötigen teilweise Drittanbieter-APIs
- Begrenzte Benachrichtigungen und Einblicke in Anwendungen in günstigeren Tarifen
New Product Updates from Sentry

Sentry Adds Log Export in CSV and JSONL
Sentry now supports exporting up to 10,000 log lines from Explore → Logs in CSV or JSON Lines, with downloads available in-browser or as background downloads and email. For more information, visit Sentry's official site.
 .
.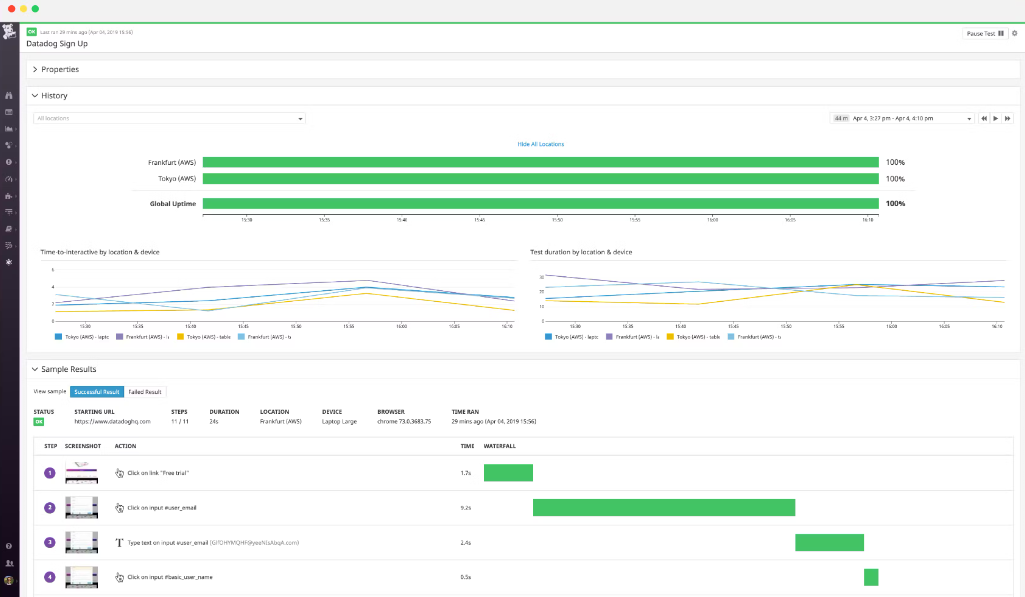
Datadog ist eine cloudbasierte Überwachungs- und Analyseplattform, die Unternehmen dabei unterstützt, die Leistung ihrer Anwendungen, Tools und Dienste in Echtzeit zu visualisieren. Ihre Stärke liegt in der Erstellung umfassender, Echtzeit-Dashboards, die Daten aus verschiedenen Quellen zusammenfassen und dadurch unmittelbare Einblicke und proaktive Reaktionen ermöglichen.
Warum ich Datadog ausgewählt habe: Bei der Auswahl der Tools für diese Liste ragte Datadog aufgrund seiner leistungsstarken Dashboard-Funktionen hervor. Nach dem Vergleich verschiedener Plattformen stellte ich fest, dass Datadogs Fähigkeit, durch dynamische Visualisierungen sofortige Einblicke zu liefern, es besonders macht.
Ich kam zu dem Schluss, dass Datadog besonders für Unternehmen heraussticht, die auf Echtzeit-Überwachungsdashboards angewiesen sind.
Herausragende Funktionen & Integrationen:
Datadog verfügt über ein fortschrittliches System zur Anomalieerkennung, das potenzielle Probleme erkennt, bevor sie zu ernsthaften Störungen werden. Außerdem bietet es verteiltes Tracing, das bei der Identifikation von Leistungsengpässen in Microservice-Architekturen unterstützt.
Bei den Integrationen verbindet sich Datadog mit einer Vielzahl von Plattformen, darunter AWS, Docker, Slack und viele mehr, um Daten für eine umfassende Analyse zu konsolidieren.
Pros and Cons
Pros:
- Umfangreiche Echtzeit-Dashboard-Funktionen
- Bietet fortschrittliche Anomalieerkennung
- Breite Integration mit gängigen Plattformen
Cons:
- Für Einsteiger steilere Lernkurve
- Preise können mit zusätzlichen Funktionen steigen
- Begrenzte Datenaufbewahrung im Basistarif
Am besten geeignet für die kombinierte Überwachung von Anwendungen und Websites
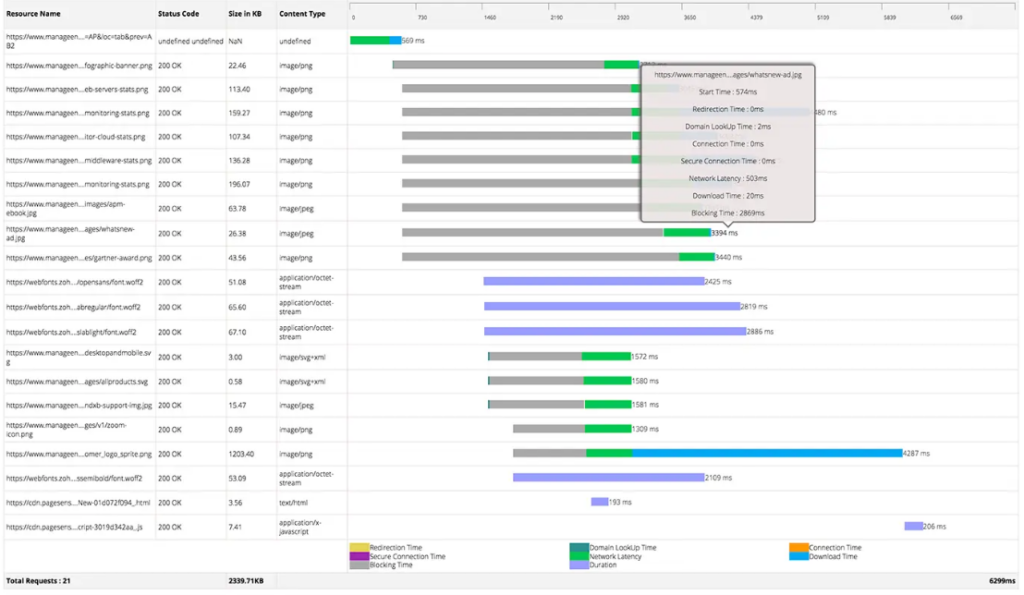
ManageEngine Applications Manager bietet einen integrierten Ansatz zur Überwachung von Anwendungen und Websites. Durch die Sicherstellung einer konsistenten Performance dieser beiden kritischen Komponenten hilft es Unternehmen, optimale Nutzererfahrungen und eine effiziente Betriebsführung aufrechtzuerhalten.
Warum ich den ManageEngine Applications Manager ausgewählt habe: Ich habe ManageEngine Applications Manager wegen seines umfassenden Ansatzes beim Performance-Monitoring ausgewählt. Nach dem Vergleich und der Bewertung mehrerer Tools bin ich zu dem Schluss gekommen, dass die Fähigkeit von ManageEngine, sowohl Anwendungen als auch Websites gleichzeitig zu überwachen, einen deutlichen Vorteil verschafft.
Diese doppelte Überwachungsfähigkeit macht es zur idealen Lösung für Organisationen, die sicherstellen müssen, dass sowohl Web- als auch Anwendungsressourcen harmonisch funktionieren.
Hervorstechende Funktionen & Integrationen:
ManageEngine Applications Manager überzeugt bei der Überwachung verschiedenster Anwendungen von Web-Apps, Datenbanken bis hin zu Big-Data-Speichern. Die Root-Cause-Analyse hilft, Probleme schnell zu identifizieren und Ausfallzeiten zu reduzieren. Außerdem bietet es zentrale Integrationen mit Plattformen wie AWS, Microsoft Azure und Oracle Cloud, was das Monitoring-Spektrum zusätzlich erweitert.
Pros and Cons
Pros:
- Duale Überwachung von Anwendungen und Websites
- Umfassende Unterstützung verschiedener Anwendungstypen
- Nützliches Feature zur Ursachenanalyse
Cons:
- Könnte für kleine Unternehmen zu umfassend sein
- Lizenzierung kann bei Skalierung komplex werden
- Erfordert anfängliche Konfiguration und Einrichtungszeit
New Product Updates from ManageEngine Applications Manager
Oracle Cloud Application Monitoring Now Available in ManageEngine Applications Manager
ManageEngine Applications Manager introduces Oracle Cloud Application Monitoring, Oracle Cloud Function Monitoring, and Oracle Cloud NAT Gateway Monitoring. These new capabilities help teams monitor Oracle Cloud applications, serverless workloads, and network resources from a single platform. For more information, visit ManageEngine Applications Manager's official site.
 .
.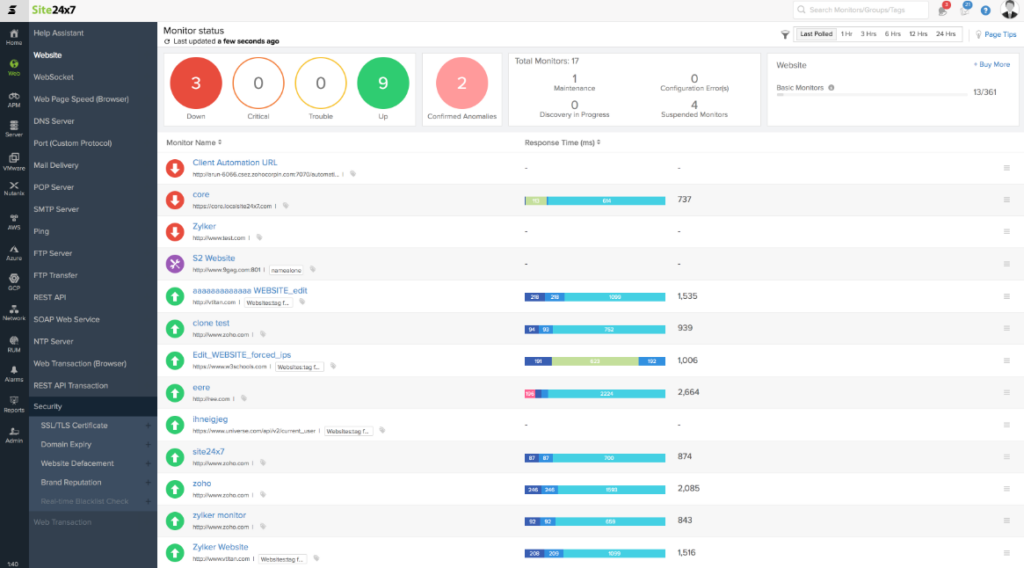
Site24x7 bietet umfassendes Webanwendungs-Monitoring aus der Perspektive eines Nutzers und stellt damit die Leistung von Websites an verschiedenen geografischen Standorten sicher. Das herausragende Merkmal ist die Präsenz an über 110 Standorten weltweit, die es Unternehmen ermöglicht, die Leistung und Verfügbarkeit ihrer Websites praktisch überall auf der Welt zu überwachen.
Warum ich Site24x7 ausgewählt habe: Bei der Auswahl von Tools wurde die umfangreiche globale Präsenz von Site24x7 als einzigartiges Verkaufsargument deutlich. Nach der Bewertung und dem Vergleich verschiedener Monitoring-Lösungen war ich der Meinung, dass die weite Reichweite von Site24x7 einen unvergleichlichen Vorteil bietet, insbesondere für Unternehmen mit internationaler Ausrichtung. Für Firmen, die Wert auf globale Abdeckung legen, ist Site24x7 eindeutig die optimale Lösung.
Hervorstechende Funktionen & Integrationen:
Site24x7 überwacht nicht nur Websites, sondern auch Anwendungen, Server sowie Netzwerk-Infrastrukturen und bietet so Rundum-Einblicke in die Performance. Real User Monitoring (RUM) und Application Performance Monitoring (APM) gehören zu den wichtigsten Funktionen und ermöglichen Einblicke in die Erfahrungen echter Nutzer sowie in die Backend-Leistung der Anwendung.
In puncto Integration ist Site24x7 kompatibel mit etablierten Plattformen wie AWS, Microsoft Azure und Google Cloud und bietet so eine umfassende Übersicht über die Performance von Cloud-Ressourcen.
Pros and Cons
Pros:
- Weltweites Monitoring-Netzwerk mit über 110 Standorten
- Umfassende Tool-Suite einschließlich RUM und APM
- Umfangreiche Integrationen mit Cloud-Plattformen
Cons:
- Benutzeroberfläche kann für Einsteiger komplex sein
- Begrenzung der Monitoranzahl im Basistarif
- Zusatzfunktionen können zusätzliche Kosten verursachen
New Product Updates from Site24x7
Site24x7 Adds Synchronization Statuses for MSPs
Site24x7 now provides MSPs enhanced alerts and synchronization statuses in a centralized notification center to spot configuration sync issues sooner and accelerate incident response. For more information, visit Site24x7's official site.

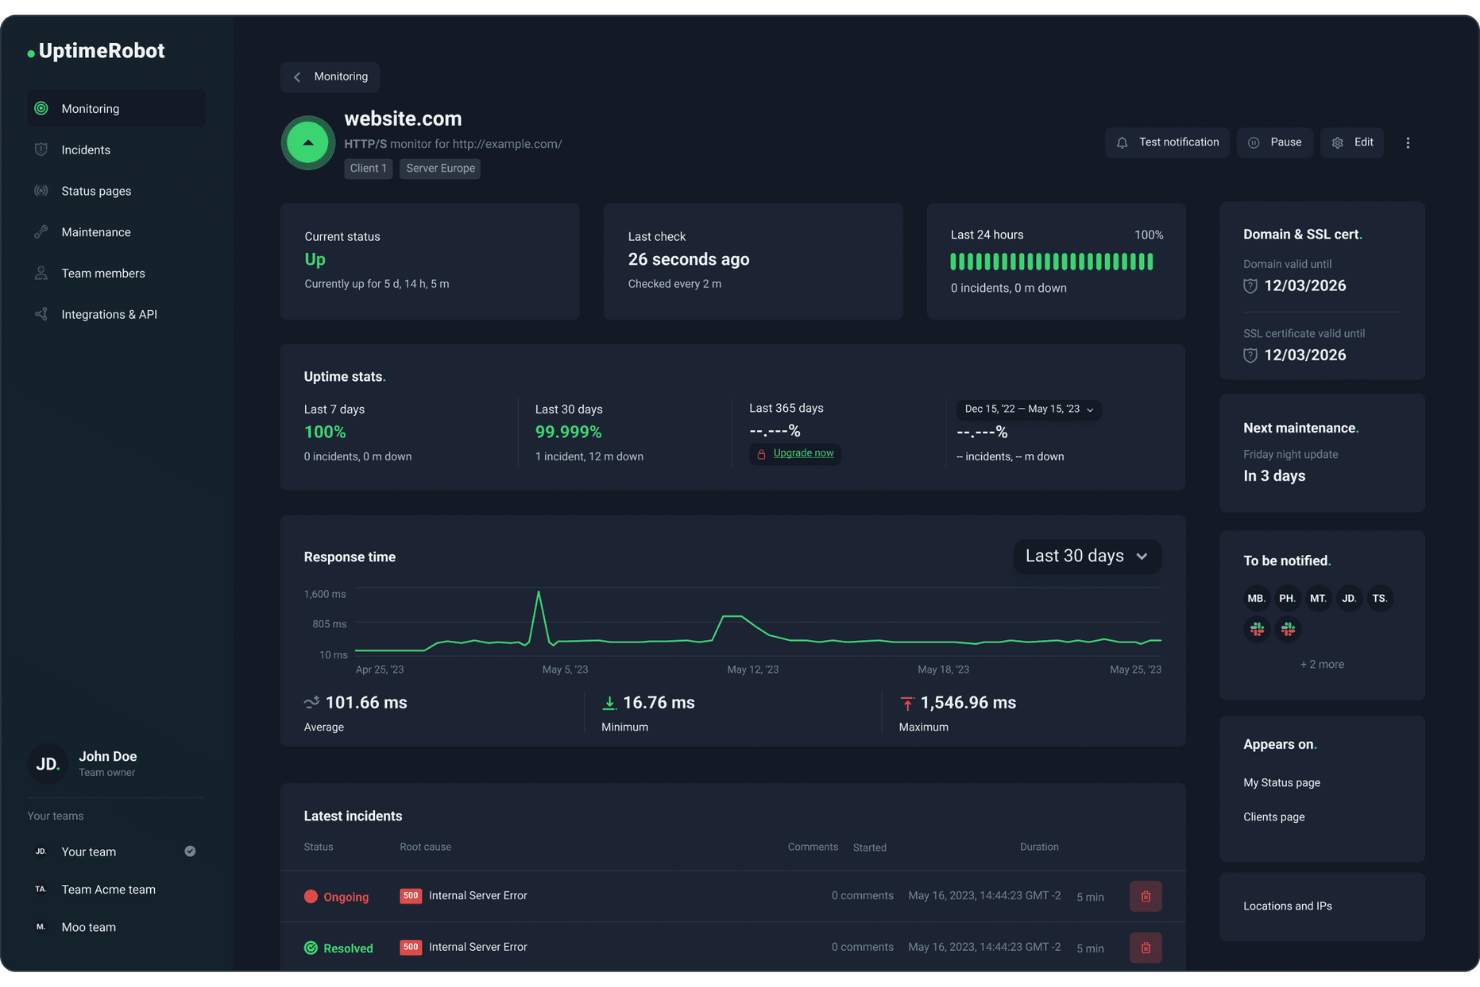
Für Teams, die ein zuverlässiges Website-Monitoring-Tool suchen, bietet UptimeRobot eine praktische Lösung, die neben der Überwachung der Verfügbarkeit auch das SSL-Monitoring unterstützt. Es eignet sich besonders für Teams wie Entwickler, DevOps und Marketer, die eine konstante Übersicht über die Erreichbarkeit und den Sicherheitsstatus ihrer Website benötigen. Durch das Erkennen von Problemen wie Zertifikatsabläufen, Ausfallzeiten und langsamen Reaktionszeiten trägt UptimeRobot zu einer stabilen, verlässlichen Online-Präsenz bei.
Warum ich UptimeRobot gewählt habe
Ich habe UptimeRobot wegen seines SSL-Monitorings ausgewählt, das Teams ermöglicht, Zertifikatsprobleme frühzeitig zu erkennen, bevor sie den Zugriff auf die Website beeinträchtigen. Es benachrichtigt Sie, wenn Zertifikate kurz vor dem Ablauf stehen, wodurch das Risiko unerwarteter Sicherheitswarnungen oder Ausfallzeiten sinkt. UptimeRobot unterstützt zudem Multi-Location-Prüfungen und Echtzeit-Benachrichtigungen über Kanäle wie E-Mail und Slack, sodass Verfügbarkeits- oder Leistungsprobleme in verschiedenen Regionen schnell erkannt und behoben werden können.
UptimeRobot Hauptfunktionen
Neben dem SSL-Monitoring bietet UptimeRobot:
- Cron-Job-Überwachung: Mit dieser Funktion können Sie geplante Aufgaben verfolgen und sicherstellen, dass sie zur richtigen Zeit ausgeführt werden.
- Individuell anpassbare Statusseiten: Sie können Statusseiten erstellen und teilen, die Ihr Branding widerspiegeln und Stakeholder bei Ausfällen informieren.
- Überwachung an mehreren Standorten: Diese Funktion hilft, standortspezifische Probleme zu erkennen, indem die Website-Performance von verschiedenen globalen Punkten geprüft wird.
- Erweiterte Benachrichtigungseinstellungen: Sie können Benachrichtigungen basierend auf Schweregrad von Ausfällen anpassen und Wartungsfenster einrichten, um unnötige Meldungen zu vermeiden.
UptimeRobot Integrationen
UptimeRobot bietet zahlreiche Integrationen zur Verbesserung Ihres Monitorings, darunter E-Mail, Slack, PagerDuty, Microsoft Teams, Telegram, Discord, Webhooks, Zapier und API-Support für individuelle Integrationen.
Pros and Cons
Pros:
- SSL-Monitoring-Benachrichtigungen, bevor Zertifikate ablaufen
- Echtzeit-Benachrichtigungen per E-Mail, Slack und anderen Kanälen
- Großzügiger kostenloser Tarif für grundlegende Überwachungsanforderungen
Cons:
- Begrenzte Leistungsdiagnostik im Vergleich zu fortgeschrittenen Tools
- Eingeschränkte Prüfintervalle bei niedrigeren Tarifen
Am besten geeignet für die Überwachung hybrider Infrastrukturen
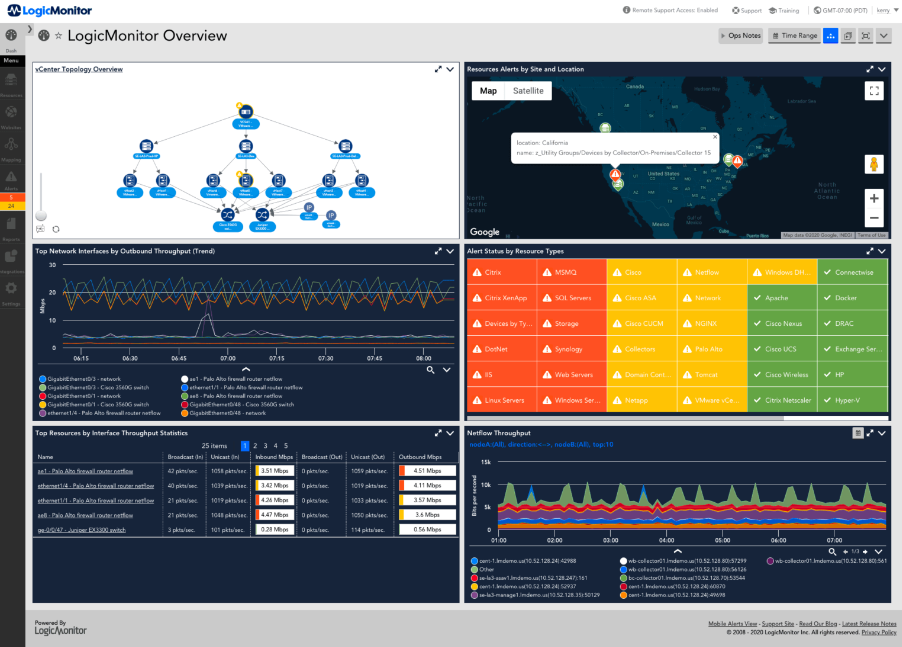
LogicMonitor bietet eine cloudbasierte Plattform zur Automatisierung der Infrastrukturüberwachung. Das System richtet sich sowohl an lokale als auch an Cloud-Umgebungen und trägt dem steigenden Bedarf von Unternehmen Rechnung, eine ganzheitliche Sicht auf ihre gesamte IT-Landschaft zu erhalten.
Warum ich LogicMonitor ausgewählt habe: Bei der Wahl eines Tools zur Infrastrukturüberwachung war LogicMonitor aufgrund seiner umfangreichen Möglichkeiten sowohl für traditionelle als auch moderne IT-Umgebungen eine herausragende Wahl. Im Vergleich zahlreicher Lösungen fand ich besonders beeindruckend, dass LogicMonitor Einblicke sowohl in lokale als auch in Cloud-Infrastrukturen bietet.
Diese grundlegende Fähigkeit macht LogicMonitor besonders geeignet für Unternehmen, die den Umstieg auf die Cloud planen oder eine Balance zwischen Cloud- und On-Premises-Lösungen suchen.
Hervorstechende Funktionen & Integrationen:
LogicMonitor überzeugt durch Funktionen wie die automatisierte Geräteerkennung und dynamische Schwellenwerte, die eine proaktive Problemerkennung ermöglichen. Darüber hinaus verfügt die Plattform über eine Bibliothek mit mehr als 2000 Integrationen, was die Kompatibilität mit einer Vielzahl von Geräten und Anwendungen sicherstellt.
Zu den wertvollsten Integrationen zählen die mit AWS, Azure und VMware, die sowohl Cloud- als auch lokale Landschaften abdecken.
Pros and Cons
Pros:
- Unterstützt die Überwachung verschiedener Infrastrukturtypen
- Automatisierte Geräteerkennung vereinfacht die Einrichtung
- Umfangreiche Bibliothek an Integrationen
Cons:
- Keine öffentlich verfügbaren Festpreise
- Einige fortgeschrittene Funktionen erfordern Einarbeitung
- Die Ersteinrichtung kann bei großen Umgebungen komplex sein
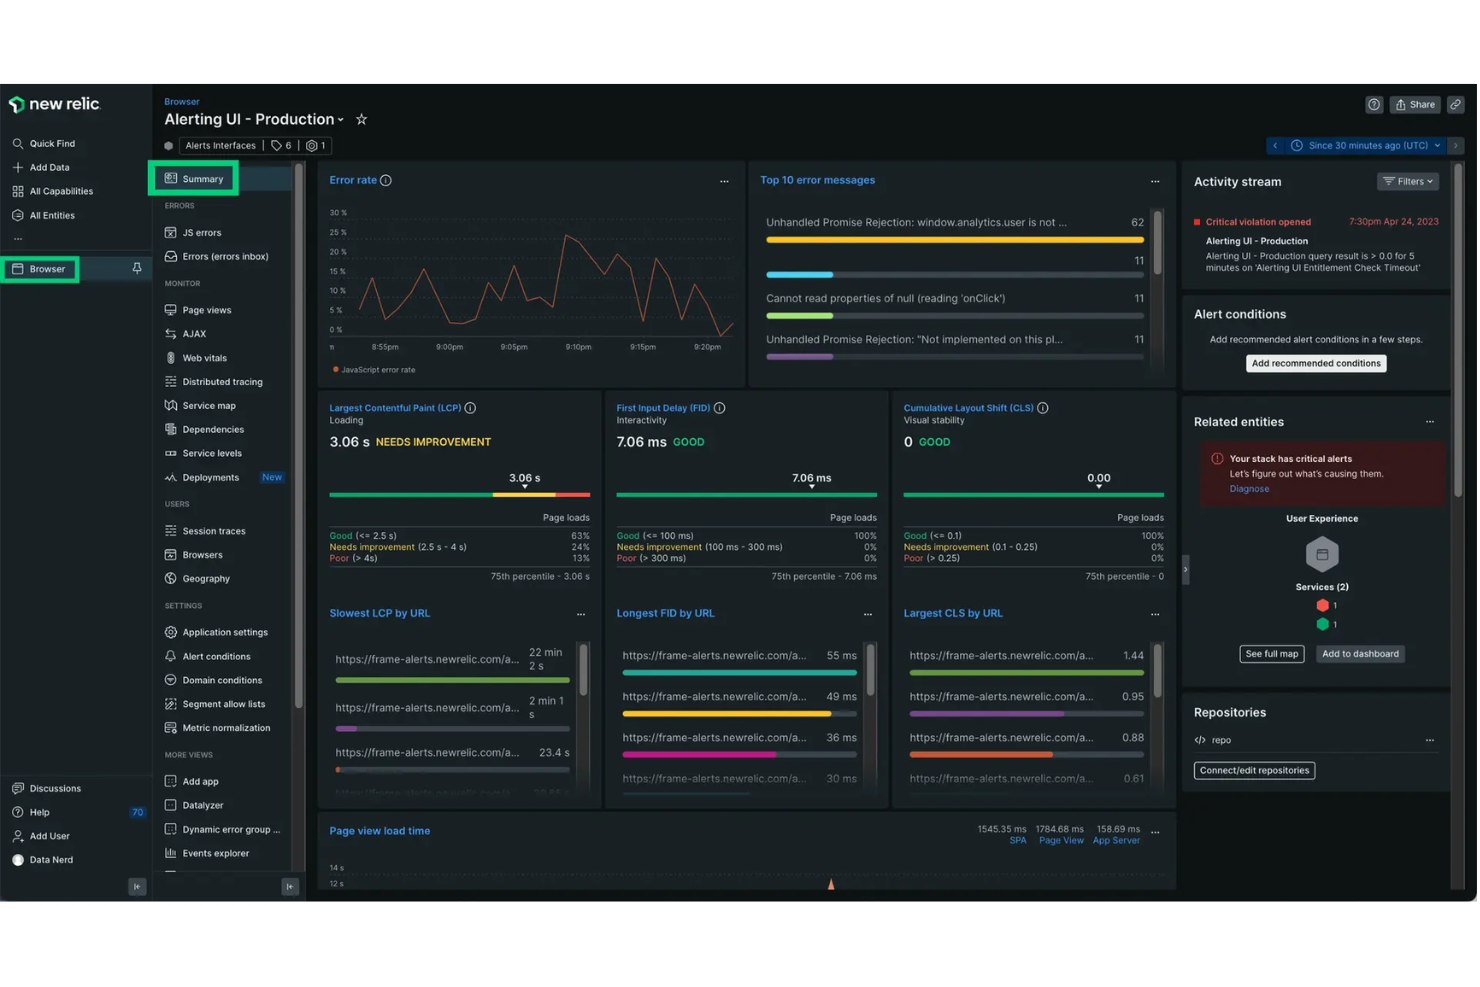
New Relic ist eine umfassende Observability-Plattform, die Ihnen hilft, Ihren gesamten Software-Stack zu überwachen, zu debuggen und zu verbessern. Durch die Bereitstellung von Echtzeiteinblicken in Ihre Anwendungen und Ihre Infrastruktur können Sie Probleme schnell erkennen und beheben, wodurch eine optimale Performance und Kundenzufriedenheit gewährleistet werden.
Warum ich New Relic gewählt habe: Mir gefällt die Digital Experience Monitoring Suite, die sowohl Browser-basiertes Real-User-Monitoring als auch synthetische Tests umfasst. Das Real-User-Monitoring liefert Einblicke in die tatsächlichen Nutzererlebnisse, indem Kennzahlen wie Seitenladezeiten und Sitzungsanalysen erfasst werden. Synthetische Tests ermöglichen es, Nutzerinteraktionen zu simulieren und potenzielle Probleme proaktiv zu identifizieren, bevor sie reale Nutzer betreffen. Zusammen helfen diese Tools dabei, eine hohe Webseiten-Performance und Zuverlässigkeit sicherzustellen.
Hervorstechende Funktionen & Integrationen:
Weitere Funktionen sind Infrastruktur-Monitoring, das Ihnen Einblick in Ihre Server, Container und Cloud-Dienste gibt und dabei hilft, die Systemgesundheit und Performance aufrechtzuerhalten. Das Logmanagement zentralisiert Ihre Protokolldaten, sodass Sie Logs einfacher durchsuchen und analysieren können – zu Troubleshooting- und Audit-Zwecken.
Integrationen sind AWS, Google Cloud Platform, Microsoft Azure, Slack, Atlassian Jira, AWS EventBridge, E-Mail-Benachrichtigungen, Mobile Push-Benachrichtigungen, Opsgenie, PagerDuty, ServiceNow und Prometheus.
Pros and Cons
Pros:
- Lässt sich gut mit verschiedenen Plattformen integrieren
- Verfügt über umfangreiche Alarmierungsfunktionen
- Bietet Echtzeitmonitoring und Einblicke
Cons:
- Dashboards müssen für spezielle Anwendungsfälle eventuell angepasst werden
- Die Benutzeroberfläche kann für neue Nutzer überfordernd sein
Raygun bietet Software-Intelligence- und Performance-Monitoring-Tools, um sicherzustellen, dass Anwendungen mit höchster Leistung laufen. Durch den Fokus auf Erkenntnisse aus tatsächlichen Nutzerinteraktionen verschafft Raygun Entwicklern einen klaren Überblick darüber, wie Benutzer ihre Software erleben.
Warum ich Raygun ausgewählt habe: Bei der Auswahl von Monitoring-Tools für echte Nutzereinblicke fiel mir Raygun besonders auf. Ich kam zu dem Schluss, dass der Fokus auf echte Nutzerinteraktionen Raygun von der Masse abhebt. Aufgrund des einzigartigen Ansatzes, Echtzeiterfahrungen und Rückmeldungen direkt von Anwendern zu erfassen, bin ich der Meinung, dass Raygun am besten für die Gewinnung von Einblicken in die tatsächliche Nutzererfahrung geeignet ist.
Herausragende Funktionen & Integrationen:
Raygun bietet Crash Reporting, sodass Entwickler Fehler diagnostizieren und beheben können, bevor sie bei den Anwendern auftreten. Die Funktion Real User Monitoring liefert Einblicke, wie Nutzer Ihre Software tatsächlich erleben und ermöglicht gezielte Optimierungen auf Basis von realen Nutzungsmustern.
Bei den Integrationen arbeitet Raygun nahtlos mit beliebten Plattformen wie GitHub, Slack und Jira zusammen und erleichtert so die Softwareentwicklung und das Monitoring.
Pros and Cons
Pros:
- Detailliertes Crash Reporting für proaktives Fehlerhandling
- Real User Monitoring liefert echte Einblicke
- Starke Integrationen mit führenden Entwickler-Tools
Cons:
- Könnte für kleinere Teams ohne eigene IT-Experten überfordern
- Die Benutzeroberfläche kann für Erstnutzer komplex sein
- Einige Funktionen könnten für einfachere Anwendungen überflüssig sein
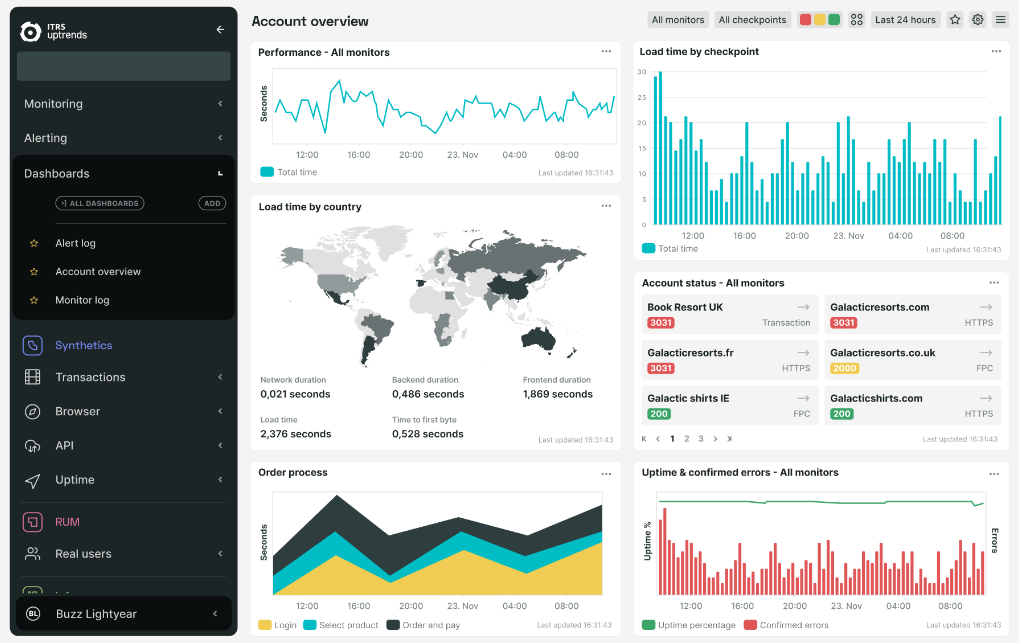
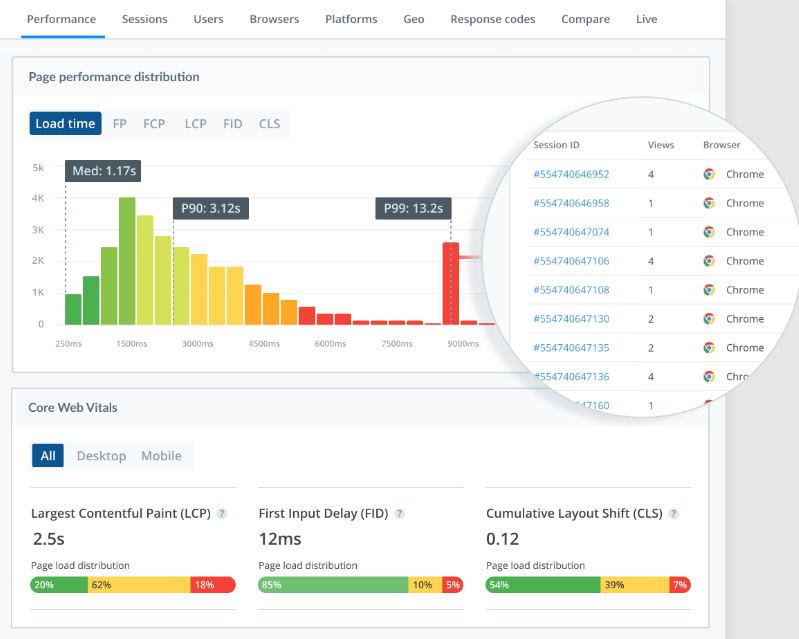
Uptrends ist ein spezialisiertes Tool, das sich auf die Gewährleistung der Zugänglichkeit und Leistung von Webanwendungen konzentriert. Diese Plattform behält die Verfügbarkeit von Webanwendungen genau im Auge und berücksichtigt dabei Geschwindigkeit, Betriebszeit und Funktionalität, was sie zur idealen Wahl für Organisationen macht, die großen Wert auf die Gesundheit ihrer webbasierten Ressourcen legen.
Warum ich Uptrends ausgewählt habe: Als ich entschied, welche Tools ich in diese Liste aufnehmen würde, fiel mir Uptrends durch seine umfassenden Möglichkeiten zur Überwachung von Webanwendungen besonders auf. Im Vergleich zu verschiedenen Plattformen hat Uptrends einen klaren Vorteil, insbesondere durch detaillierte Berichte und Benachrichtigungen zum Status von Webanwendungen. Ich habe festgestellt, dass Uptrends am besten für diejenigen geeignet ist, die ein speziell zur Überwachung von Webanwendungen entwickeltes Tool benötigen.
Herausragende Funktionen & Integrationen:
Uptrends bietet Real User Monitoring und ermöglicht so Einblicke, wie echte Besucher eine Website erleben. Das Tool verfügt außerdem über synthetisches Multi-Browser-Monitoring, das Besucherinteraktionen über verschiedene Browser wie Chrome simuliert.
Bezüglich der Integrationen kann Uptrends mit beliebten Kommunikationstools wie Slack, PagerDuty und Microsoft Teams verbunden werden, um sofortige Benachrichtigungen bei Alarmen zu erhalten.
Pros and Cons
Pros:
- Detaillierte Berichte zur Webanwendungsüberwachung
- Real User Monitoring liefert authentische Einblicke
- Kompatibilität mit mehreren Browsern für synthetisches Monitoring
Cons:
- Die Benutzeroberfläche kann für Einsteiger überwältigend wirken
- Erweiterte Funktionen können zusätzliche Kosten verursachen
- Einige Integrationen erfordern eventuell eine manuelle Konfiguration
Weitere Website-Überwachungstools
Hier sind einige zusätzliche Website-Überwachungstools, die es zwar nicht auf meine Kurzliste geschafft haben, aber dennoch einen Blick wert sind:
- ThousandEyes
Am besten geeignet für umfassende Web-Performance-Überwachung
- Sematext
Am besten geeignet für die Integration von Server- und Website-Metriken
- Uptime
Am besten für detaillierte Berichtsfunktionen
- Apica
Am besten geeignet für skalierbare Performance-Tests
- PRTG
Am besten geeignet für die Überwachung der Website-Verfügbarkeit rund um die Uhr
- Dotcom Monitor
Am besten für Echtzeit-Geschwindigkeitssimulationen geeignet


Weitere Überwachungstool-Reviews
Auswahlkriterien für Website-Überwachungstools
Bei der Auswahl des besten Website-Überwachungstools für diese Liste habe ich auf die typischen Bedürfnisse und Schmerzpunkte von Käufern geachtet, beispielsweise auf die Sicherstellung der Erreichbarkeit und das Erkennen von Leistungsproblemen. Zudem habe ich das folgende Rahmenwerk verwendet, um meine Bewertung strukturiert und fair zu gestalten:
Kernfunktionen (25 % der Gesamtbewertung)
Um in diese Liste aufgenommen zu werden, musste jede Lösung folgende Anwendungsfälle erfüllen:
- Überwachung der Website-Erreichbarkeit
- Überwachung der Seitenladegeschwindigkeit
- Benachrichtigungen bei Ausfallzeiten
- Bereitstellung von Leistungsanalysen
- Unterstützung mehrerer Websites
Zusätzliche besondere Funktionen (25 % der Gesamtbewertung)
Zur weiteren Unterscheidung habe ich auch nach einzigartigen Funktionen gesucht, wie zum Beispiel:
- Echtzeit-Überwachung von Nutzeraktivitäten
- Anpassbare Benachrichtigungseinstellungen
- Leistungsanalysen nach geografischer Region
- Integration mit Drittanbieter-Tools
- Erweiterte Berichtsfunktionen
Benutzerfreundlichkeit (10 % der Gesamtbewertung)
Für ein Gefühl der Usability jedes Systems habe ich folgende Aspekte betrachtet:
- Intuitives Oberflächendesign
- Einfache Navigation
- Anpassbare Dashboards
- Benutzerfreundlicher Einrichtungsprozess
- Klar verständliche Datenvisualisierung
Onboarding (10% der Gesamtpunktzahl)
Um die Onboarding-Erfahrung jeder Plattform zu bewerten, habe ich Folgendes berücksichtigt:
- Verfügbarkeit von Schulungsvideos
- Interaktive Produkttouren
- Umfassende Dokumentation
- Zugang zu Webinaren und Tutorials
- Unterstützung durch Chatbots oder Live-Hilfe
Kundensupport (10% der Gesamtpunktzahl)
Um die Kundensupportdienste der jeweiligen Software-Anbieter zu bewerten, habe ich Folgendes berücksichtigt:
- Rund-um-die-Uhr-Erreichbarkeit des Supports
- Mehrere Support-Kanäle
- Reaktionsfähigkeit des Support-Teams
- Zugang zu einer Wissensdatenbank
- Qualität der Fehlerbehebungsanleitungen
Preis-Leistungs-Verhältnis (10% der Gesamtpunktzahl)
Um das Preis-Leistungs-Verhältnis jeder Plattform zu bewerten, habe ich Folgendes berücksichtigt:
- Wettbewerbsfähige Preispläne
- Leistungsumfang der Basispakete
- Flexibilität der Abonnementoptionen
- Rabatte für langfristige Bindungen
- Verfügbarkeit von kostenlosen Testphasen oder Demos
Kundenbewertungen (10% der Gesamtpunktzahl)
Um einen Gesamteindruck der Kundenzufriedenheit zu erhalten, habe ich beim Lesen von Kundenbewertungen Folgendes berücksichtigt:
- Rückmeldungen zur Zuverlässigkeit
- Kommentare zur Benutzerfreundlichkeit
- Zufriedenheit mit dem Kundensupport
- Erkenntnisse zur Wirksamkeit der Funktionen
- Gesamteindruck vom Preis-Leistungs-Verhältnis
So wählen Sie ein Website-Monitoring-Tool aus
Es ist leicht, sich in langen Funktionslisten und komplexen Preisstrukturen zu verlieren. Damit Sie beim Software-Auswahlprozess fokussiert bleiben, finden Sie hier eine Checkliste mit Faktoren, die Sie im Hinterkopf behalten sollten:
| Faktor | Worauf achten? |
|---|---|
| Skalierbarkeit | Kann das Tool mit dem Wachstum Ihrer Website umgehen? Stellen Sie sicher, dass es steigenden Traffic und zusätzliche Überwachungsanforderungen unterstützt, ohne zusätzliche Kosten oder Komplexität zu verursachen. |
| Integrationen | Funktioniert es mit Ihren bestehenden Systemen? Prüfen Sie die Kompatibilität mit Ihrem bestehenden Technologiestack, um Integrationsprobleme und unnötige Workarounds zu vermeiden. |
| Anpassbarkeit | Können Sie Benachrichtigungen und Dashboards individuell gestalten? Achten Sie auf Tools, mit denen sich Einstellungen auf die Arbeitsabläufe und Reporting-Bedürfnisse Ihres Teams abstimmen lassen. |
| Benutzerfreundlichkeit | Ist die Benutzeroberfläche intuitiv? Ein Tool sollte einfach zu bedienen sein und Ihrem Team einen schnellen Zugriff sowie eine einfache Interpretation von Daten ermöglichen, ohne umfangreiche Schulungen. |
| Implementierung und Onboarding | Wie schnell können Sie starten? Bewerten Sie Einrichtungszeit, vorhandenen Support sowie Hilfsmittel wie Tutorials oder Vorlagen, um die Umstellung zu erleichtern. |
| Kosten | Passt es in Ihr Budget? Vergleichen Sie Preismodelle, achten Sie auf versteckte Gebühren und prüfen Sie die langfristigen Kosten im Verhältnis zum Nutzen, einschließlich möglicher kostenloser Testangebote. |
| Sicherheitsmaßnahmen | Wie schützt das Tool Ihre Daten? Es sollte Ihre Sicherheitsstandards erfüllen und Funktionen wie Verschlüsselung, regelmäßige Updates und Backups bieten. |
Was ist ein Website-Monitoring-Tool?
Ein Website-Monitoring-Tool ist eine Software, die Leistung und Verfügbarkeit von Websites überwacht und analysiert. IT-Fachleute, Webentwickler und Seitenadministratoren nutzen solche Tools üblicherweise, um sicherzustellen, dass ihre Websites reibungslos und effizient laufen. Die Überwachung der Erreichbarkeit, Analyse der Ladegeschwindigkeit und Benachrichtigungen bei Problemen helfen dabei, Schwierigkeiten frühzeitig zu erkennen und eine optimale Leistung aufrechtzuerhalten. Insgesamt bieten diese Tools Sicherheit, indem sie gewährleisten, dass Websites korrekt und zuverlässig funktionieren.
Funktionen
Achten Sie bei der Auswahl eines Website-Monitoring-Tools auf folgende Schlüsselfunktionen, die Hand in Hand mit Hardware-Monitoring-Software arbeiten:
- Uptime-Überwachung: Überwacht die Erreichbarkeit Ihrer Website und benachrichtigt Sie, wenn sie ausfällt, um minimale Ausfallzeiten sicherzustellen.
- Reaktionszeit-Überwachung: Misst, wie schnell Ihre Website auf Benutzeranfragen reagiert, und hilft dabei, eine schnelle Benutzererfahrung aufrechtzuerhalten.
- Benachrichtigungen bei Problemen: Sendet Warnungen per E-Mail, SMS oder über andere Kanäle, sobald Probleme erkannt werden, damit Sie schnell handeln können.
- Leistungsberichte: Bietet detaillierte Berichte zur Website-Leistung, um datenbasierte Verbesserungsentscheidungen zu unterstützen.
- Überwachung von mehreren Standorten: Überprüft die Erreichbarkeit Ihrer Website von verschiedenen geografischen Standorten, um weltweite Zugänglichkeit sicherzustellen.
- Anpassbare Dashboards: Ermöglicht es Ihnen, die Datenansicht auf die Bedürfnisse Ihres Teams zuzuschneiden, sodass Informationen leicht verständlich sind.
- Erweiterte Analysen: Bietet tiefere Einblicke in Leistungstrends und hilft dabei, potenzielle Probleme zu erkennen und zu lösen.
- API-Zugang: Integriert Monitoring-Daten mit anderen Systemen und sorgt für eine nahtlose technische Umgebung.
- Historische Datenspeicherung: Speichert Aufzeichnungen vergangener Leistungsdaten und unterstützt so langfristige Analysen und Planungen.
- Synthetisches Monitoring: Simuliert Benutzerinteraktionen, um potenzielle Probleme zu erkennen, bevor sie echte Nutzer betreffen.
Vorteile
Die Implementierung eines Website-Monitoring-Tools bietet mehrere Vorteile für Ihr Team und Ihr Unternehmen. Hier sind einige, auf die Sie sich freuen können:
- Verbesserte Erreichbarkeit: Durch den sofortigen Empfang von Benachrichtigungen können Sie Probleme schnell beheben und einen reibungslosen Betrieb der Website gewährleisten.
- Schnellere Problemlösung: Mit der Überwachung der Reaktionszeiten können Sie Verlangsamungen gezielt erkennen und beheben, bevor sie sich auf Benutzer auswirken.
- Verbesserte Benutzererfahrung: Monitoring-Tools sorgen dafür, dass Ihre Website schnell und zugänglich ist und Besucher zufrieden bleiben.
- Datenbasierte Erkenntnisse: Leistungsberichte und erweiterte Analysen liefern wertvolle Informationen zur Optimierung Ihrer Website.
- Globale Erreichbarkeit: Die Überwachung von mehreren Standorten stellt die weltweite Verfügbarkeit Ihrer Website sicher und erweitert Ihre Zielgruppe.
- Fundierte Entscheidungsfindung: Die Speicherung historischer Daten erlaubt es Ihnen, Trends zu analysieren und Verbesserungen auf Basis vergangener Leistungen zu planen.
- Proaktives Problemlösen: Synthetisches Monitoring hilft dabei, potenzielle Probleme zu erkennen, bevor sie echte Nutzer betreffen, und reduziert damit zukünftige Störungen.
Kosten und Preise
Die Auswahl eines Website-Monitoring-Tools erfordert ein Verständnis der verschiedenen verfügbaren Preismodelle und Pläne. Die Kosten variieren je nach Funktionen, Teamgröße, Zusatzoptionen und mehr. Die folgende Tabelle fasst gängige Pläne, deren Durchschnittspreise und typische enthaltene Funktionen von Website-Monitoring-Tool-Lösungen zusammen:
Vergleichstabelle der Pläne für Website-Monitoring-Tools
| Plan-Typ | Durchschnittlicher Preis | Gängige Funktionen |
|---|---|---|
| Kostenloser Plan | $0 | Grundlegende Uptime-Überwachung, eingeschränkte Benachrichtigungen und begrenzte Datenspeicherung. |
| Persönlicher Plan | $5-$25/user/month | Uptime- und Reaktionszeitverfolgung, anpassbare Benachrichtigungen und Leistungsberichte. |
| Business-Plan | $50-$100/user/month | Überwachung mehrerer Standorte, erweiterte Analysen und API-Zugang. |
| Enterprise-Plan | $200-$500/user/month | Anpassbare Dashboards, synthetisches Monitoring, umfassender Support und umfangreiche historische Datenspeicherung. |
Website Monitoring Tool FAQs
Hier finden Sie Antworten auf häufig gestellte Fragen zu Website Monitoring Tools:
Wie wirkt sich Website-Ausfallzeit auf mein Unternehmen aus?
Ausfallzeiten der Website können zu Umsatzeinbußen, einem Imageschaden Ihrer Marke und einer geringeren Kundenzufriedenheit führen. Selbst kurze Ausfälle können Benutzer frustrieren und dazu bringen, nach Alternativen zu suchen. Regelmäßiges Monitoring hilft Ihnen, Probleme schnell zu erkennen und die Auswirkungen zu minimieren.
Welche gängigen Fehlercodes sollte ich überwachen?
Häufige Fehlercodes sind 404 (nicht gefunden), 401 (nicht autorisiert) und 500 (interner Serverfehler). Das Überwachen dieser Codes hilft Ihnen, Probleme wie defekte Links, unautorisierte Zugriffsversuche und Serverprobleme zu erkennen, die sofortige Aufmerksamkeit erfordern.
Wie funktionieren Alarmbenachrichtigungen?
Alarmbenachrichtigungen informieren Sie über Probleme wie Ausfallzeiten oder Leistungsabfälle. Sie können Benachrichtigungen per E-Mail, SMS oder auf anderem Wege erhalten. Das Einrichten solcher Benachrichtigungen stellt sicher, dass Sie umgehend über Probleme informiert werden und schnell reagieren können.
Was ist Server-Monitoring und warum ist es wichtig?
Beim Server-Monitoring wird die Leistung der Serverressourcen wie CPU-, RAM- und Festplattenauslastung überwacht. Es hilft Ihnen, potenzielle Probleme zu erkennen und zu beheben, bevor sie die Website-Performance beeinträchtigen. So bleibt Ihre Seite erreichbar und leistungsfähig.
Wie kann mein Website von SSL-Monitoring profitieren?
SSL-Monitoring überprüft die Gültigkeit und das Ablaufdatum Ihrer SSL-Zertifikate. Dies gewährleistet sichere Verbindungen für Ihre Nutzer und verhindert Probleme wie abgelaufene Zertifikate, die zu Warnungen beim Vertrauen oder potenziellen Datenlecks führen können.
Was ist die Content-Match-Funktion im Website-Monitoring?
Die Content-Match-Funktion überprüft Ihre Website auf bestimmte Zeichenfolgen oder Inhalte. Sie ist hilfreich, um sicherzustellen, dass wichtige Informationen korrekt angezeigt werden und nicht verändert wurden – so bleibt die Integrität und Zuverlässigkeit Ihrer Seite erhalten.
Wie geht es weiter:
Wenn Sie sich gerade über Website Monitoring Tools informieren, verbinden Sie sich mit einem SoftwareSelect-Berater für kostenlose Empfehlungen.
Sie füllen ein Formular aus und führen ein kurzes Gespräch, bei dem Ihre spezifischen Bedürfnisse ermittelt werden. Im Anschluss erhalten Sie eine Liste passender Software zur Prüfung. Sie unterstützen Sie sogar während des gesamten Kaufprozesses, einschließlich Preisverhandlungen.