24 Best Zabbix Alternatives Reviewed in 2026

Best Zabbix Alternatives Shortlist
Here's my pick of the 10 best software from the 23 tools reviewed.


Managing IT infrastructure can be a headache, especially when your current tools don't quite fit. You might be using Zabbix, but find it lacking in certain areas. Maybe it’s the complexity or the lack of specific integrations that’s driving you to seek alternatives.
In my experience, finding the right open-source monitoring solution can make a big difference for your team. It should ease your workload, not add to it. I've reviewed various options to give you an unbiased view of the best Zabbix alternatives.
In this article, you’ll find a detailed look at each tool, highlighting what makes them stand out. Whether you’re after better scalability or specific features, I’ve got you covered.
What Is Zabbix?
Zabbix is an open-source monitoring solution that tracks the performance and availability of IT infrastructure. It's commonly used by IT administrators, network engineers, and DevOps teams to monitor network resources, servers, and applications. Automated alerts, data visualization, and scalability features help to identify issues, optimize resource use, and support system reliability. Overall, Zabbix offers a solid foundation for maintaining and observing IT environments.
Best Zabbix Alternatives Summary
This comparison chart summarizes pricing details for my top Zabbix alternatives to help you find the best one for your budget and business needs.
| Tool | Best For | Trial Info | Price | ||
|---|---|---|---|---|---|
| 1 | Best for plugin-driven custom monitoring logic | Free demo + free plan available | From $2,595/100 nodes | Website | |
| 2 | Best for zero configuration real-time metrics | 14-day free trial + free plan + free demo available | From $4.50/node/month (billed annually) | Website | |
| 3 | Best for usage-based observability pricing | Free plan + free demo available | Pricing upon request | Website | |
| 4 | Best for pre-built monitoring for cloud services | 14-day free trial + free plan available | From $15/host/month (billed annually) | Website | |
| 5 | Best for cost-effective, all-in-one monitoring | Free plan + free demo available | From $29/license/month | Website | |
| 6 | Best for managed ELK with guided setup | Free 14-day trial + free demo available | From $9/month (billed annually) | Website | |
| 7 | Best for automatic SNMP network discovery | Free demo available | Free to use | Website | |
| 8 | Best for open-source observability | 30-day free trial + free demo available | From $49/month | Website | |
| 9 | Best for high-performance monitoring at scale | Free plan + 30-day free trial available | From $225/month (billed annually) | Website | |
| 10 | Best centralized monitoring for large enterprises | Free demo + free 60-day trial + free plan available | From $5,000/year | Website |
Why Trust Our Software Reviews
-

Site24x7
Visit WebsiteThis is an aggregated rating for this tool including ratings from Crozdesk users and ratings from other sites.4.6 -
Docker
Visit WebsiteThis is an aggregated rating for this tool including ratings from Crozdesk users and ratings from other sites.4.6 -
Pulumi
Visit WebsiteThis is an aggregated rating for this tool including ratings from Crozdesk users and ratings from other sites.4.8


Best Zabbix Alternatives Reviews
Below are my detailed summaries of the best Zabbix alternatives that made it onto my shortlist. My reviews offer a detailed look at the key features, pros and cons, integrations, and ideal use cases of each tool to help you find the best one for you.
Nagios is a monitoring solution used primarily by IT professionals and system administrators to track network systems, servers, and applications. Automated alerts, data visualization, and scalability features help identify issues, optimize resources, and uphold system reliability.
Why it's a good Zabbix alternative: Nagios offers a wide range of plugins that can be customized to monitor various environments. This flexibility makes it ideal for teams with unique or complex IT setups. You can create and implement plugins to suit different monitoring needs, which improves adaptability.
Standout features and integrations:
Features include real-time alerting, performance data collection, and customizable dashboards. Real-time alerting keeps you informed of potential issues as they happen. The customizable dashboards let you create a monitoring view that suits your preferences.
Integrations include AWS, Azure, VMware, Docker, Slack, PagerDuty, ServiceNow, Splunk, Elasticsearch, Jira, and more.
Pros and Cons
Pros:
- Large ecosystem and community plugins and APIs
- Extensive customization for monitoring logic
- Mature, open-source tool
Cons:
- Manual configuration and maintenance overhead
- Outdated interface
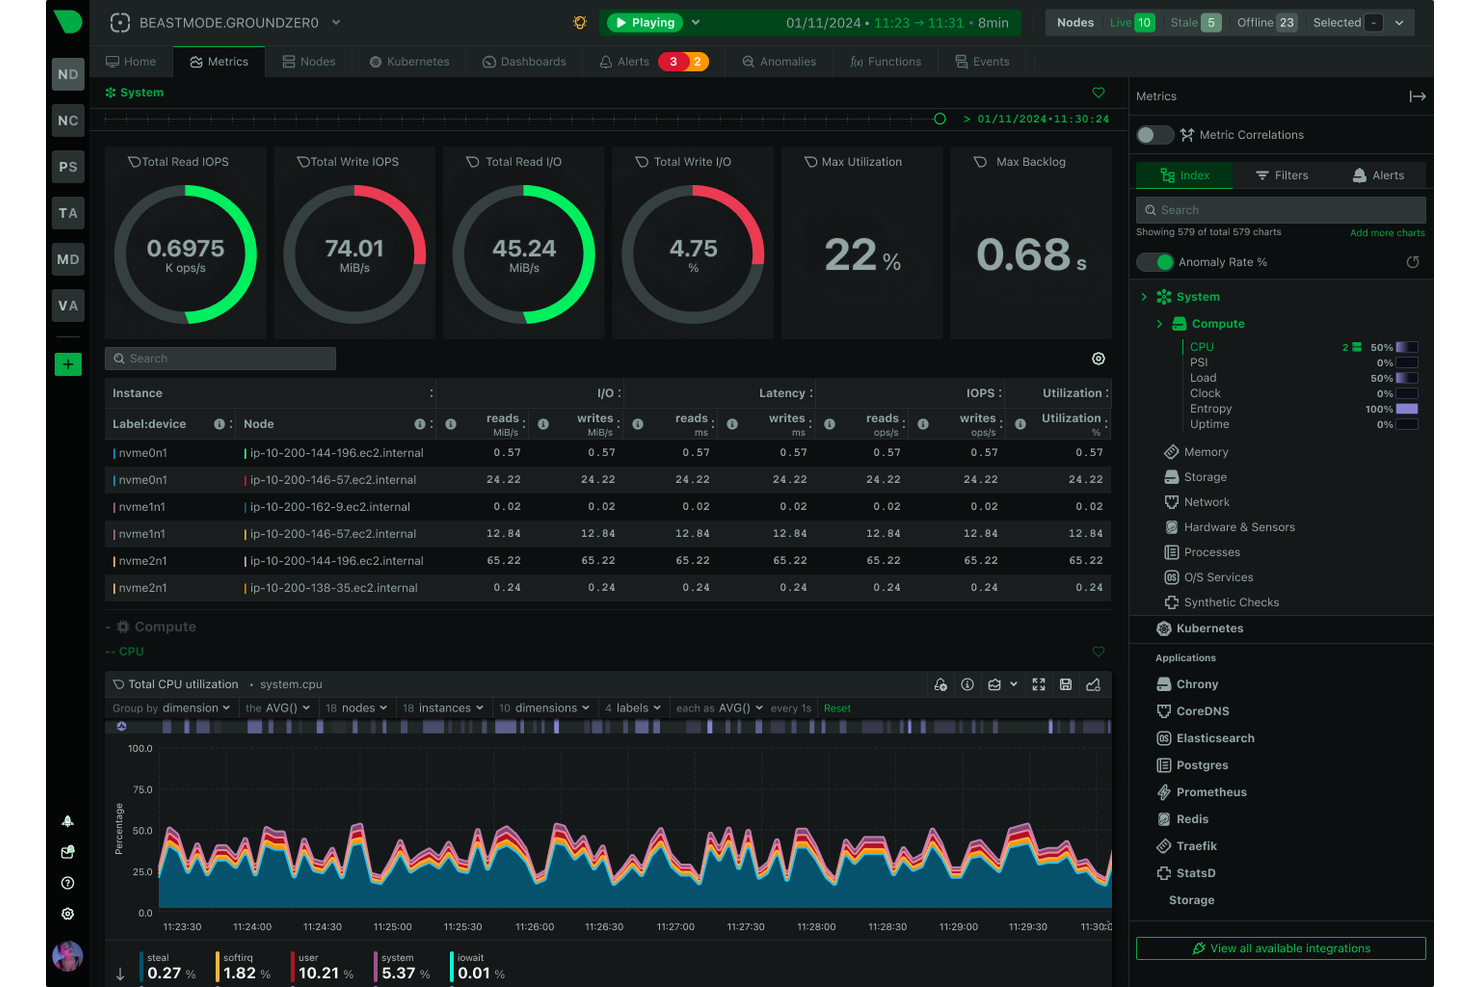
Netdata is a monitoring solution designed for IT professionals and DevOps teams who need real-time data to manage their infrastructure. It provides insights into system performance and health metrics, helping teams identify and resolve issues quickly.
Why it's a good Zabbix alternative: With real-time monitoring, interactive dashboards, and dynamic data visualization, Netdata delivers immediate insights to support quick decision-making. Unlike Zabbix, Netdata has more intuitive visual representations of data, making it easier for teams to understand system performance. The platform’s focus on real-time analytics helps you spot problems as they occur. Its user-friendly and intuitive interface delivers a smoother experience for tracking and diagnosing issues.
Standout Features and Integrations:
Features include automatic anomaly detection, customizable alarms, and detailed system health metrics. You can access a wide range of infrastructure monitoring capabilities tailored to different needs. The platform is designed to provide continuous insights without overwhelming you with unnecessary data.
Integrations include AWS, Azure, Google Cloud, Kubernetes, Docker, Slack, PagerDuty, Opsgenie, Prometheus, Grafana, and more.
Pros and Cons
Pros:
- Lightweight agent with low overheads
- Zero configuration auto-discovery
- Real-time, per-second system metrics
Cons:
- Advanced features require technical knowledge
- Limited historical data storage
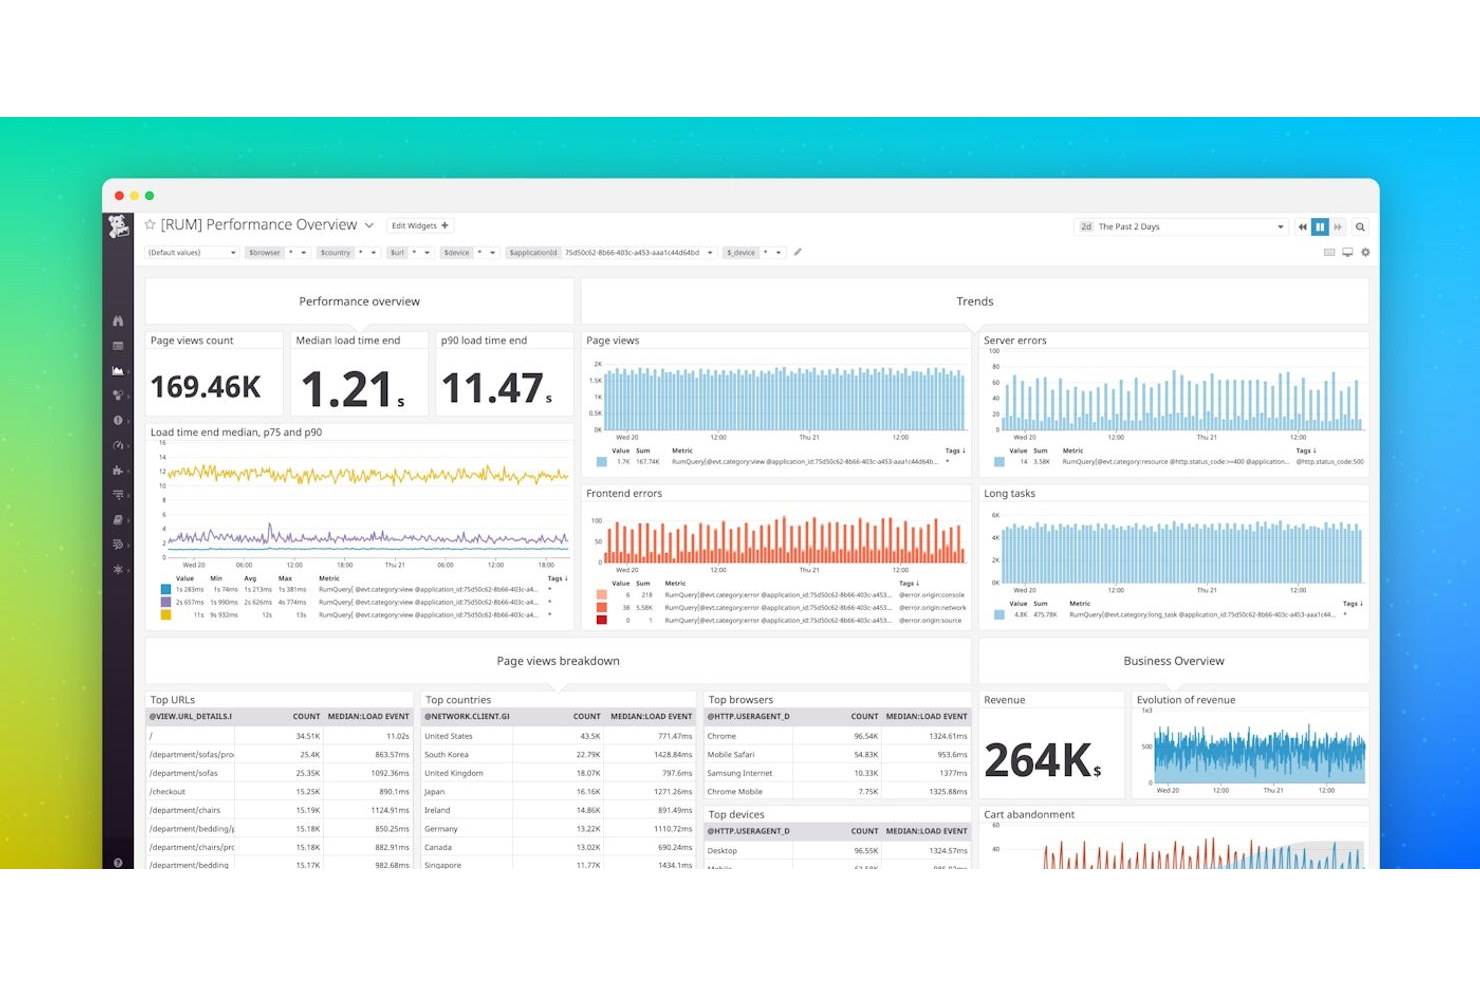
New Relic is an application performance monitoring tool used by developers and IT teams to track and optimize application performance. It helps you gain insights into your applications, infrastructure, and customer experience.
Why it's a good Zabbix alternative: New Relic provides detailed application performance insights with a focus on user experience. Its real-time analytics let you continuously monitor application health and performance. Usage-based pricing offers flexibility for teams looking to manage costs effectively. This pricing model allows your team to scale monitoring efforts based on usage, optomizing cost efficiency.
Standout Features and Integrations:
Features include real-time analytics, distributed tracing, and AIOps capabilities. Real-time analytics provide instant insights into application performance. Distributed tracing helps you track requests across services to identify bottlenecks.
Integrations include AWS, Azure, Google Cloud, Kubernetes, Docker, Slack, PagerDuty, Jira, ServiceNow, GitHub, and more.
Pros and Cons
Pros:
- Focus on user experience
- Strong application performance monitoring
- Usage-based pricing flexibility
Cons:
- Feature-dense user interface
- Monthly costs vary based on data ingestion and query volume
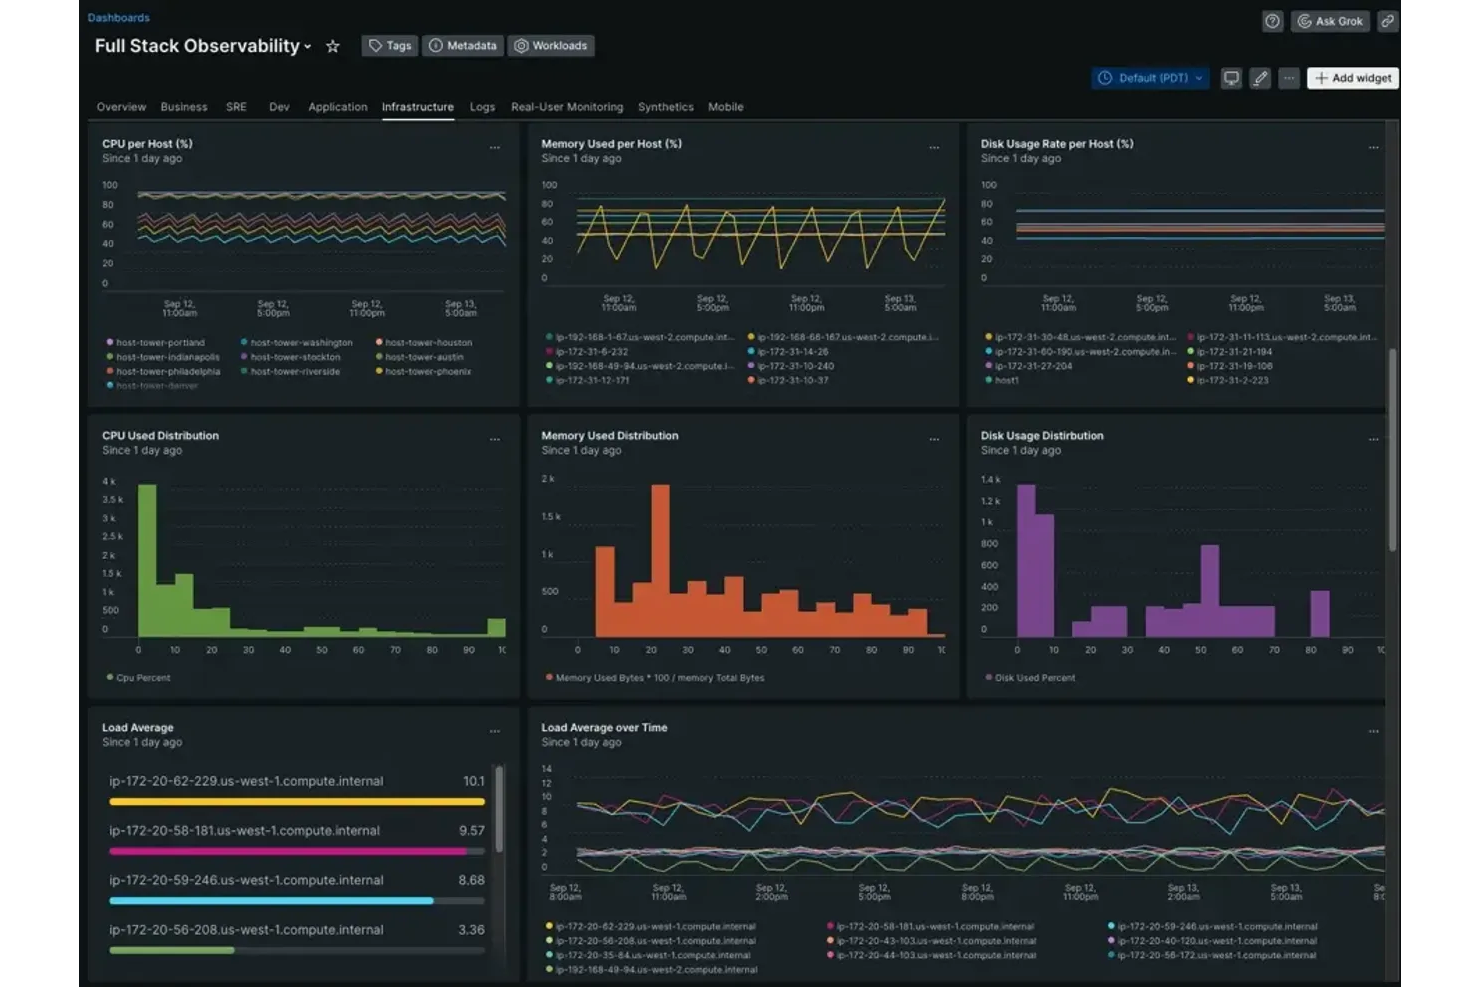
Datadog is a monitoring and analytics platform used by IT and DevOps teams to oversee cloud applications and infrastructure. It helps businesses track performance metrics, logs, and traces to support system reliability.
Why it's a good Zabbix alternative: Datadog's cloud integration capabilities make it ideal for teams using various cloud services. Its unified platform allows you to monitor applications, logs, and metrics in one place, which is essential for modern IT environments. The focus on cloud-native environments offers flexibility and ease in managing your cloud resources.
Standout Features and Integrations:
Features include real-time interactive dashboards, anomaly detection, and machine learning-based alerts. Real-time dashboards provide a clear view of your system's health. Anomaly detection helps you identify unusual patterns before they become issues.
Integrations include AWS, Azure, Google Cloud, Docker, Kubernetes, Slack, PagerDuty, GitHub, Jira, Terraform, and more.
Pros and Cons
Pros:
- Application monitoring and insights
- Unified monitoring platform
- Extensive integrations across cloud and SaaS tools
Cons:
- Complex pricing and usage tracking
- Costs can increase quickly at scale
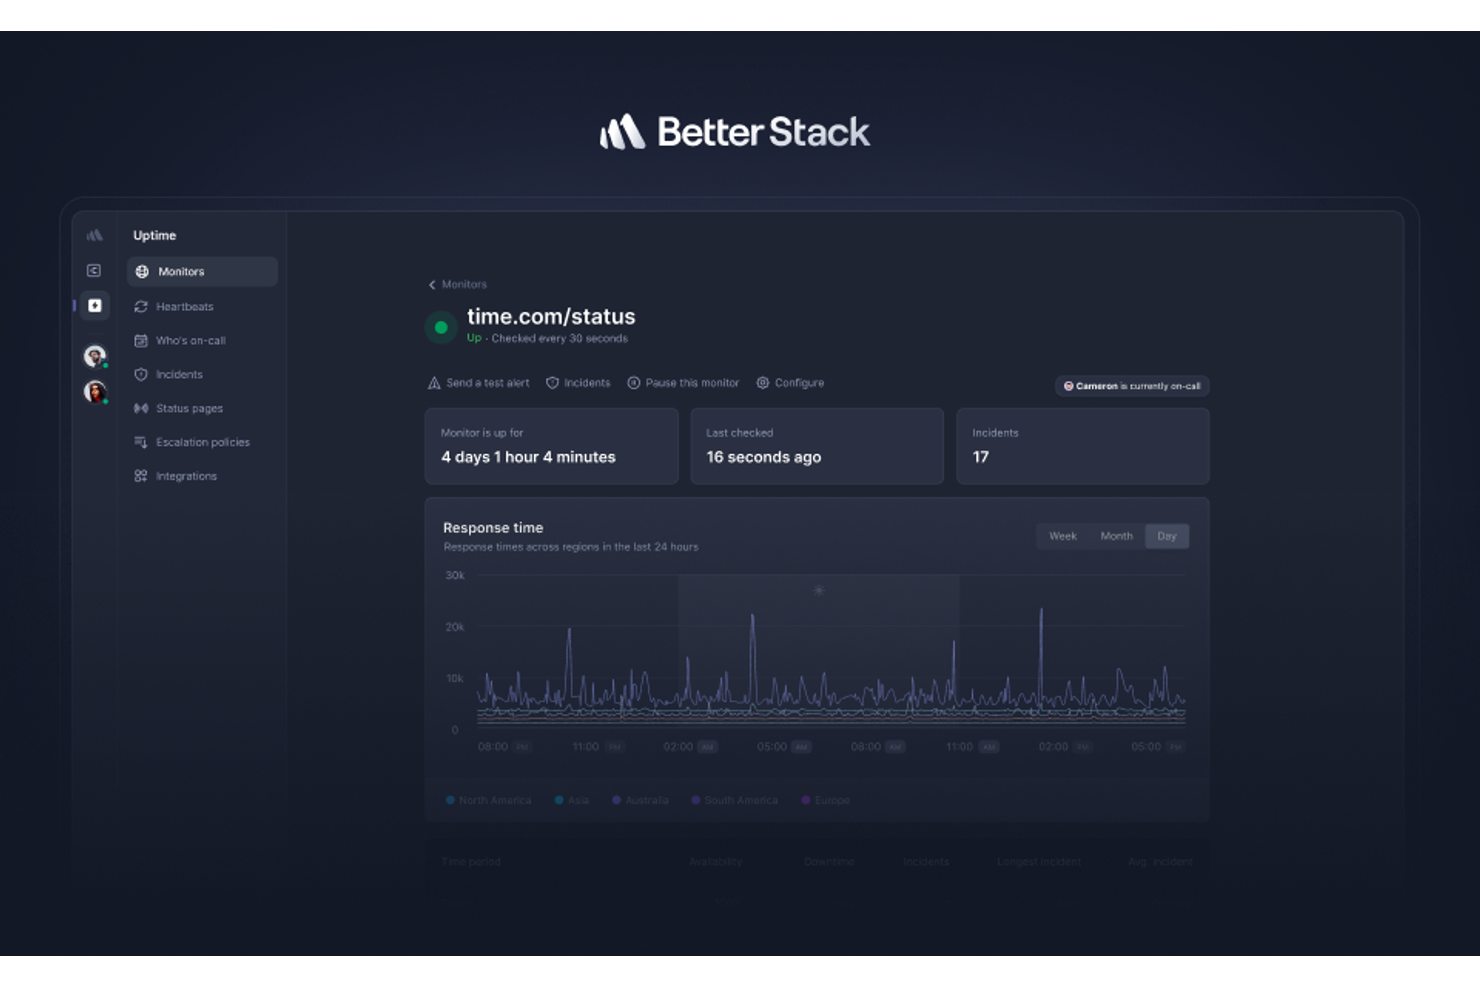
Better Stack is an observability platform used by IT professionals and DevOps teams to monitor infrastructure and applications. It focuses on incident management, uptime monitoring, and log management to help teams maintain system reliability.
Why it's a good Zabbix alternative: Its cost-effective pricing makes it a great choice for managing expenses while maintaining monitoring quality. Unlike Zabbix, Better Stack has AI-driven error tracking and a serverless ClickHouse data warehouse, allowing you to analyze data without vendor lock-in. The platform’s user-friendly interface simplifies monitoring processes for your team. Features such as incident management and uptime monitoring deliver in-depth oversight at a lower cost.
Standout Features and Integrations:
Features include automated root cause analysis, visual investigation tools, and unlimited alert notifications. Automated root cause analysis helps your team quickly identify and resolve issues. Visual investigation tools provide a clear view of slow requests and errors.
Integrations include Slack, Microsoft Teams, Jira, OpenTelemetry, Prometheus, AWS, Azure, Google Cloud, GitHub, PagerDuty, and more.
Pros and Cons
Pros:
- Simple and modern user interface
- AI-driven error tracking features
- Combines uptime monitoring, logging, and incident response
Cons:
- Limited advanced analytics
- Limited feature set for large enterprises
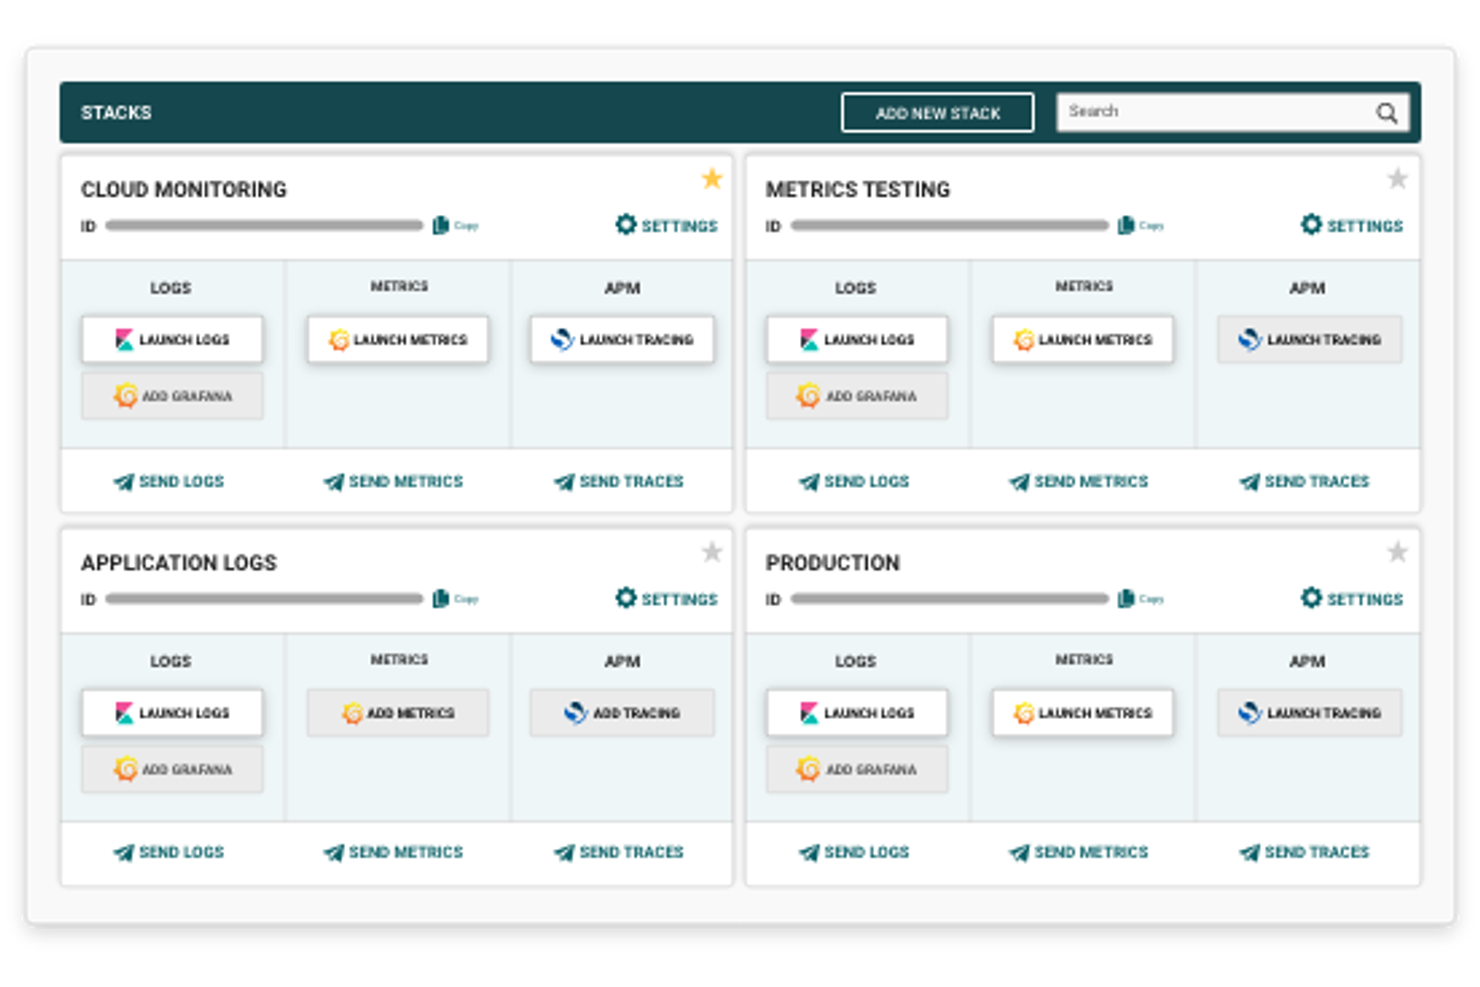
Logit.io is a managed observability platform designed for IT professionals and DevOps teams, and focuses on log management and application performance monitoring. It centralizes logs, metrics, and traces, helping teams monitor and analyze data from various sources.
Why it's a good Zabbix alternative: Its focus on ease of use makes Logit.io accessible for teams looking for straightforward monitoring solutions. Its user-friendly interface with customizable dashboards helps you to visualize data. Real-time data analysis and advanced alerting enable you to stay on top of issues without the complexity. The platform's managed services mean you spend less time on setup and maintenance.
Standout Features and Integrations:
Features include real-time data analysis, advanced alerting, and customizable dashboards. Real-time data analysis delivers the latest information at your fingertips. Advanced alerting keeps you informed of potential issues as they arise.
Integrations include OpenSearch, Grafana, Prometheus, AWS, Azure, Google Cloud, Elasticsearch, Logstash, Kibana, OpenTelemetry, and more.
Pros and Cons
Pros:
- Guided setup and simplified onboarding
- User-friendly interface
- Managed ELK and OpenSearch environments
Cons:
- Not as customizable as self-managed stacks
- Managed updates may occasionally lag
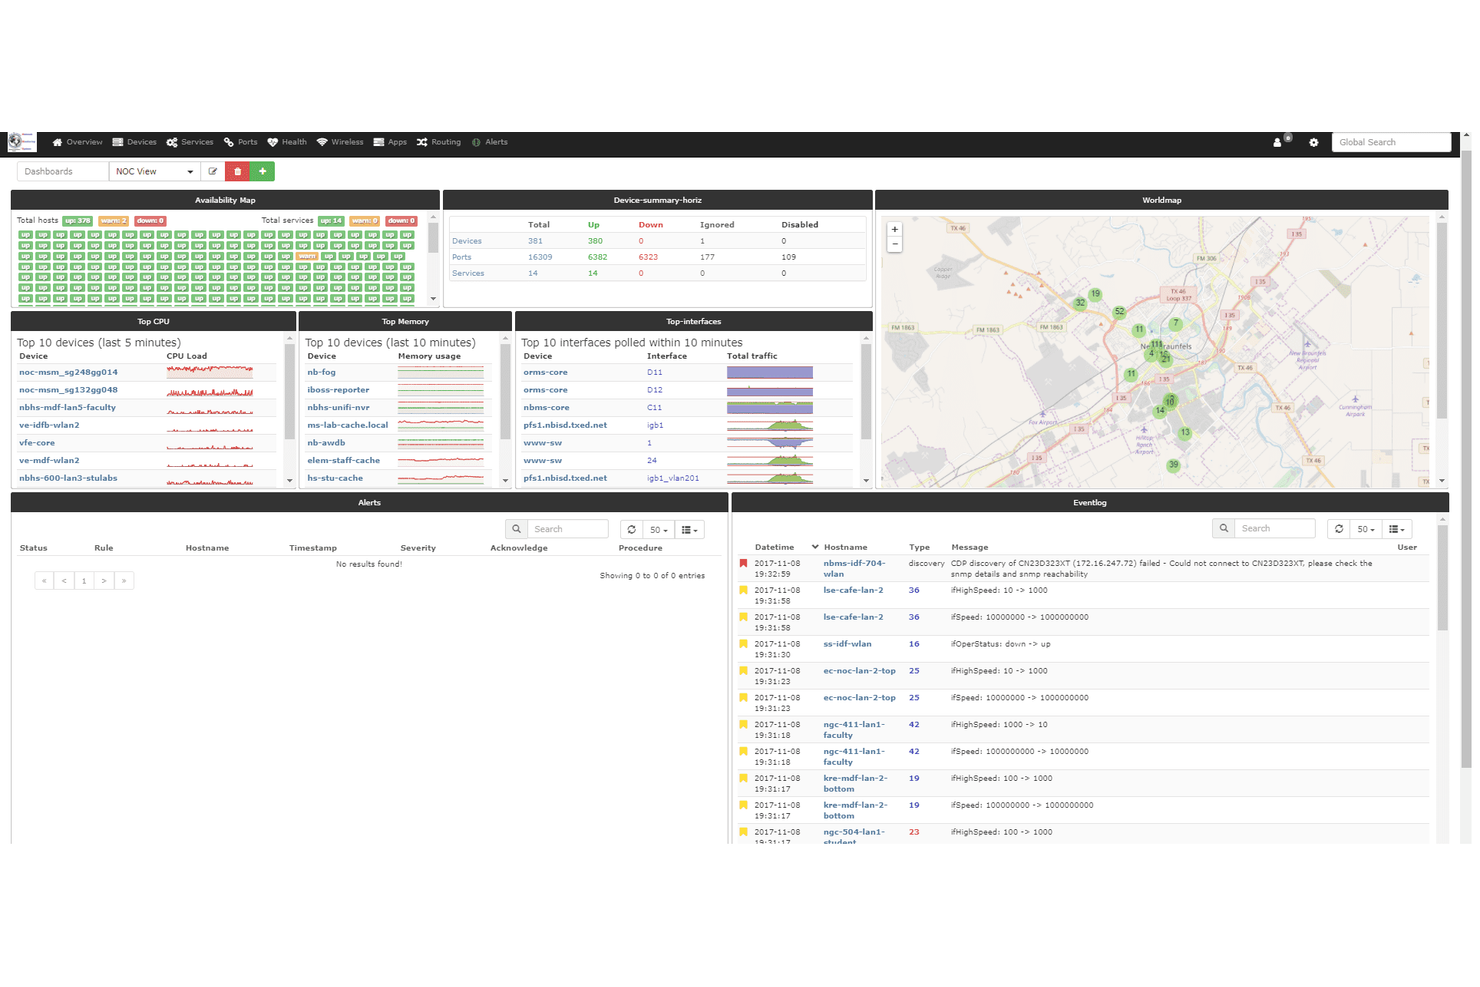
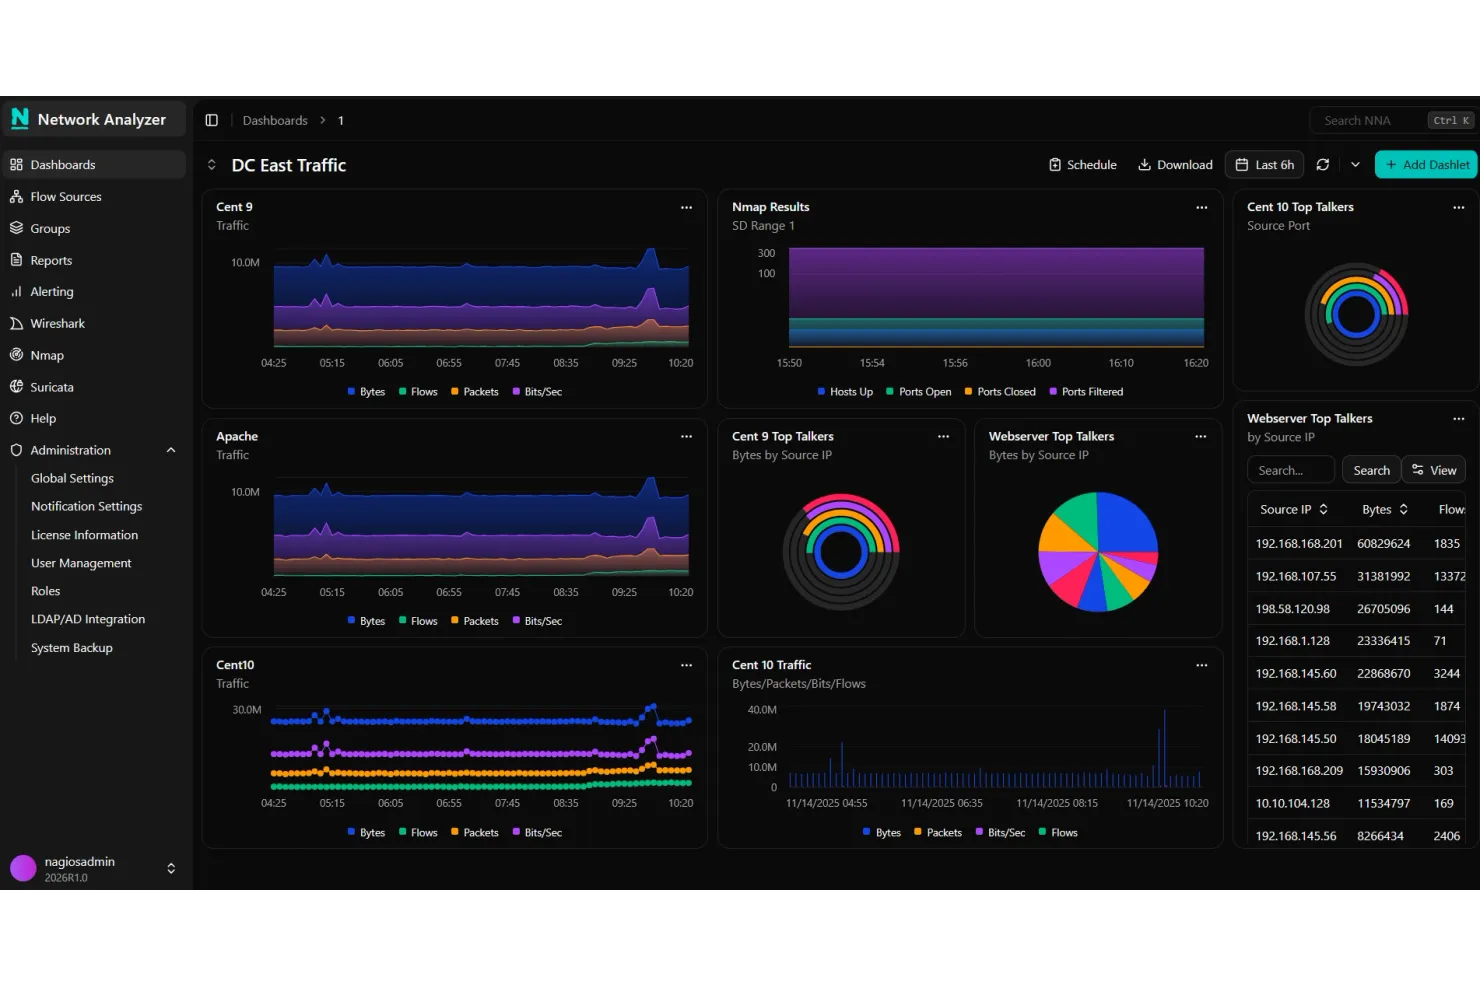
LibreNMS is a network monitoring tool used by administrators and IT professionals to monitor and manage network devices. It provides insights into network performance and helps maintain efficient operations.
Why it's a good Zabbix alternative: LibreNMS supports a variety of network protocols for enabling device detection and monitoring. Its automatic network discovery features make it easier for your team to manage a wide range of devices. The tool offers customizable alerting, so you stay informed about network issues in real-time. Its focus on network discovery enables you to manage devices in dynamic environments efficiently.
Standout Features and Integrations:
Features include detailed performance graphs, customizable alerting, and a mobile-friendly interface. Detailed performance graphs help you visualize network data effectively. Customizable alerting helps you receive notifications that matter to you.
Integrations include Slack, PagerDuty, Opsgenie, Microsoft Teams, VictorOps, Webex Teams, Mattermost, Discord, and more.
Pros and Cons
Pros:
- Community-driven updates and plugins
- Strong support for a wide range of network hardware
- Automatic network device discovery via SNMP
Cons:
- Limited application and server monitoring capabilities
- Requires SNMP knowledge for initial setup
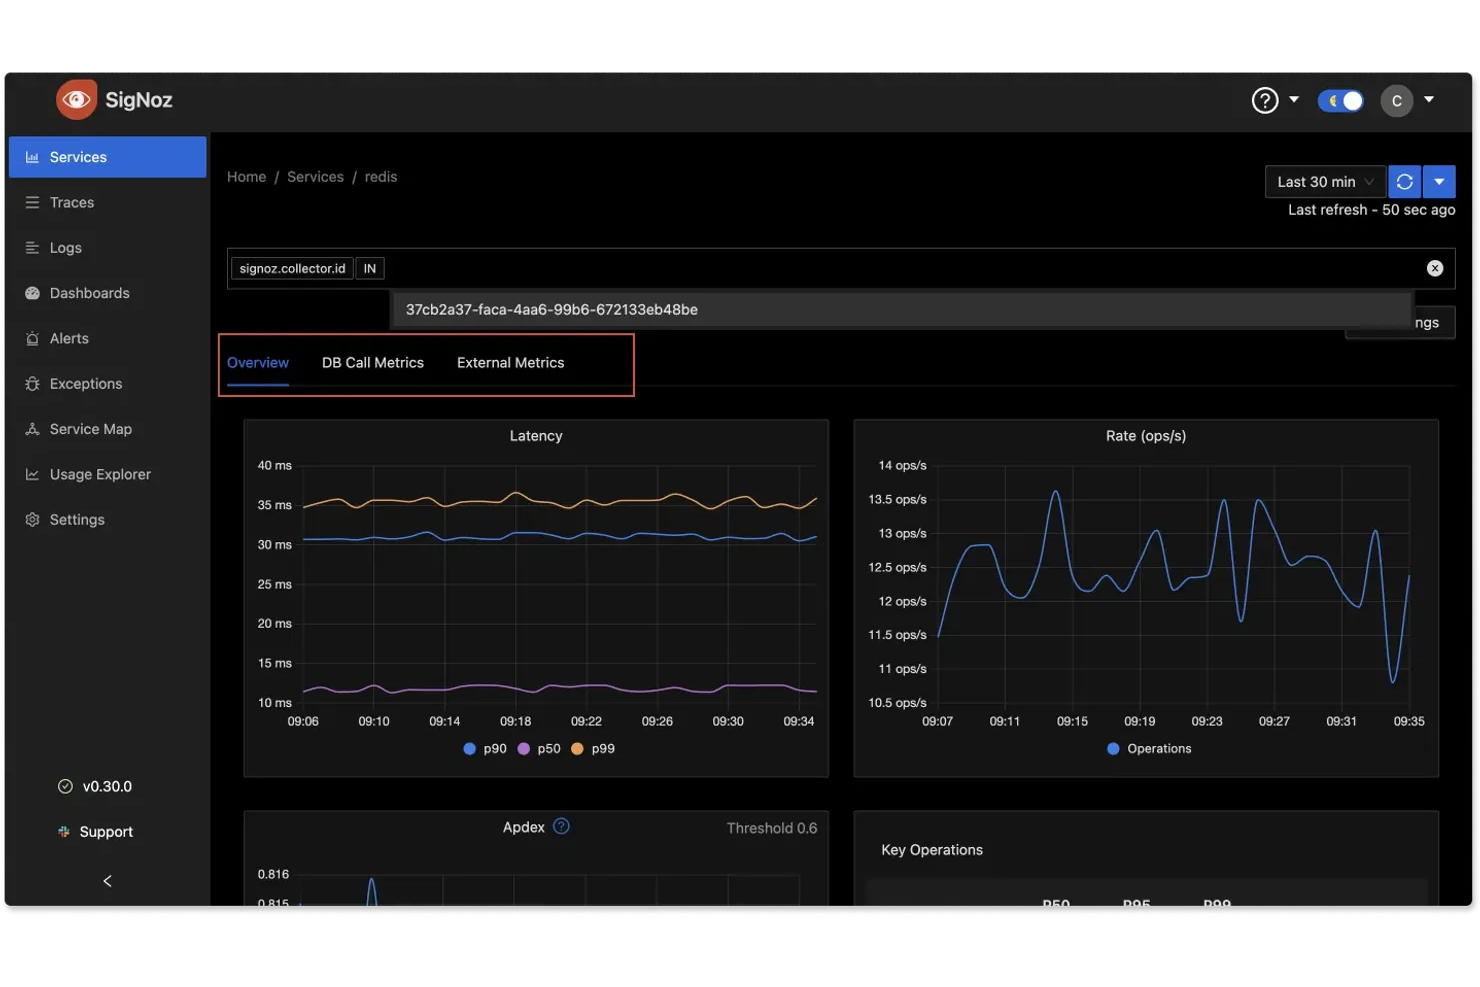
SigNoz is an observability platform that helps developers and DevOps teams to monitor and troubleshoot applications. It provides detailed insights into application performance and helps with identifying and resolving issues.
Why it's a good Zabbix alternative: SigNoz focuses on providing deep application-level insights, making it suitable for teams focusing on application performance. Its open-source observability tools make it easier for teams to customize and extend their monitoring capabilities. SigNoz offers features such as distributed tracing and log management to improve visibility. With its open-source nature, you can tailor the platform to fit your specific needs.
Standout Features and Integrations:
Features include distributed tracing, customizable dashboards, and real-time log management. Distributed tracing helps you track requests across services and identify bottlenecks. Customizable dashboards let you visualize key metrics in a way that suits your team's workflow.
Integrations include Prometheus, Grafana, OpenTelemetry, Kubernetes, Docker, AWS, Azure, Google Cloud, Elastic, Slack, and more.
Pros and Cons
Pros:
- OpenTelemertry tracing and metrics
- Deep application insights Native
- Open-source observability with full data ownership
Cons:
- Smaller ecosystem than commercial platforms
- Requires technical and operational expertise to manage
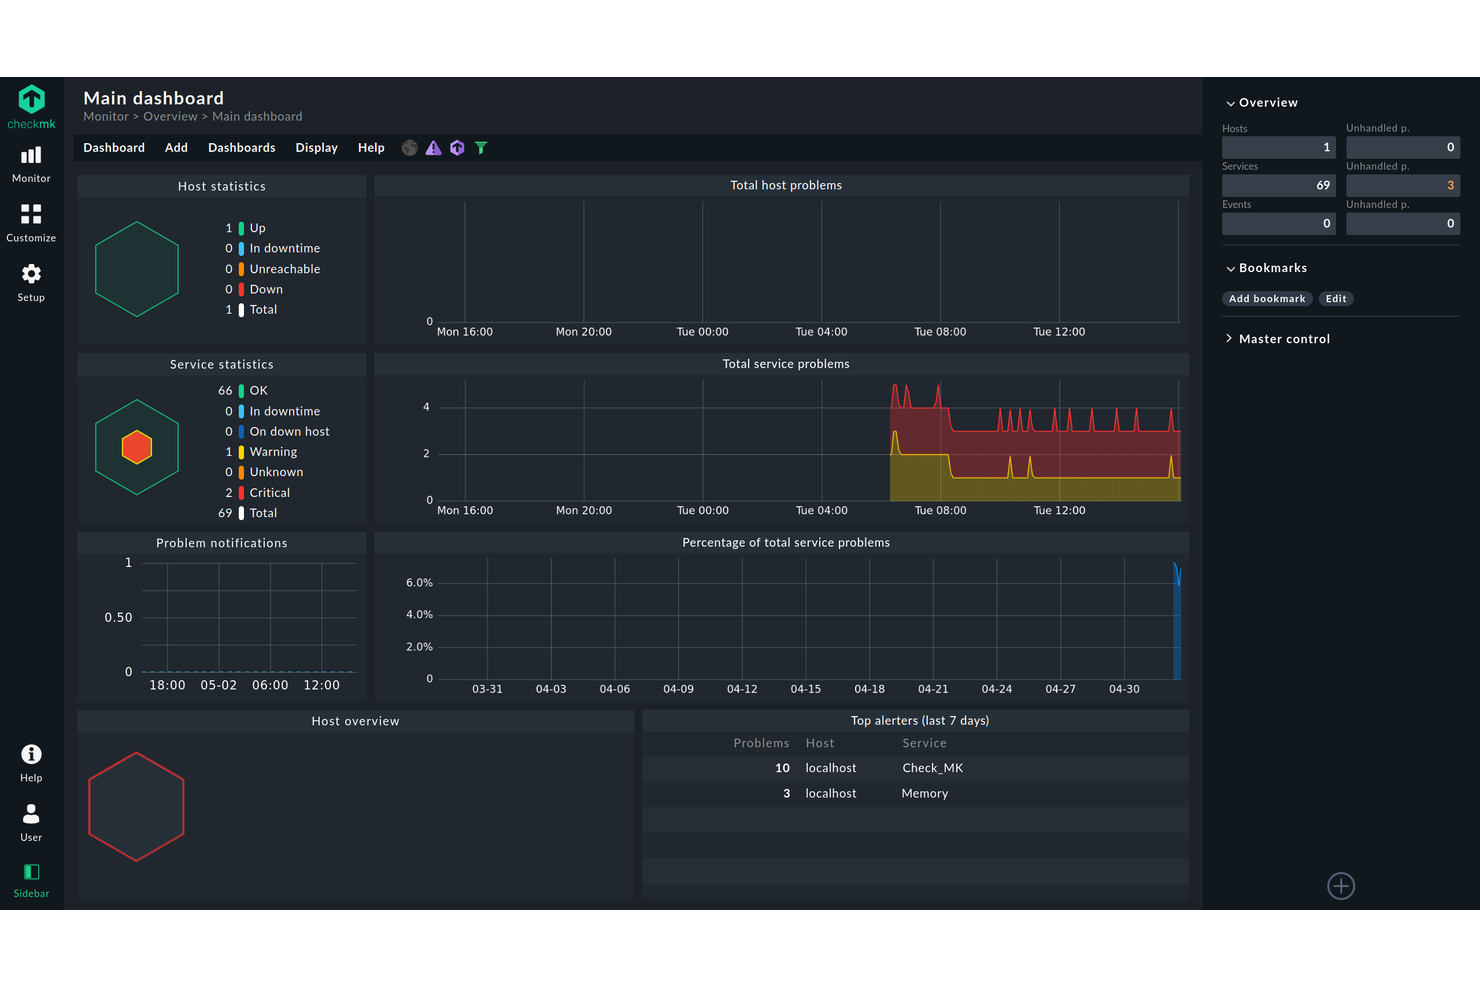
Checkmk is an IT monitoring software used by IT administrators and DevOps teams for application, network, infrastructure, and server monitoring. It provides detailed insights to help you maintain system reliability and performance.
Why it's a good Zabbix alternative: Checkmk efficiently handles large-scale environments with its distributed monitoring capabilities. The software’s modular architecture allows you to add or remove components as needed. With its focus on scalability, your team can manage more devices and services without compromising performance. This makes Checkmk ideal for growing businesses needing to monitor expanding infrastructures.
Standout Features and Integrations:
Features include dynamic dashboards, automated alerts, and performance data analysis. Dynamic dashboards allow you to customize your monitoring view for better insights. Automated alerts notify your team of potential issues in real-time.
Integrations include AWS, Azure, Docker, Kubernetes, Grafana, Prometheus, Nagios, Elastic, Slack, PagerDuty, and more.
Pros and Cons
Pros:
- Strong automation and rule-based configuration
- Efficient agent-based and agentless checks
- High-performance, large-scale monitoring
Cons:
- Resource-intensive at scale
- Complex configuration framework
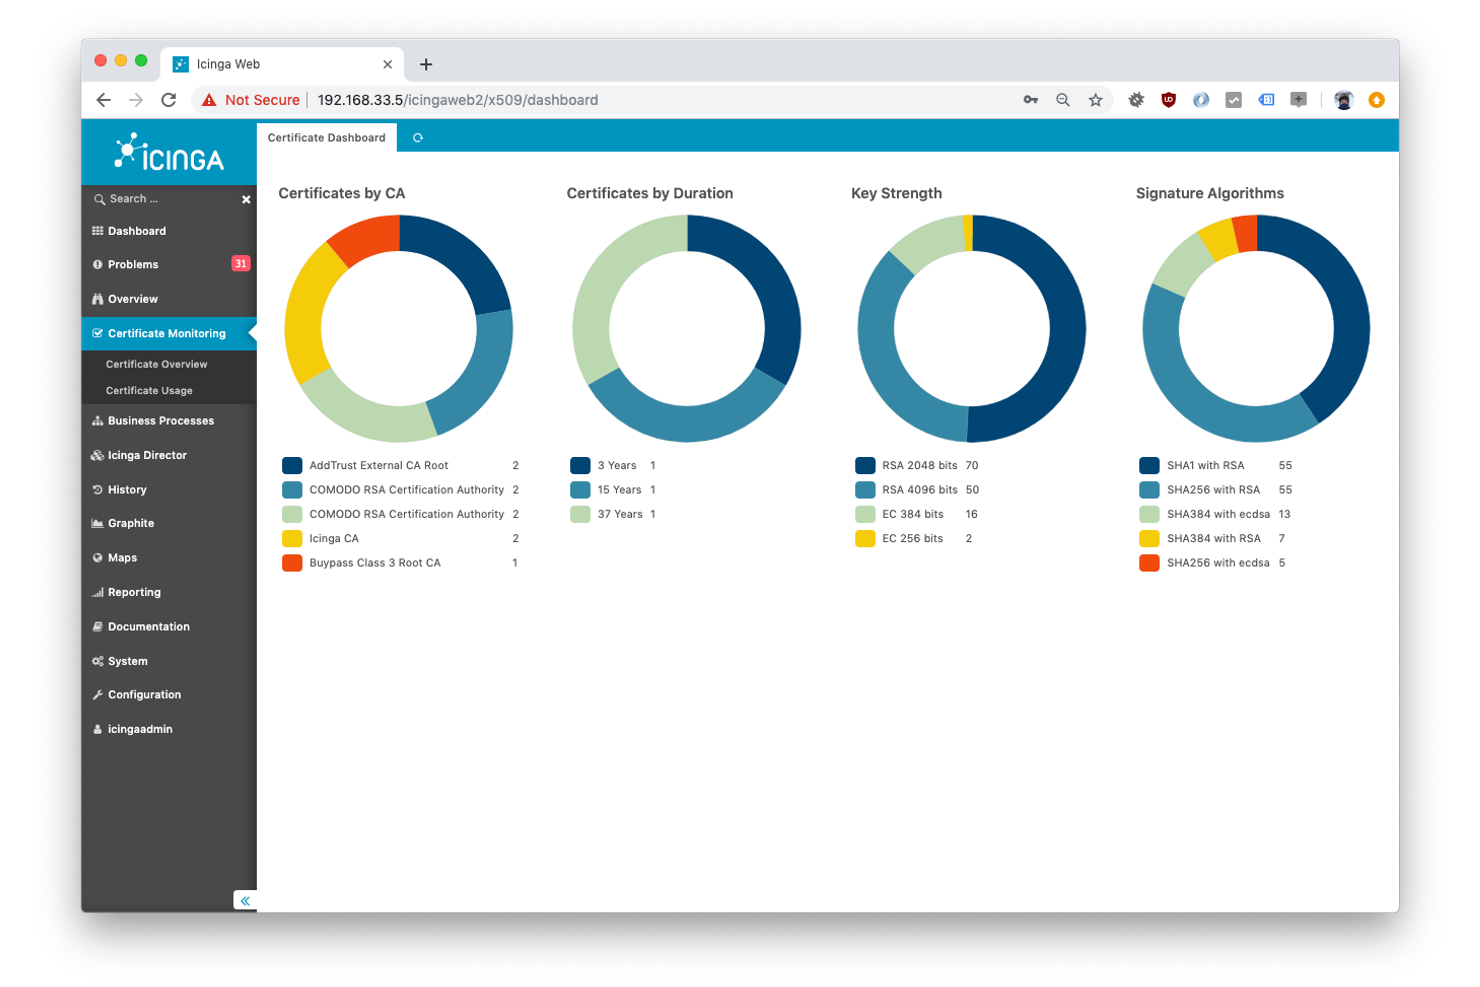
Icinga is a monitoring solution tailored for IT professionals managing complex infrastructures. Automated alerts, data visualization, and scalability features help identify issues, optimize resource use, and uphold system reliability.
Why it's a good Zabbix alternative: Its modular architecture allows for extensive customization and self-hosted monitoring, making it well-suited for intricate IT environments. Unlike Zabbix, Icinga offers flexible configuration options that adapt to your specific infrastructure needs. The ability to create an efficient monitoring system for large environments sets this solution apart. With its focus on scalability, you can grow your monitoring as your infrastructure expands.
Standout Features and Integrations:
Features include distributed monitoring, customizable dashboards, and advanced alerting mechanisms. Distributed monitoring allows you to oversee multiple locations from a single platform. Customizable dashboards give you control over how you view your data.
Integrations include Grafana, Prometheus, Elastic, AWS, Azure, Docker, Kubernetes, Puppet, Ansible, Chef, and more.
Pros and Cons
Pros:
- Strong support for complex, distributed environments
- Flexible configuration with fine-grained control
- Highly scalable solution
Cons:
- Complex manual setup
- Limited built-in templates
New Product Updates from Icinga
Icinga Introduces Contacts/Groups API
Icinga introduces the Contacts and Contact Groups REST API, enabling automated management of notification users and groups while keeping contact data consistent and synchronized across systems. For more information, visit Icinga's official site.
 .
.Other Zabbix Alternatives
Here are some additional Zabbix alternatives that didn’t make it onto my shortlist, but are still worth checking out:
- LogicMonitor
For cloud-native infrastructure monitoring
- Pulseway
For mobile-first IT monitoring
- ManageEngine OpManager
For network visualization and topology
- Dynatrace
For AI-based root cause analysis
- Progress WhatsUp Gold
For real-time network mapping
- ManageEngine Site24x7
For website and uptime monitoring
- OpenNMS
For open-source network monitoring
- Sematext
For log analytics with alerting
- Paessler PRTG
For bandwidth and traffic monitoring
- Obkio
For active network performance testing
- Exabeam
For UEBA-based security detection
- Auvik Network Management
For automated network mapping and inventory
- Last9
For SLO and reliability engineering


Zabbix Alternatives Selection Criteria
When selecting the best Zabbix alternatives to include in this list, I considered common buyer needs and pain points related to open-source monitoring solution products, such as ease of customization and scalability. I also used the following framework to keep my evaluation structured and fair:
Core Functionality (25% of total score)
To be considered for inclusion in this list, each solution had to fulfill these common use cases:
- Monitor network performance
- Track application health
- Provide real-time alerts
- Offer dashboards for data visualization
- Support multiple protocols
Additional Standout Features (25% of total score)
To help further narrow down the competition, I also looked for unique features, such as:
- AI-driven insights
- Automated anomaly detection
- Customizable alerting
- Cloud-native support
- Integrated log management
Usability (10% of total score)
To get a sense of the usability of each system, I considered the following:
- Intuitive user interface
- Easy navigation
- Accessibility on mobile devices
- Customizable dashboards
- Minimal downtime
Onboarding (10% of total score)
To evaluate the onboarding experience for each platform, I considered the following:
- Availability of training videos
- Interactive product tours
- Access to webinars
- Presence of chatbots
- Ready-to-use templates
Customer Support (10% of total score)
To assess each software provider’s customer support services, I considered the following:
- Availability of 24/7 support
- Response time to inquiries
- Access to a knowledge base
- Availability of live chat
- Quality of support documentation
Value for Money (10% of total score)
To evaluate the value for money of each platform, I considered the following:
- Flexibility of pricing plans
- Transparency of costs
- Features included in basic plans
- Cost-benefit ratio
- Discounts for annual billing
Customer Reviews (10% of total score)
To get a sense of overall customer satisfaction, I considered the following when reading customer reviews:
- Overall satisfaction ratings
- Frequency of positive feedback
- Common issues mentioned
- Praise for specific features
- Feedback on customer support quality
Why Look for a Zabbix Alternative?
While Zabbix is a good choice for an open-source monitoring solution, there are a number of reasons why some users seek out alternatives. You might be looking for a Zabbix alternative because…
- You need a simpler setup process
- Your team wants more intuitive dashboards
- You require better cloud integration
- Scalability is a concern for your growing business
- You need more flexible alerting options
- Your team requires extensive customization
If any of these sound like you, you’ve come to the right place. My list contains several open-source monitoring options that are better suited for teams facing these challenges with Zabbix and looking for alternative solutions.
Features
Here are some of the key features of Zabbix, to help you contrast and compare what alternative solutions offer:
- Detailed monitoring: Monitors networks, servers, cloud services, and applications for diverse metric collection.
- Real-time problem detection: Automates detection, anomaly identification, and customizable alerts for proactive management.
- Visualization and reporting: Offers customizable dashboards, geo-maps, and scheduled reports for effective data representation.
- Integration and scalability: Integrates with various IT systems and supports distributed monitoring through proxies.
- User management and deployment: Provides just-in-time user provisioning, quick deployment options, and automatic agent deployment.
- Training and community support: Includes structured training programs, community engagement, and professional services for user proficiency.
- Agent and agent-less monitoring: Supports both agent-based and agentless monitoring using various protocols.
- Synthetic monitoring: Emulates real-life transactions for web applications to track performance metrics.
- Data transformation: Normalizes and optimizes data for efficient management and analysis.
- Smart problem detection: Uses smart thresholds and machine learning for instant problem detection and trend prediction.
What’s Next:
If you're in the process of researching an open-source monitoring solution, connect with a SoftwareSelect advisor for free recommendations.
You fill out a form and have a quick chat where they get into the specifics of your needs. Then you'll get a shortlist of software to review. They'll even support you through the entire buying process, including price negotiations.