10 Best ML Experiment Tracking Tools In 2026

Best ML Experiment Tracking Tools Shortlist


ML experiment tracking tools help you log, organize, and compare machine learning experiments so you can manage results and reproduce findings with confidence. If you’re looking for practical ways to track experiments, share progress with your team, or keep your models and datasets organized, the right tool can make a big difference.
In this list, you’ll find solutions tailored for different technical stacks and workflows, helping you reduce friction, simplify reporting, and focus on reliable machine learning experiment management.
Why Trust Our Software Reviews
We’ve been testing and reviewing software since 2023. As tech leaders ourselves, we know how critical and difficult it is to make the right decision when selecting software.
We invest in deep research to help our audience make better software purchasing decisions. We’ve tested more than 2,000 tools for different tech use cases and written over 1,000 comprehensive software reviews. Learn how we stay transparent & our software review methodology.
Best ML Experiment Tracking Tools Summary
This comparison chart summarizes pricing details for my top ML experiment tracking tool selections to help you find the best one for your budget and business needs.
| Tool | Best For | Trial Info | Price | ||
|---|---|---|---|---|---|
| 1 | Best for real-time experiment comparison | Free plan available | From $19/user/month | Website | |
| 2 | Best for customizable visualization dashboards | Free plan available | From $60/month | Website | |
| 3 | Best for automatic versioning for pipelines | 14-day free trial available | Pricing upon request | Website | |
| 4 | Best for automatic pipeline orchestration | Free plan available | From $15/user/month | Website | |
| 5 | Best for open-source model lifecycle support | Free demo + free forever plan available | Free forever (open-source) | Website | |
| 6 | Best for native support for Google Cloud tools | Free plan available | Pricing upon request | Website | |
| 7 | Best for integration with deep learning frameworks | Free forever plan available | Free forever (open-source) | Website | |
| 8 | Best for enterprise-grade security and compliance | 30-day free trial available | Pricing upon request | Website | |
| 9 | Best for Kubernetes-native workflow management | Free plan available | Free and open source | Website | |
| 10 | Best for integration with AWS cloud ecosystem | Free plan available | Pricing upon request | Website |
-

TestDevLab
Visit Website -
Site24x7
Visit WebsiteThis is an aggregated rating for this tool including ratings from Crozdesk users and ratings from other sites.4.7 -
GitHub Actions
Visit WebsiteThis is an aggregated rating for this tool including ratings from Crozdesk users and ratings from other sites.4.8


Best ML Experiment Tracking Tools Reviews
Below are my detailed summaries of the best ML experiment tracking tools that made it onto my shortlist. My reviews offer a detailed look at the features, integrations, and best use cases of each platform to help you find the best one for you.
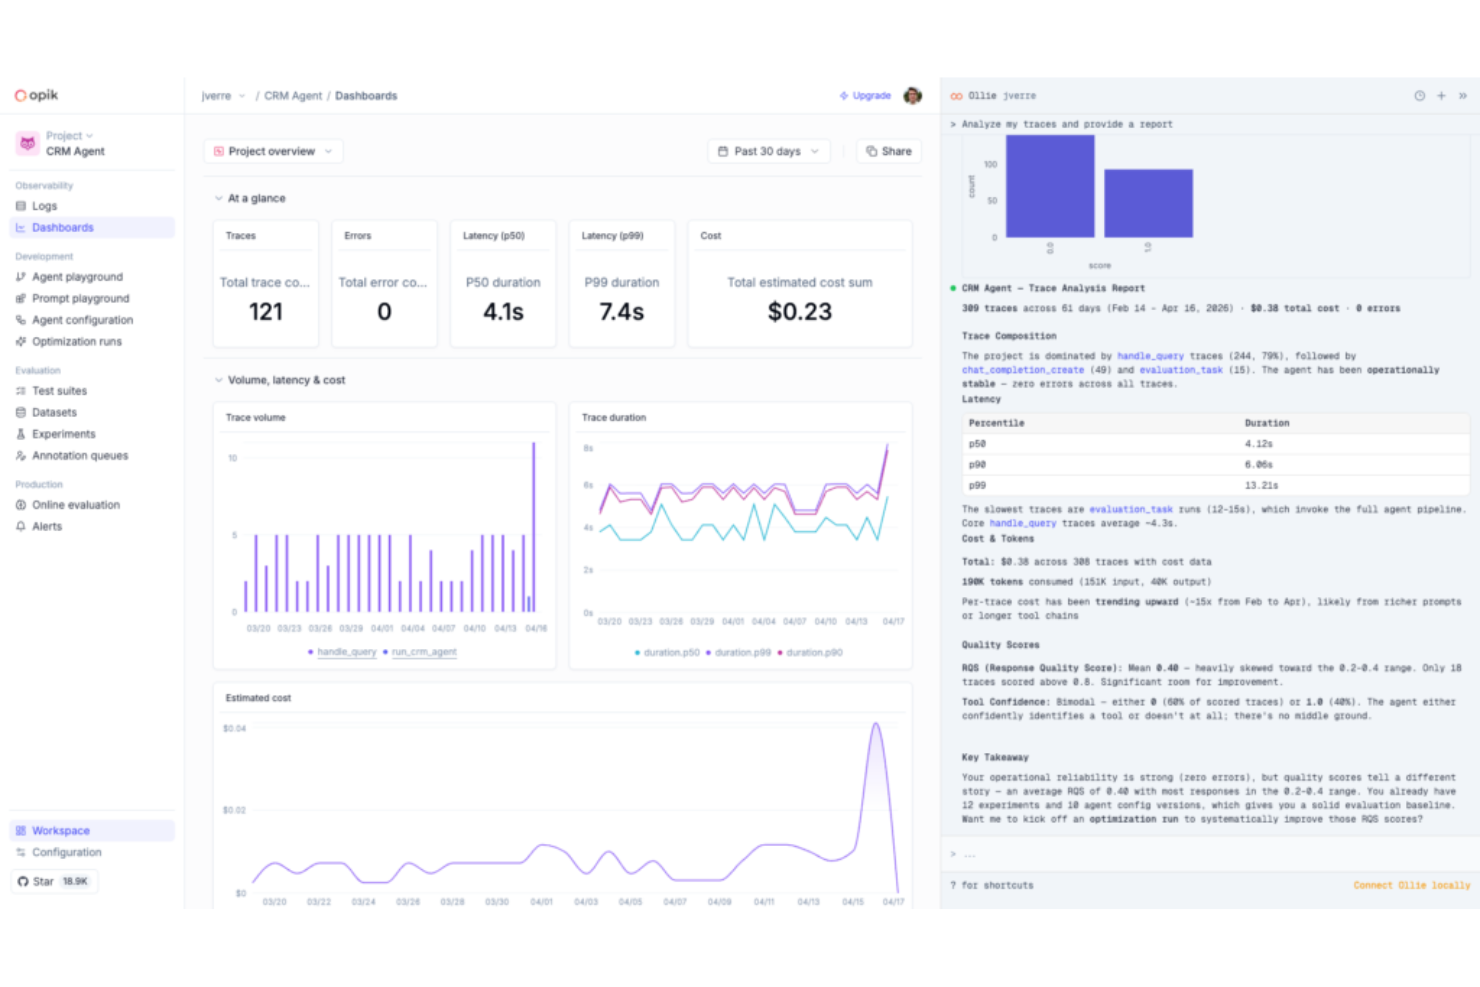
Comet is an ML experiment tracking and model evaluation platform that logs metrics, hyperparameters, and artifacts from training runs and extends into LLM observability and agentic AI evaluation through its Opik product.
Who Is Comet Best For?
Comet is a strong fit for ML and AI teams at growth-stage or enterprise companies that run high volumes of experiments and need live visibility into training runs.
Why I Picked Comet
I picked Comet as one of the best because its live experiment tracking dashboard updates metrics as training runs, so my team can spot a diverging loss curve and kill a bad run before it wastes compute. I also use its side-by-side experiment comparison view to filter across dozens of runs by hyperparameter value and immediately isolate which configuration drove the best validation accuracy. On top of classical MLOps, Comet now extends into LLM evaluation through Opik, which means I'm not switching tools when moving from model training to production agent monitoring.
Comet Key Features
- Model registry: Store, version, and manage trained models in a centralized registry with stage labels like staging and production.
- Artifact logging: Log and version datasets, images, confusion matrices, and audio files directly alongside experiment runs.
- Custom panels: Build custom visualizations inside the Comet UI using JavaScript to go beyond default metric charts.
- System metrics tracking: Automatically captures GPU utilization, CPU load, and memory usage for every run without additional instrumentation.
Comet Integrations
Comet offers 30+ native integrations, including PyTorch, TensorFlow, Keras, Scikit-learn, XGBoost, Hugging Face Transformers, Ray, Kubeflow, Snowflake, and Vertex AI. It's available on Zapier and provides a REST API along with Python, Java, JavaScript, and R SDKs for custom integrations.
Pros and Cons
Pros:
- Tracks both ML experiments and LLMs
- Real-time training run visualization
- Automatic metric logging with minimal code
Cons:
- UI customization options are limited
- Pro plan caps teams at 10 users
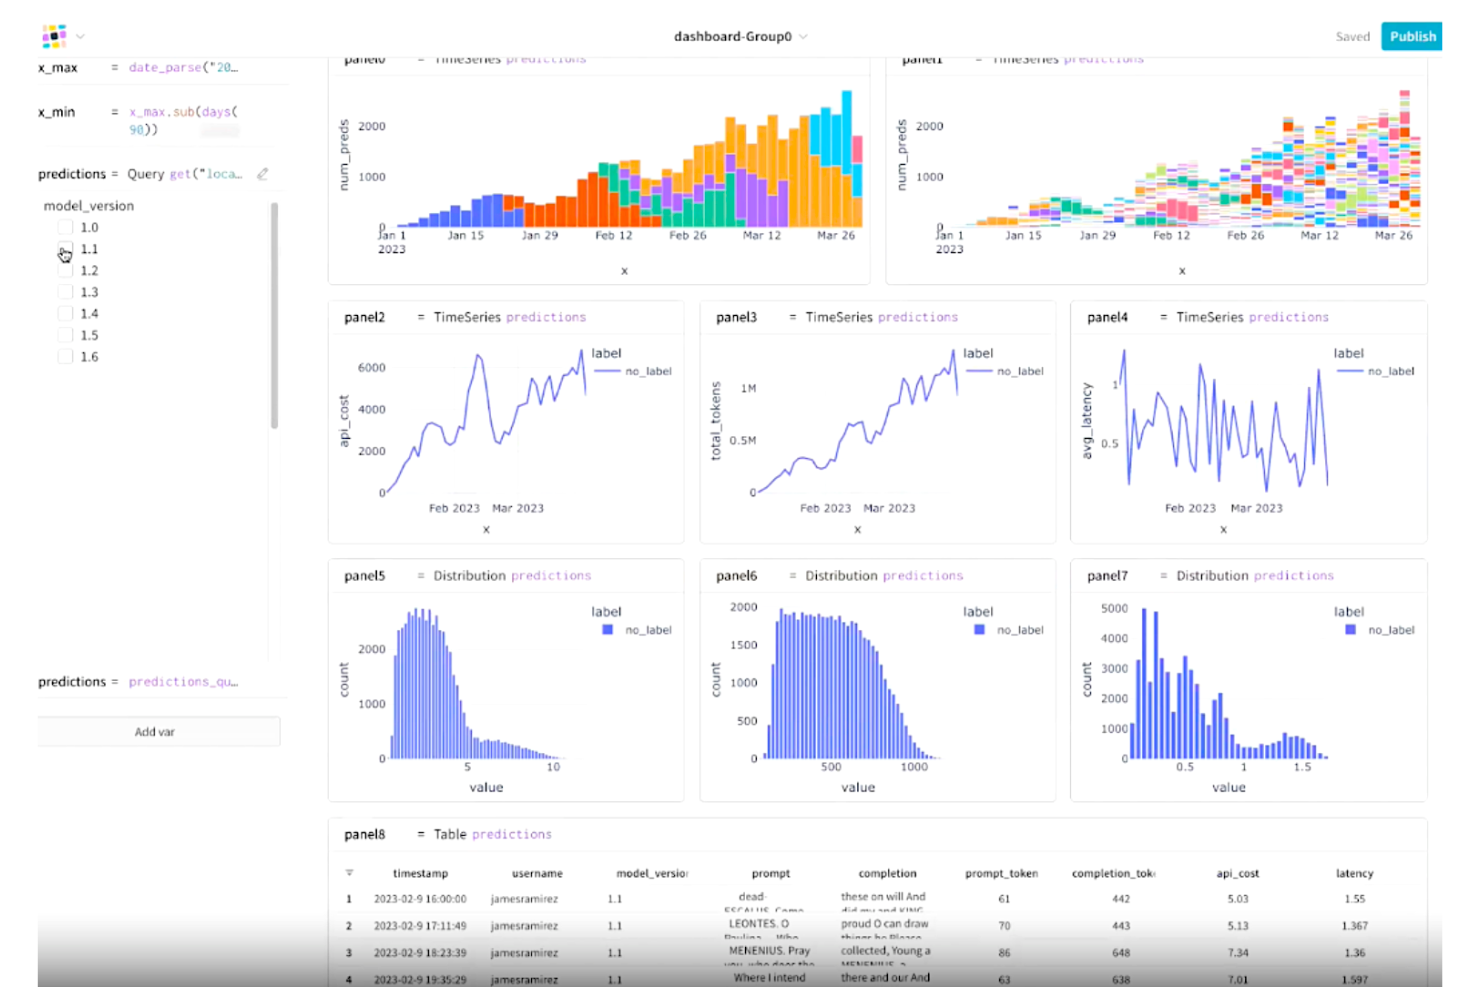
Weights & Biases is an ML experiment tracking platform that logs metrics, hyperparameters, and model checkpoints and lets you visualize and compare runs through interactive dashboards.
Who Is Weights & Biases Best For?
Weights & Biases is a strong fit for data scientists and ML engineers who run frequent experiments and need detailed run comparisons across large teams.
Why I Picked Weights & Biases
Weights & Biases is one of my top picks because I love how far it goes with customizable visualization dashboards. I can pull live GPU utilization, loss curves, and sample predictions into a single interactive dashboard during a training run, which makes spotting bottlenecks fast. The Sweeps feature lets me visualize hyperparameter search results directly alongside my experiment metrics, so I'm comparing everything in one view. Reports also let my team annotate and share those dashboards without leaving the platform.
Weights & Biases Key Features
- Artifacts: Version and track datasets, models, and evaluation results across experiment runs.
- Model registry: Centralize trained models and link them directly to the experiments that produced them.
- Run grouping: Organize related runs into groups to compare results across training configurations.
- Alerts: Set automated notifications for metric thresholds, run failures, or job completion events.
Weights & Biases Integrations
Weights & Biases offers native integrations with PyTorch, Keras, TensorFlow, Scikit-learn, XGBoost, Hugging Face Transformers, and PyTorch Lightning, plus LLM tools like LangChain and LlamaIndex. It also integrates with Kubeflow, Jenkins, Airflow, GitHub Actions, AWS SageMaker, and Google Vertex AI. An API and Python SDK are available for custom integrations.
Pros and Cons
Pros:
- Rich collaborative reports with embedded charts
- Automatic git commit and config logging
- Real-time metric streaming to live dashboards
Cons:
- Documentation gaps around basic functionality
- Web UI slows with many parallel runs
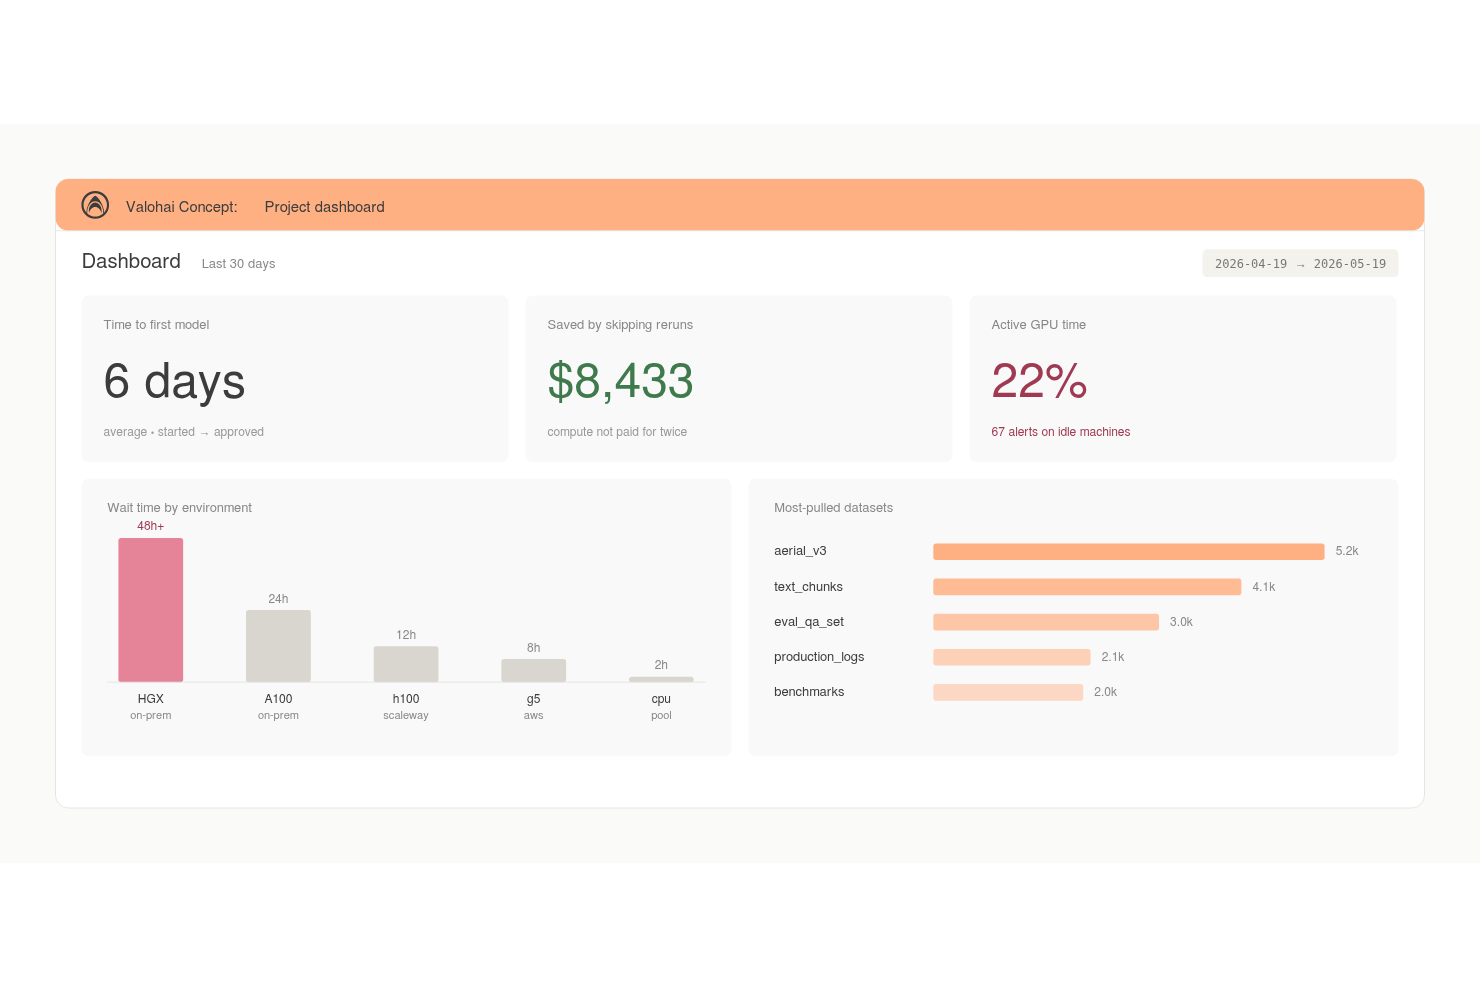
Valohai is an ML platform that combines automatic experiment tracking, dataset versioning, model lineage, and cloud compute orchestration for teams building and training models at scale.
Who Is Valohai Best For?
Valohai is a strong fit for ML engineering teams at mid-size to enterprise companies that run frequent training jobs across multiple cloud environments.
Why I Picked Valohai
I picked Valohai as one of the best because automatic versioning is genuinely baked into every run. Metrics, metadata, logs, and hyperparameters are versioned without any manual tagging, so I never have to reconstruct what ran when. I also like that Valohai tracks full dataset and model lineage, meaning I can trace exactly which dataset version produced any given model. Every run is reproducible by design, which removes the guesswork that kills experiment audits.
Valohai Key Features
- Comparative experiment view: Displays multiple runs side by side, letting you compare hyperparameters, metrics, and outputs across experiments in a single table.
- Pipeline builder: A visual editor for constructing multi-step ML pipelines, where each node maps to a versioned execution step.
- Cloud compute orchestration: Automatically provisions and terminates cloud instances across AWS, GCP, or Azure for each training run.
- Deployment triggers: Promotes trained models directly to a serving endpoint from within the same platform used for training.
Valohai Integrations
Valohai offers a small set of prebuilt integrations through its Ecosystem library, including connectors for Snowflake, BigQuery, and Redshift, a Hugging Face template, and integrations with Slurm and OVHcloud. It runs on AWS, GCP, Azure, and Oracle Cloud Infrastructure, and provides a REST API for building custom integrations.
Pros and Cons
Pros:
- Full lineage traces from model to dataset
- Runs on any cloud or on-prem hardware
- Logs metrics from printed JSON automatically
Cons:
- The main experiment view feels visually underwhelming
- Wrapping scripts into the Valohai format takes effort
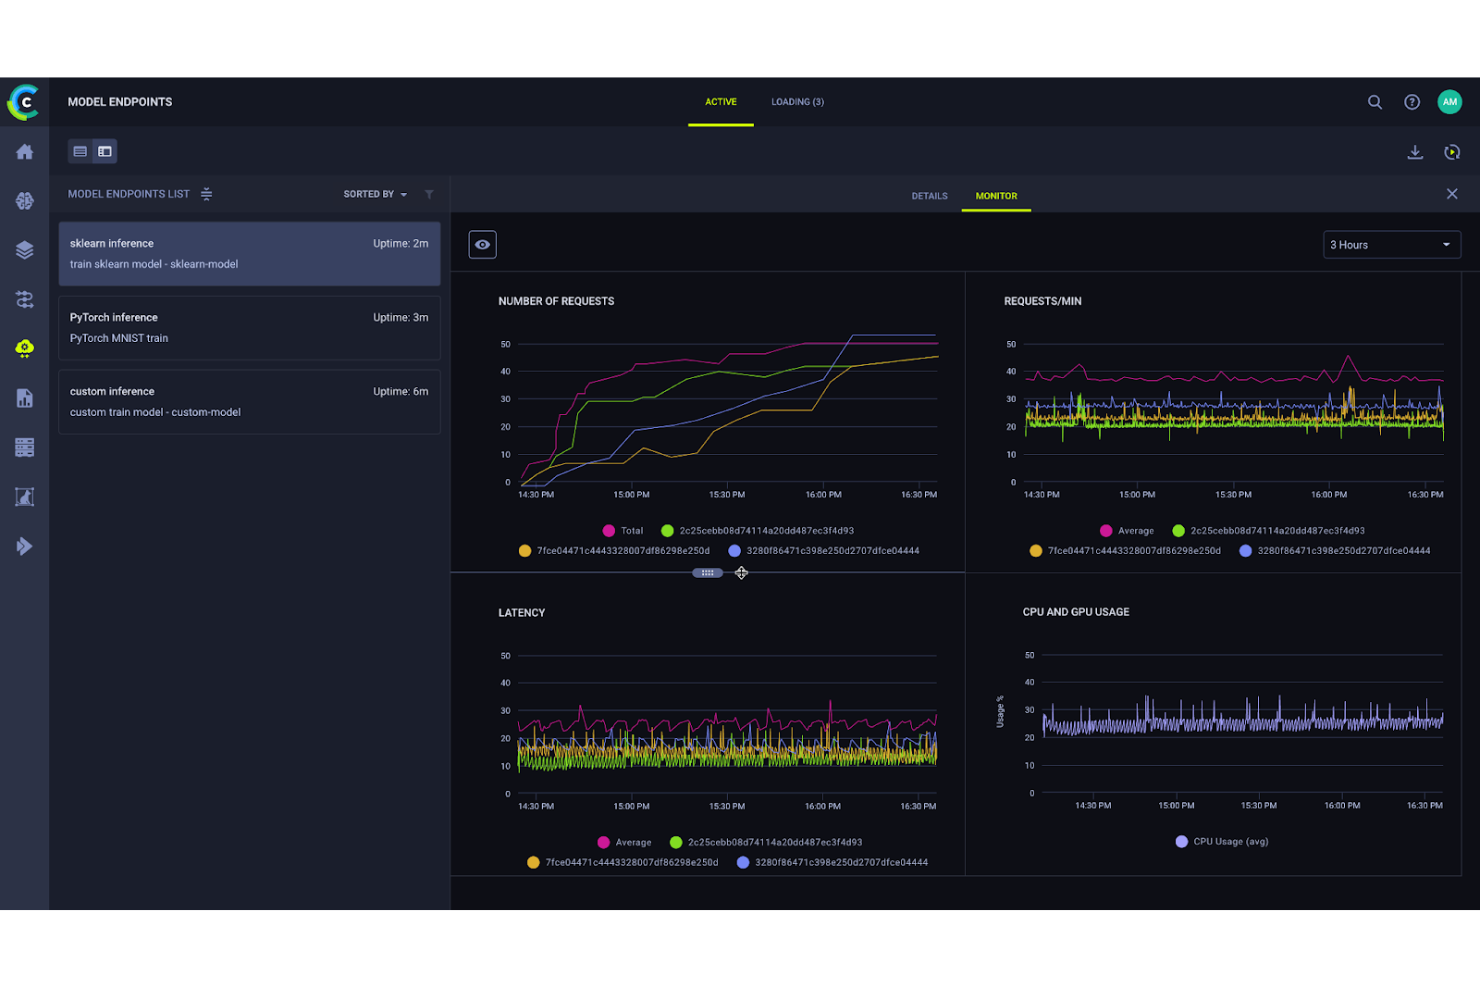
ClearML is an open-source MLOps platform that covers experiment tracking, dataset versioning, model management, and pipeline orchestration across the full machine learning lifecycle.
Who Is ClearML Best For?
ClearML is a strong fit for ML engineers and data scientists at organizations that self-host their MLOps infrastructure and need full control over their pipelines.
Why I Picked ClearML
ClearML earns its spot on my shortlist because its automatic pipeline orchestration is genuinely hands-off. When I add a job to a queue, ClearML containerizes it with its full environment and handles all scheduling and resource management automatically. I don't rewrite code to shift between on-prem, cloud, or HPC clusters. I also like that cached pipeline components let me skip redundant steps on re-runs, which cuts cycle time significantly on iterative training workflows.
ClearML Key Features
- Experiment auto-logging: Automatically captures metrics, hyperparameters, console output, and source code from every training run without added instrumentation.
- ClearML Data versioning: Version and manage datasets with full lineage tracking, linking each dataset version directly to the experiments that used it.
- Model registry: Store, label, and retrieve trained models with version control and stage tagging across the full development lifecycle.
- Hyperparameter optimization: Run automated HPO searches across experiments using built-in search strategies like Bayesian optimization and random search.
ClearML Integrations
ClearML offers native integrations with PyTorch, TensorFlow, Keras, Scikit-learn, XGBoost, Hugging Face Transformers, FastAI, Optuna, and Hydra, plus visualization tools like Matplotlib and TensorBoard. An API and Python SDK are available for custom integrations.
Pros and Cons
Pros:
- Modular design lets you adopt individual components
- Auto-logs code, datasets, and hyperparameters without instrumentation
- Self-hostable open-source server eliminates subscription costs
Cons:
- Navigation across modules feels disjointed at scale
- Documentation gaps slow onboarding for new users
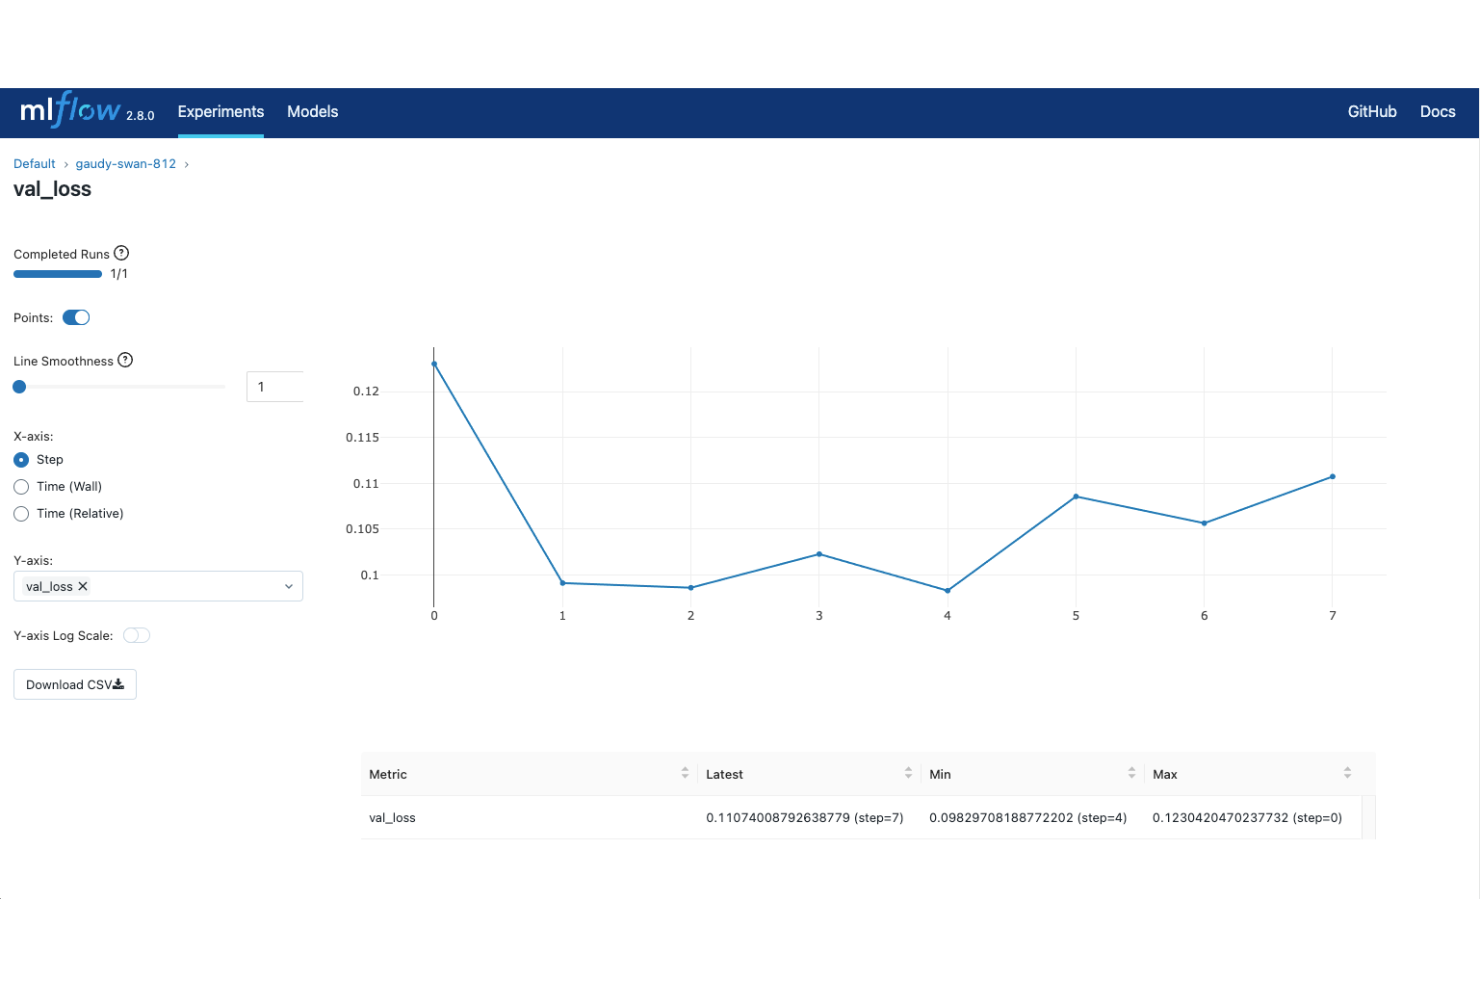
MLflow is an open-source ML experiment tracking platform that covers the full model lifecycle, from experiment logging and run comparison to model packaging, versioning, and deployment.
Who Is MLflow Best For?
MLflow is a natural fit for ML engineers and data scientists at organizations that self-host their tooling and want full control over their experiment tracking infrastructure without vendor lock-in.
Why I Picked MLflow
MLflow earns its spot on my shortlist because it covers the entire model lifecycle in one open-source framework. I use the MLflow Tracking API to log parameters, metrics, and artifacts across runs, then the Model Registry to version and transition models from development through production. What I really value is that I can package models using MLflow's standard format and deploy them to any target without rewriting serving code.
MLflow Key Features
- Autologging: Automatically captures parameters, metrics, and artifacts from supported libraries like Scikit-learn, XGBoost, and PyTorch without manual logging calls.
- Run comparison UI: Visualize and compare metrics across multiple training runs side by side in MLflow's built-in web interface.
- MLflow Projects: Packages ML code with its dependencies and entry points so any run can be reproduced exactly on any machine.
- Plugin system: Extends MLflow's tracking, storage, and deployment behavior through community-built plugins without modifying core code.
MLflow Integrations
MLflow offers 60+ built-in integrations including PyTorch, TensorFlow, Scikit-learn, XGBoost, LightGBM, Hugging Face Transformers, LangChain, LlamaIndex, and OpenAI. It also supports AWS SageMaker, Azure ML, Databricks, and OpenTelemetry. A REST API and Python SDK are available for custom integrations.
Pros and Cons
Pros:
- Self-hostable on any infrastructure
- Full model versioning with stage transitions
- Framework-agnostic logging across ML libraries
Cons:
- Limited built-in hardware profiling visualization
- Requires DevOps effort for production setup
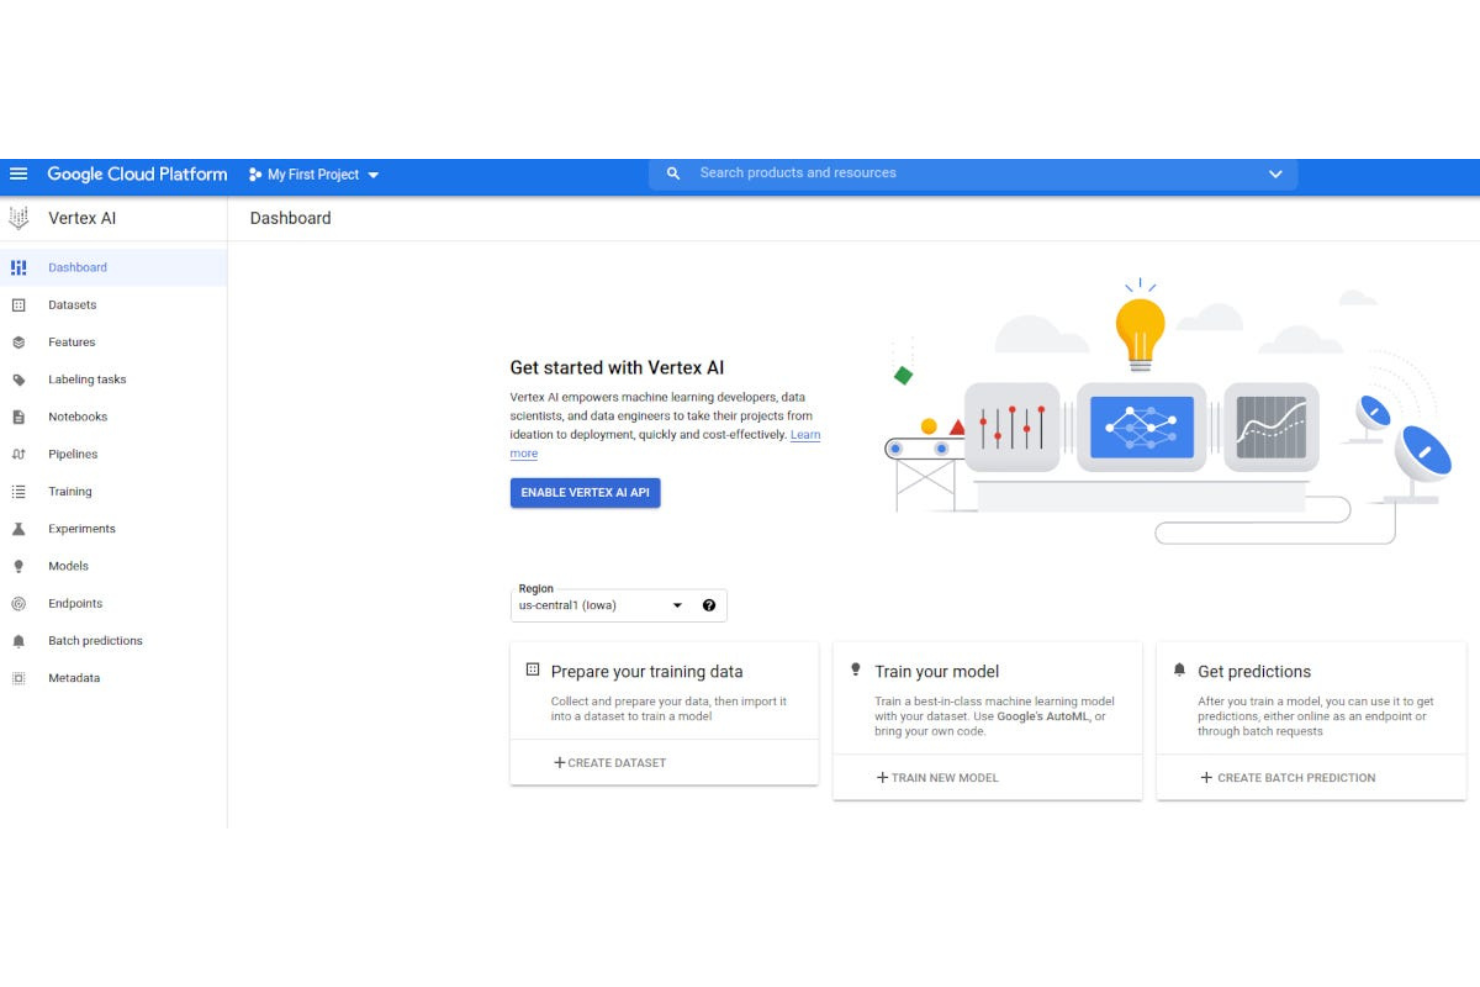
Built on Google Cloud, Vertex AI is a managed ML platform that covers experiment tracking, dataset versioning, model training, hyperparameter tuning, and model deployment within a unified environment.
Who Is Vertex AI Best For?
Vertex AI is a natural fit for ML engineering teams running workloads on Google Cloud Platform who need experiment tracking that stays within their existing GCP infrastructure.
Why I Picked Vertex AI
Vertex AI earns its spot on my shortlist because its experiment tracking connects natively to the rest of Google Cloud in ways that genuinely change how my team works. Vertex AI Experiments logs runs directly alongside Vertex AI Pipelines, so I can trace any model back to the exact pipeline run that produced it. I also use Vertex AI TensorBoard, which is fully managed within GCP, meaning there's no separate instance to spin up or maintain.
Vertex AI Key Features
- Vertex ML Metadata: Tracks artifacts, executions, and lineage across every ML workflow automatically.
- Vertex AI Model Registry: Version, stage, and manage trained models with full metadata attached to each entry.
- Vertex AI Workbench: Managed Jupyter notebook environment for running and iterating on training experiments directly in GCP.
- Vertex AI Vizier: A standalone hyperparameter tuning service that runs optimization jobs against any training workload.
Vertex AI Integrations
Vertex AI integrates natively across the Google Cloud ecosystem, including BigQuery, Cloud Storage, Dataflow, Pub/Sub, Cloud Functions, Artifact Registry, and Cloud Logging. It also connects with TensorFlow, PyTorch, scikit-learn, and XGBoost. An API is available for custom integrations, and it connects with Zapier.
Pros and Cons
Pros:
- Direct BigQuery access for training data
- Managed TensorBoard eliminates self-hosted setup
- Autologging captures metrics with one line
Cons:
- Complex pipeline debugging requires deep GCP knowledge
- Tightly coupled to the Google Cloud ecosystem
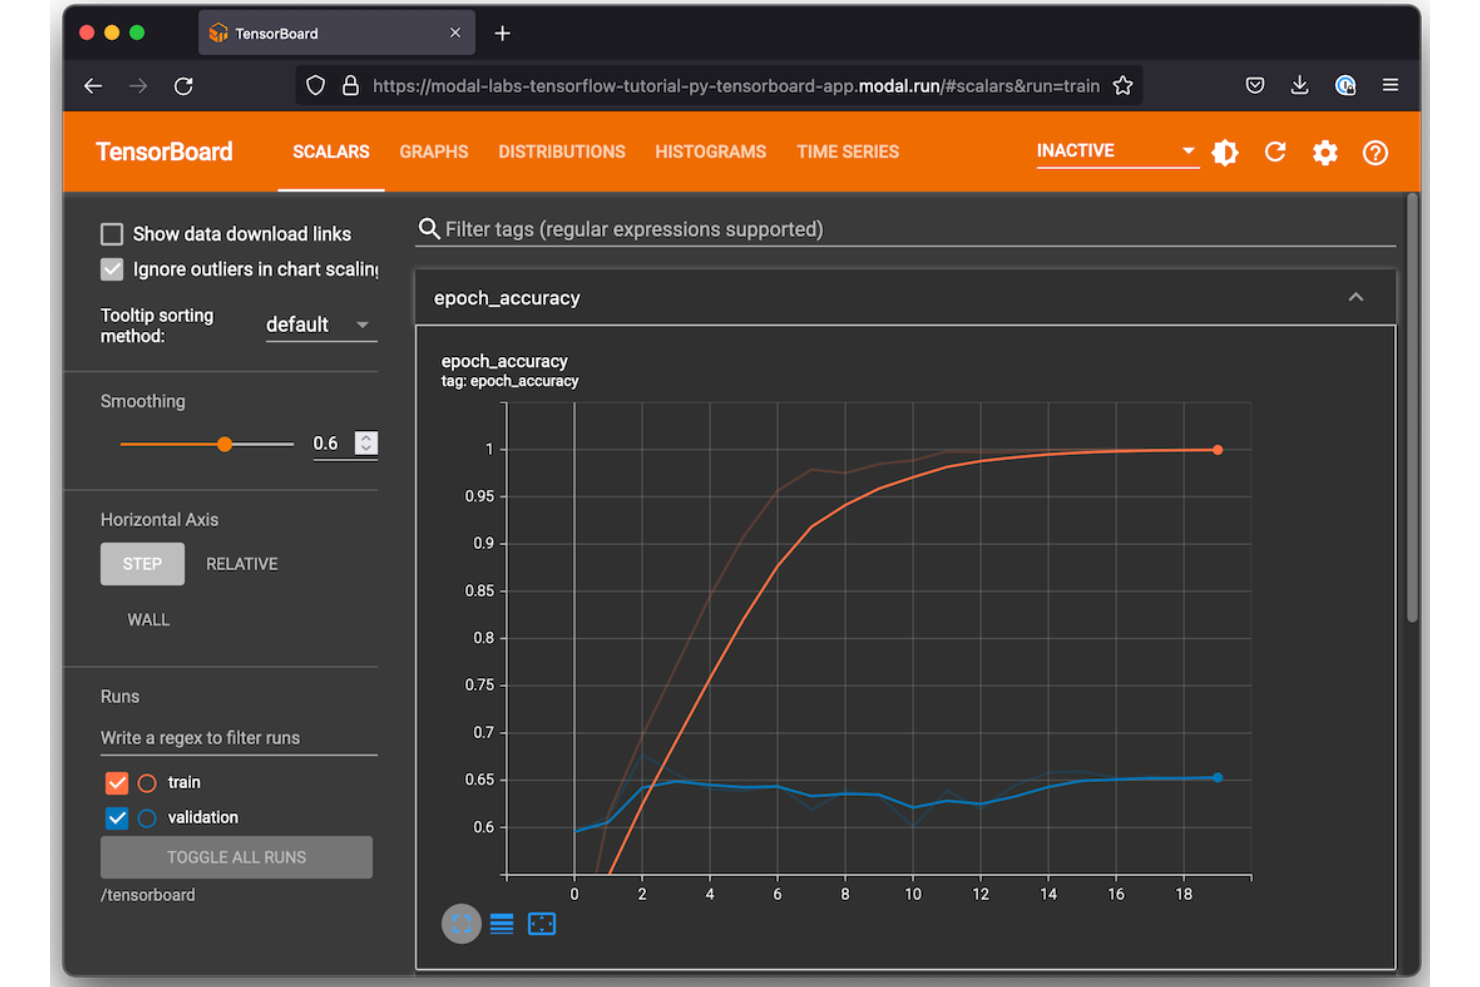
TensorFlow is an open-source machine learning framework from Google that covers model design, training, evaluation, and deployment across deep learning and neural network workflows.
Who Is TensorFlow Best For?
TensorFlow is a natural fit for research teams and ML engineers building and training deep learning models at scale, particularly in production environments.
Why I Picked TensorFlow
I've included TensorFlow in my top picks because its native Keras API lets me build and iterate on deep learning architectures without switching contexts or frameworks. I also rely on TensorBoard directly within TensorFlow to track training metrics, visualize computation graphs, and compare runs side by side. TensorFlow Hub gives me access to pre-trained models I can fine-tune, which cuts down significantly on training time for transfer learning experiments.
TensorFlow Key Features
- TensorFlow Extended (TFX): A production ML pipeline framework for orchestrating data validation, transformation, training, and model evaluation steps.
- tf.data API: Builds scalable input pipelines for loading, preprocessing, and batching datasets during model training runs.
- TensorFlow Serving: Deploys trained models to production via REST or gRPC endpoints without modifying model code.
- SavedModel format: Serializes trained models with full computation graphs and weights for reproducible reloading and sharing.
TensorFlow Integrations
TensorFlow is an open-source framework rather than a SaaS platform, so it doesn't offer traditional native integrations with third-party tools. Instead, its ecosystem includes built-in libraries like TensorBoard, TFX, TensorFlow.js, TensorFlow Serving, Keras, and ML Metadata that handle experiment tracking, pipeline orchestration, and model deployment within the framework itself. Third-party experiment tracking tools like MLflow and Weights & Biases provide their own integrations with TensorFlow, and a Python API is available for custom extensions.
Pros and Cons
Pros:
- Deploys across CPUs, GPUs, and TPUs
- Built-in hyperparameter tuning and optimization tools
- Real-time visualization of training metrics and graphs
Cons:
- Stores data locally without built-in collaboration
- TensorBoard slows down with many experiments
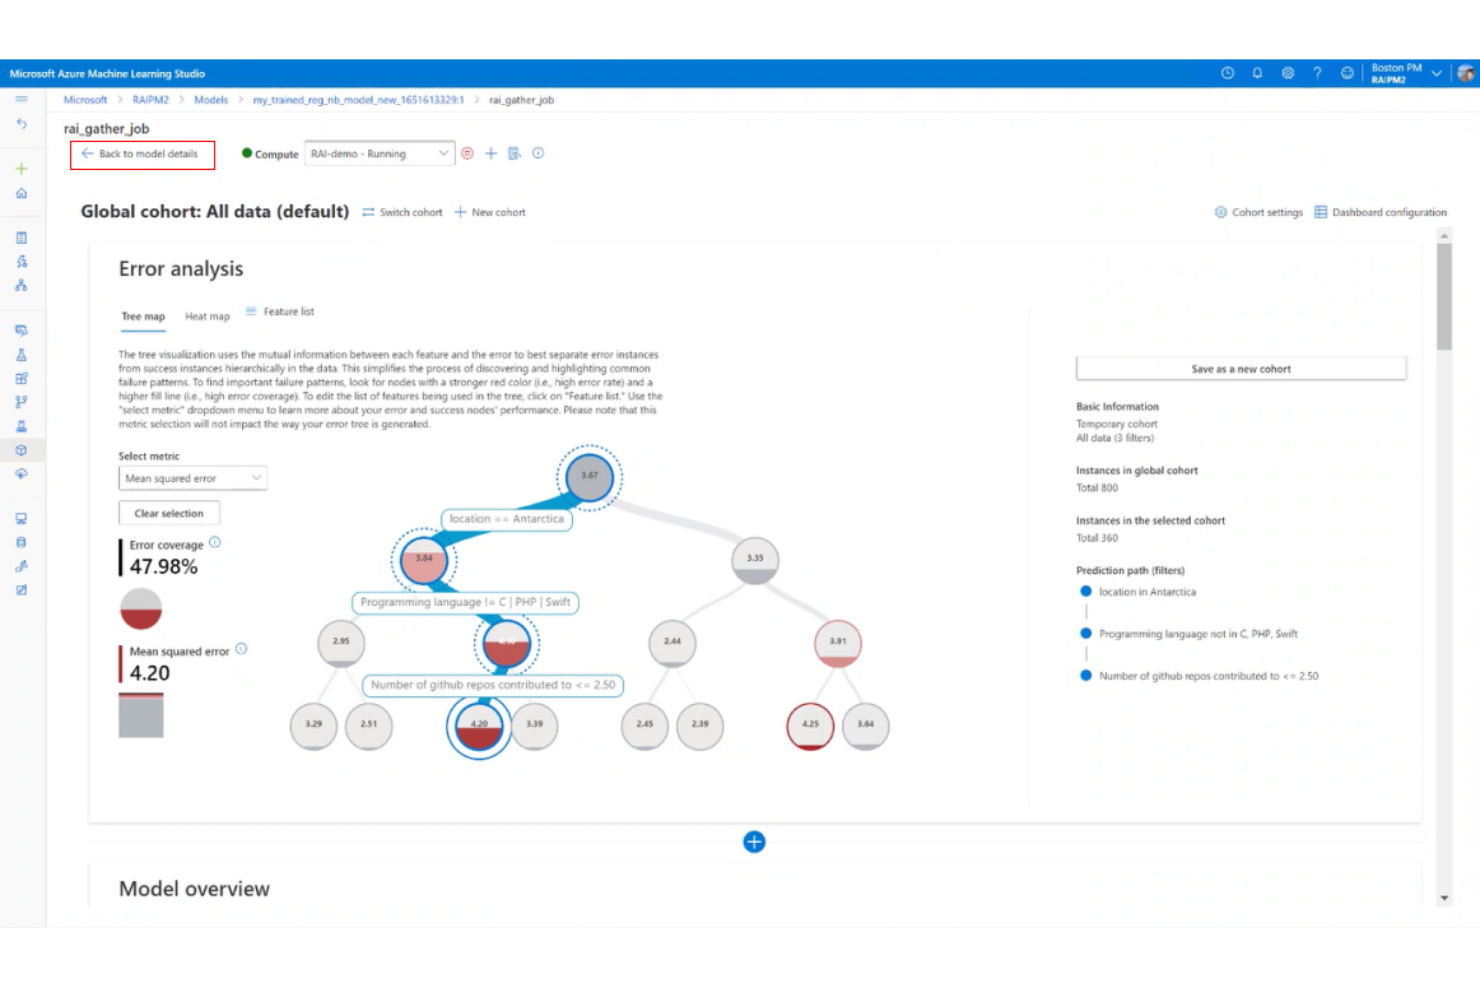
Azure Machine Learning is Microsoft's cloud-based ML platform covering experiment tracking, pipeline orchestration, automated ML, and a centralized model registry within the Azure ecosystem.
Who Is Azure Machine Learning Best For?
Azure Machine Learning is a strong fit for enterprise ML teams in regulated industries that need audit trails, role-based access controls, and compliance with standards like HIPAA or SOC 2.
Why I Picked Azure Machine Learning
I've included Azure Machine Learning in my top picks because its security controls go deeper than most ML platforms. My team can lock down experiment workspaces using Azure Role-Based Access Control, enforce private endpoints for network isolation, and tie every training run to a managed identity. I also rely on its built-in compliance coverage across HIPAA, ISO 27001, and SOC 2, which means audit documentation for experiment runs doesn't require extra tooling.
Azure Machine Learning Key Features
- MLflow-compatible experiment tracking: Log metrics, parameters, and artifacts using the MLflow API directly within Azure ML workspaces.
- Automated ML: Runs automated model selection and hyperparameter sweeps across multiple algorithms without manual configuration.
- Model registry: Stores versioned models with linked run metadata, making it easy to trace which experiment produced each registered model.
- Azure ML designer: A drag-and-drop pipeline canvas for building and visualizing multi-step training workflows without writing code.
Azure Machine Learning Integrations
Azure Machine Learning integrates natively across the Microsoft ecosystem, including Azure Synapse Analytics, Azure SQL Database, Azure Blob Storage, Azure Key Vault, Azure Arc, and Microsoft Purview. It also supports MLflow, Git, GitHub Actions, Azure DevOps, Azure Event Grid, and Apache Airflow for CI/CD and pipeline orchestration. An API and Python SDK are available for custom integrations.
Pros and Cons
Pros:
- Tracks experiments from local or multi-cloud environments
- Built-in concept and model drift monitoring
- MLflow-compatible workspaces without cloud-specific syntax
Cons:
- Slower adoption of newer MLflow 3.x features
- Many overlapping concepts slow initial team onboarding
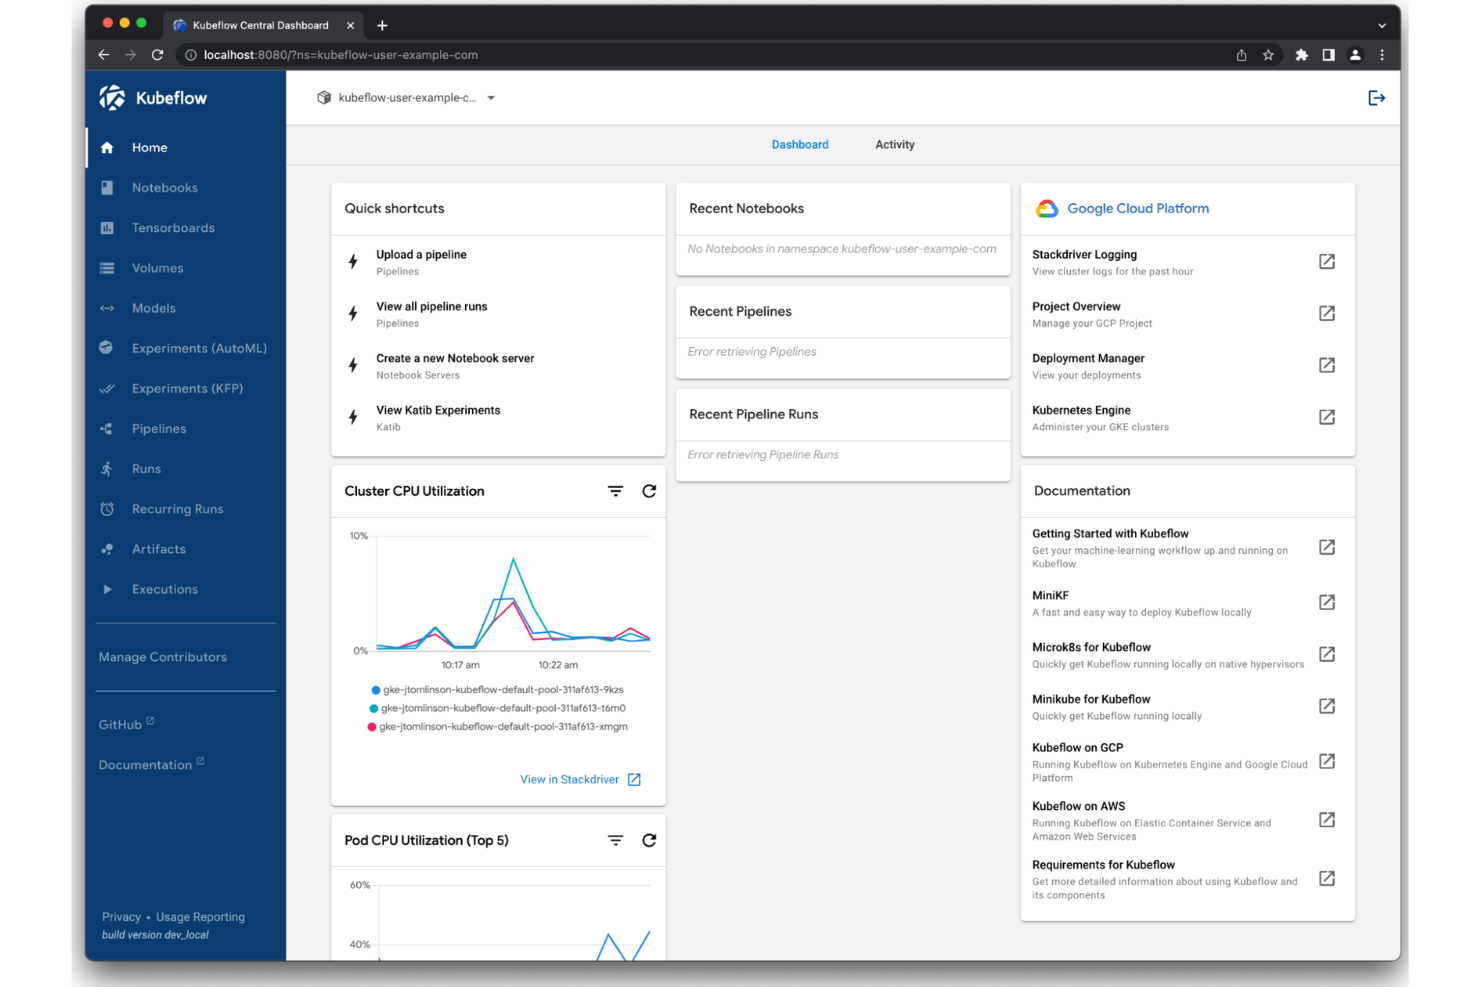
Kubeflow is an open-source ML platform built on Kubernetes that covers pipeline orchestration, experiment tracking, model training, and hyperparameter tuning natively within containerized infrastructure.
Who Is Kubeflow Best For?
Kubeflow is a natural fit for ML engineering teams that already run workloads on Kubernetes and want to keep their experiment tracking infrastructure on the same platform.
Why I Picked Kubeflow
Kubeflow earns its spot on my shortlist because it maps every pipeline step directly to a Kubernetes pod, giving experiment runs the same resource controls as any other cluster workload. I use Kubeflow Pipelines to version and replay training runs without stepping outside the Kubernetes environment. Its Katib component runs parallel hyperparameter tuning trials as native Kubernetes jobs, with no separate infrastructure required.
Kubeflow Key Features
- Multi-user namespace isolation: Separates experiments and pipelines by team or project using Kubernetes namespace-level access controls.
- Kubeflow Notebooks: Launches Jupyter notebook servers directly in the cluster, keeping data exploration within the same environment as training runs.
- Artifact lineage tracking: Records inputs, outputs, and metadata for each pipeline step, linking datasets and models back to specific runs.
- Training Operator: Manages distributed training jobs across frameworks like PyTorch, TensorFlow, and XGBoost as native Kubernetes custom resources.
Kubeflow Integrations
Kubeflow doesn't offer traditional native integrations; instead, it works within the Kubernetes ecosystem and supports ML frameworks like TensorFlow, PyTorch, JAX, XGBoost, HuggingFace, and Apache Spark through its subproject operators. You can also deploy it on managed Kubernetes services from AWS, Google Cloud, Microsoft Azure, and Red Hat OpenShift.
Pros and Cons
Pros:
- Parallel hyperparameter tuning via the Katib component
- Pipeline versioning tracks every training run
- Runs experiments directly on Kubernetes pods
Cons:
- UI feels dated compared to commercial alternatives
- Cluster setup demands deep Kubernetes expertise
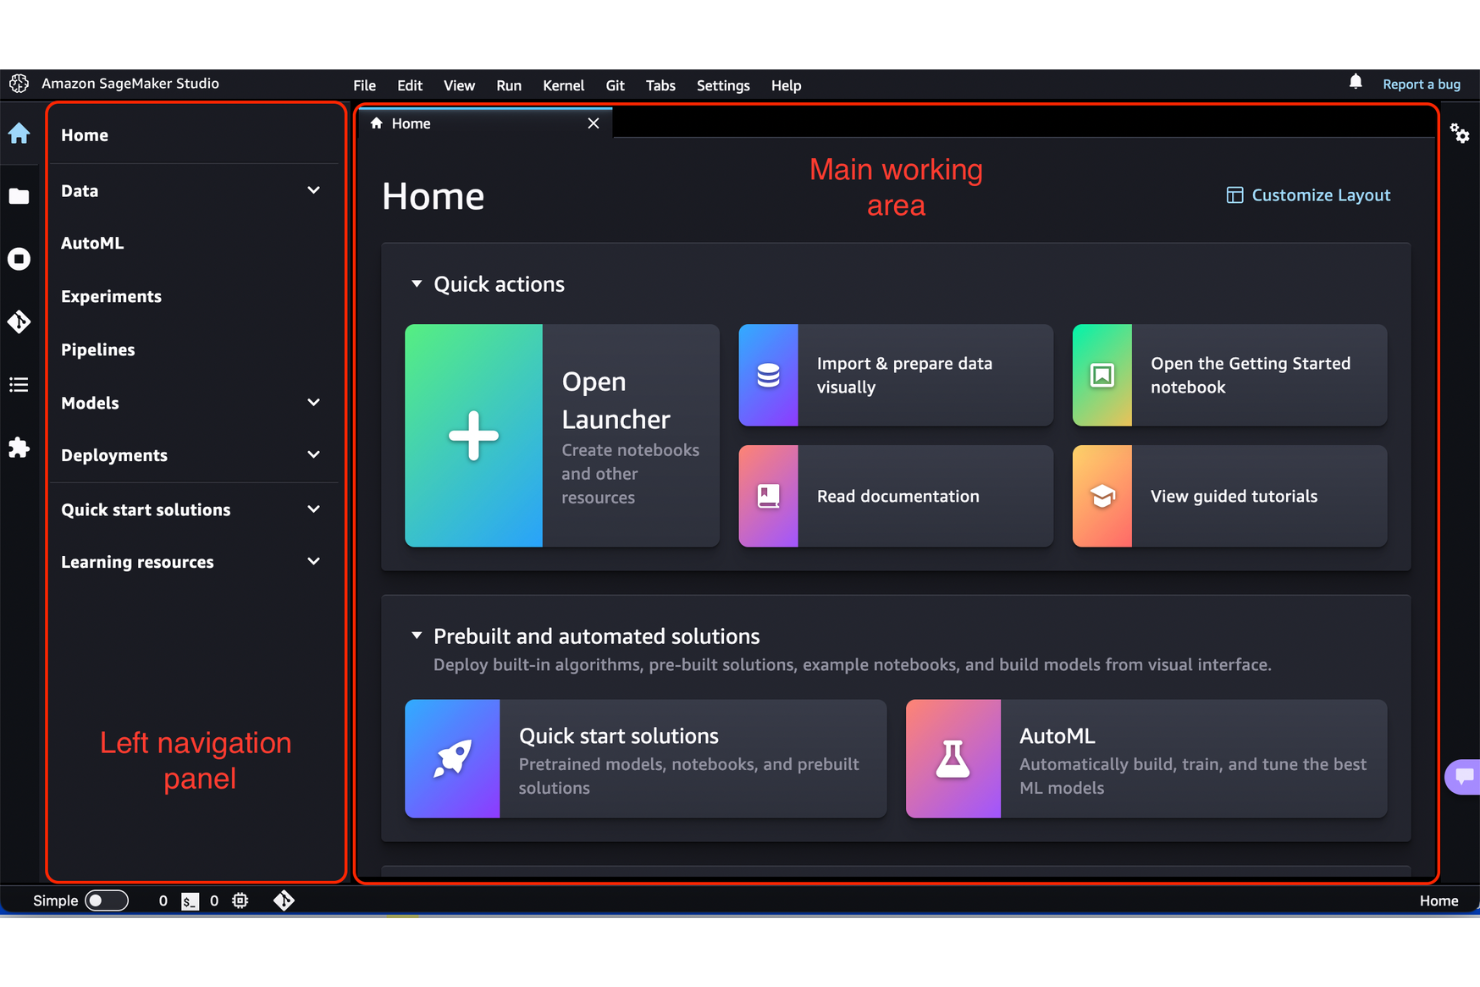
Amazon SageMaker is a fully managed ML platform on AWS that covers experiment tracking, model training, hyperparameter tuning, model registry, and deployment across the full machine learning lifecycle.
Who Is Amazon SageMaker Best For?
Amazon SageMaker is a natural fit for data science and ML engineering teams already running workloads on AWS infrastructure.
Why I Picked Amazon SageMaker
I've included Amazon SageMaker in my top picks because its experiment tracking is wired directly into the AWS ecosystem in ways that other tools can't replicate. SageMaker Experiments logs runs, parameters, and metrics natively alongside S3 artifact storage and IAM-controlled access, so there's no separate infrastructure to manage. My team also uses SageMaker Pipelines to chain training jobs, evaluations, and model registration into a single auditable workflow without leaving AWS.
Amazon SageMaker Key Features
- SageMaker model registry: Version, approve, and stage trained models with metadata tracking across the full model lifecycle.
- Automatic model tuning: Run hyperparameter optimization jobs using Bayesian, random, or grid search strategies at scale.
- SageMaker Debugger: Monitor training jobs in real time to detect issues like vanishing gradients or overfitting as they happen.
- SageMaker Feature Store: Store, share, and retrieve ML features across training and inference workloads from a centralized repository.
Amazon SageMaker Integrations
Amazon SageMaker integrates natively across the AWS ecosystem, including Amazon S3, Amazon Redshift, AWS Glue, Amazon EMR, Amazon Athena, Amazon ECR, AWS Lambda, Amazon CloudWatch, and MLflow. An API is available for custom integrations.
Pros and Cons
Pros:
- Built-in model monitoring alongside experiment logs
- Automatic checkpointing during long training jobs
- Tracks parameters, data, and code versions per run
Cons:
- Model artifacts use AWS-specific formats, limiting portability
- Unused resources can silently accumulate billing charges
Other ML Experiment Tracking Tools
Here are some additional ML experiment tracking tool options that didn’t make it onto my shortlist, but are still worth checking out:
- ZenML
For plugin architecture for extensibility
- Polyaxon
For hybrid and on-prem deployment options
- Databricks
For unified analytics workspace for teams
- Domino Data Lab
For central control in collaborative research
- iguazio
For real-time model monitoring at scale
- Dagster
For programmatic data pipeline authoring


How I Evaluate ML Experiment Tracking Tools
I split my evaluation into two layers: what every tool must do (like auto-logging PyTorch runs) and what separates the best tools.
Core Functionality (Table Stakes For This List)
When I'm selecting tools for my list, I rank each one on a scale from 0 (does not offer the functionality) to 5 (excels in this area) for each core functionality listed below. Then, I calculate the tool's total score as a percentage. Each tool needs to achieve a minimum total score of 65% to be considered for inclusion.
- Experiment logging: I check whether the tool auto-captures metrics, hyperparameters, and system-level telemetry from training runs or requires manual SDK instrumentation for every data point.
- Run comparison and visualization: Side-by-side run tables are a starting point, but I look for interactive charts like parallel coordinate plots that help spot patterns across dozens of runs in your ML projects.
- Artifact and model versioning: I evaluate how each tool versions datasets, model checkpoints, and outputs, including whether it links artifacts back to the exact run that produced them.
- ML framework support: The tool should cover frameworks your team actually uses, from PyTorch and TensorFlow to Hugging Face Transformers and XGBoost, with minimal wrapper code.
- Reproducibility and lineage: I look for tools that capture code commits, dependency snapshots, and dataset state together so you can re-run an experiment from six months ago and get the same result.
- Collaboration and sharing: Teams working across time zones need shared workspaces, role-based access, and the ability to comment on or share specific runs without exporting CSVs back and forth.
Once I have a list of tools that meet these criteria, I consider what sets each platform apart.
Differentiating Factors (What Sets Vendors Apart)
Here's how I compare and contrast different vendors:
Standout Features
Hyperparameter optimization is a key differentiator. I look for built-in sweep functionality that automates search across distributed runs and visualizes performance across configurations in one view. Live resource monitoring adds real value too—when you can track GPU and memory utilization mid-training, you catch bottlenecks before a run wastes hours of compute. Collaborative reporting rounds things out for larger teams, where shareable dashboards replace manual spreadsheets and allow data scientists to discuss results with stakeholders without switching tools.
Beyond Features
Deployment flexibility matters more than many teams expect. I evaluate whether a tool supports self-hosted or air-gapped setups for teams working with sensitive IP or regulated data. Scalability is another factor I check—logging thousands of concurrent runs shouldn't degrade query performance or create unpredictable cost spikes. Onboarding experience also sets tools apart, where strong quick-start docs and active community forums mean your team instruments training scripts in hours, not weeks.
How to Choose ML Experiment Tracking Tools
It’s easy to get bogged down in long feature lists and complex pricing structures. To help you stay focused as you work through your unique software selection process, here’s a checklist of factors to keep in mind:
| Factor | What to Consider |
|---|---|
| Scalability | Can the tool handle the volume and frequency of experiments you expect as your team and data grow? |
| Integrations | Will it connect directly with your preferred ML frameworks, orchestration tools, and deployment systems? |
| Customizability | Can you adapt metadata fields, workflow steps, and reporting to fit your team’s unique requirements? |
| Ease of use | Will your researchers and engineers find the interface intuitive, or is there a steep learning curve? |
| Implementation and onboarding | How quickly can you go from purchase to tracking your first experiment? What resources are required to set up? |
| Cost | Are usage-based pricing, storage fees, or required add-ons clear and predictable for your projected needs? |
| Security safeguards | Does the tool support encryption, granular permissions, and authentication to protect sensitive data? |
| Compliance requirements | Will the tool help you meet industry, customer, or geographic regulations (SOC 2, ISO 27001, GDPR)? |
What Are ML Experiment Tracking Tools?
ML experiment tracking tools are software platforms that log, organize, and version machine learning model experiments, including their parameters, code, datasets, and metrics. These tools help your team store experiment history, compare results, and fully reproduce past runs, making collaboration and auditing easier as project workflows become more complex.
Features of ML Experiment Tracking Tools
When selecting ML experiment tracking tools, keep an eye out for the following key features:
- Experiment logging: Records every training run’s parameters, configurations, source code references, and metrics to preserve a clear audit trail.
- Run comparison: Lets you view and analyze multiple experiments side by side to understand how different settings or changes affect your results.
- Artifact versioning: Automatically versions datasets, versioned ML models, and other outputs so you can always reproduce or build on past work.
- Framework integrations: Connects directly with popular ML frameworks, making it easy to start tracking with minimal changes to your workflow.
- Lineage tracking: Maps the full chain from raw data to final model, supporting reproducibility and regulatory compliance requirements.
- Collaboration tools: Allows multiple users to comment, document insights, and share results across your team.
- Custom metadata: Lets you add project-specific fields or tags, so you can categorize experiments however your workflow demands.
- Role-based access control: Restricts access to sensitive data and actions, supporting organization-level governance and security standards.
- Dashboards and visualizations: Generates customizable reports and data visualizations to quickly highlight trends and anomalies in your experiment data.
- Search and filtering: Lets your team easily find relevant experiments, runs, and artifacts by parameter, date, or other criteria, saving time as your project grows.
Common ML Experiment Tracking Tools AI Features
Beyond the standard ML experiment tracking tools features listed above, many of these solutions are incorporating AI with features like:
- Automated anomaly detection: Uses AI to monitor experiment metrics and flag unusual patterns or outliers, helping teams catch data drift or unexpected model behavior early.
- Intelligent hyperparameter suggestions: Applies machine learning to recommend optimal hyperparameter values based on historical experiment data, reducing manual guesswork and speeding up model tuning.
- Natural language experiment queries: Lets users search and filter experiments using conversational language, making it easier for non-technical stakeholders to access and understand experiment results.
- Predictive resource allocation: Uses AI to forecast compute and memory needs for upcoming runs, helping teams plan resources and avoid bottlenecks.
- Automated experiment summarization: Leverages AI to generate concise summaries of experiment outcomes, highlighting key findings and trends for faster reporting and decision-making.
Benefits of ML Experiment Tracking Tools
Implementing ML experiment tracking tools provides several benefits for your team and your business. Here are a few you can look forward to:
- Experiment reproducibility: Track parameters, datasets, and environment details to easily recreate and validate prior experiments.
- Streamlined collaboration: Shared dashboards, commenting, and project documentation help teams work together and communicate results effectively.
- Faster model development: Side-by-side run comparisons and automated artifact versioning speed up experiment cycles and decision-making.
- Centralized knowledge management: All project history and experiment metadata are stored in one place, preserving institutional knowledge as teams grow.
- Improved compliance and auditability: Built-in lineage tracking and audit logs support regulatory needs and enterprise governance standards.
- Resource cost control: Live resource monitoring and predictive allocation features allow teams to optimize hardware usage and prevent unnecessary spending.
- Customizable workflow support: Flexible metadata fields and workflow options adapt to your team’s existing processes and preferences.
Costs and Pricing of ML Experiment Tracking Tools
Selecting ML experiment tracking tools requires an understanding of the various pricing models and plans available. Costs vary based on features, team size, add-ons, and more. The table below summarizes common plans, their average prices, and typical features included in ML experiment tracking tools solutions:
Plan Comparison Table for ML Experiment Tracking Tools
| Plan Type | Average Price | Common Features |
|---|---|---|
| Free Plan | $0 | Basic experiment tracking, limited users, community support, and public projects. |
| Personal Plan | $5-$25/user/month | Unlimited experiments, increased storage, private projects, and basic integrations. |
| Business Plan | $30-$70/user/month | Team collaboration tools, role-based access, advanced integrations, enhanced security, and audit logs. |
| Enterprise Plan | $80-$150/user/month | Custom deployment options, SSO/SAML, compliance tools, premium support, and advanced customization. |
ML Experiment Tracking Tools FAQs
Here are some answers to common questions about ML experiment tracking tools:
Do these tools require a lot of setup or code changes?
No, most tools offer lightweight SDKs or plugins that let you start logging experiments with minimal code changes. You can often integrate tracking into your scripts in just a few lines.
How do these tools help with team compliance and audits?
They log every run’s parameters, code, and results, create traceable experiment histories, and maintain audit trails—making it easier to document compliance and share evidence during reviews or audits.
Will these solutions work with Jupyter notebooks?
Yes, most ML experiment tracking tools are designed to work directly in Jupyter notebooks, as well as with scripts and pipelines, so you don’t have to change your workflow.
What happens if my team outgrows the free plan?
You can upgrade to a paid tier for more users, higher storage limits, advanced integrations, and enterprise features. Review pricing closely so you’re not surprised by the transition.
Can I store sensitive or proprietary data with these tools?
Yes, but you should review the vendor’s security safeguards like encryption, access controls, and compliance certifications to ensure your data remains protected. On-premise or private cloud options can offer even more control.