Best Hardware Monitoring Software Shortlist
Here’s my shortlist of the best hardware monitoring software:
The best hardware monitoring software helps IT teams track system health, detect failures early, and optimize performance across servers, desktops, and other devices. By collecting real-time data on temperature, CPU usage, disk activity, and memory consumption, these tools reduce downtime and make it easier to keep infrastructure running reliably.
Many teams start looking for hardware monitoring solutions after dealing with vague error messages during outages, juggling disconnected tools that don’t provide a unified view, or wasting hours manually checking system performance logs. These challenges slow down troubleshooting and increase the risk of unexpected downtime.
I’ve tested monitoring platforms in live production environments, worked with teams managing both legacy and modern hardware, and evaluated how these tools integrate with broader IT management systems. Those experiences showed me which products deliver meaningful alerts and which overwhelm teams with noise.
In this guide, you’ll see which hardware monitoring software stands out for providing accurate insights, reducing manual oversight, and helping your team maintain stable and efficient systems.
Why Trust Our Software Reviews
We’ve been testing and reviewing SaaS development software since 2023. As tech experts ourselves, we know how critical and difficult it is to make the right decision when selecting software. We invest in deep research to help our audience make better software purchasing decisions.
We’ve tested more than 2,000 tools for different SaaS development use cases and written over 1,000 comprehensive software reviews. Learn how we stay transparent & check out our software review methodology.
Best Hardware Monitoring Software Summary
This comparison chart summarizes pricing details for my top hardware monitoring software selections to help you find the best one for your budget and business needs.
| Tool | Best For | Trial Info | Price | ||
|---|---|---|---|---|---|
| 1 | Best for dynamic scaling | Free plan + 30-day free trial available | From $225/month (billed annually) | Website | |
| 2 | Best for complex infrastructure monitoring | Free plan available | Pricing upon request | Website | |
| 3 | Best for remote teams | Free demo + 30-day free trial available | From $9/month (billed annually) | Website | |
| 4 | Best for small businesses | Free demo available | From $245/25 devices | Website | |
| 5 | Best for open-source solutions | Free, open-source | Free to use | Website | |
| 6 | Best for data analytics | 60-day free trial | Pricing upon request | Website | |
| 7 | Best for mainframe environments | Not available | Pricing upon request | Website | |
| 8 | Best for real-time metrics | 14-day free trial | Pricing upon request | Website | |
| 9 | Best for cloud cost management | Not available | Pricing upon request | Website | |
| 10 | Best for IBM systems | 30-day free trial | Pricing upon request | Website |
-

Site24x7
Visit WebsiteThis is an aggregated rating for this tool including ratings from Crozdesk users and ratings from other sites.4.6 -

GitHub Actions
Visit WebsiteThis is an aggregated rating for this tool including ratings from Crozdesk users and ratings from other sites.4.8 -

Docker
Visit WebsiteThis is an aggregated rating for this tool including ratings from Crozdesk users and ratings from other sites.4.6
Best Hardware Monitoring Software Reviews
Below are my detailed summaries of the best hardware monitoring software that made it onto my shortlist. My reviews offer a detailed look at the key features, pros & cons, integrations, and ideal use cases of each tool to help you find the best one for you.
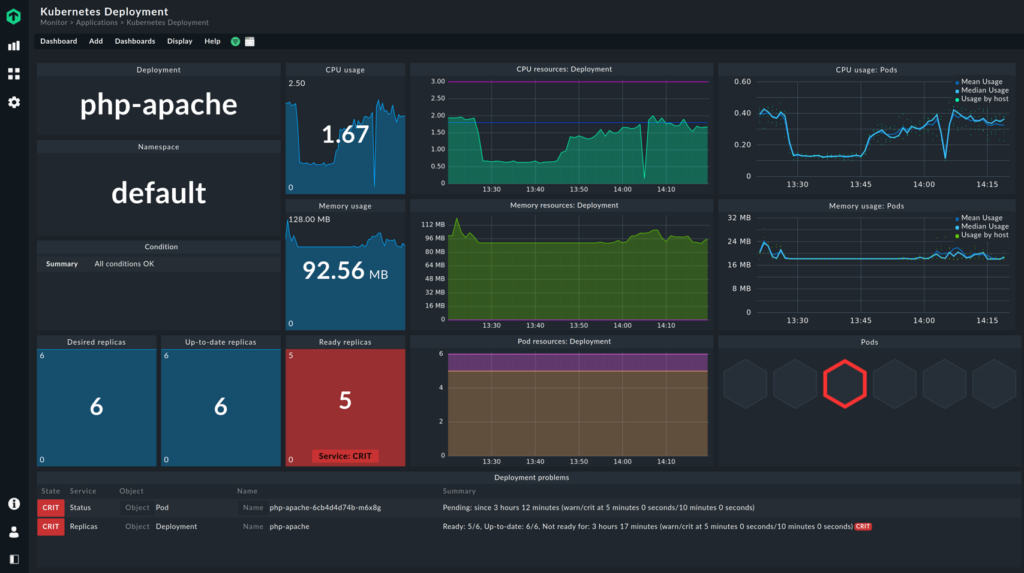
Checkmk is a versatile IT monitoring platform designed for IT professionals and businesses needing comprehensive infrastructure oversight. It excels in monitoring servers, networks, and cloud services, providing essential tools for maintaining system health.
Why I picked Checkmk: This tool offers dynamic scaling, making it suitable for growing IT environments. It features automated workload registration and customizable dashboards, giving you control over what matters most. You’ll benefit from its advanced alert systems that keep you informed of potential issues. Checkmk’s scalable architecture ensures it can grow with your needs, making it a reliable choice for expanding operations.
Standout features & integrations:
Features include over 2,000 monitoring plugins that cover a wide array of IT assets. The platform’s smart alerts help you stay ahead of issues before they escalate. You’ll find its dynamic dashboards useful for customizing your monitoring experience.
Integrations include Nagios, Prometheus, Grafana, Slack, PagerDuty, ServiceNow, Jira, AWS, Google Cloud, and Azure.
Pros and Cons
Pros:
- Strong community support
- Automated workload registration
- Dynamic scaling capabilities
Cons:
- No native Windows support
- Requires Linux-based system
Icinga is an open-source monitoring solution designed for complex IT infrastructures. It offers a range of features that help you keep an eye on your entire IT environment, ensuring everything runs smoothly.
Why I Picked Icinga: I picked Icinga for hardware monitoring because it provides extensive infrastructure monitoring capabilities. It allows you to monitor servers, networks, and applications, which means you can keep track of essential hardware components like CPU, memory, and disk usage. Additionally, Icinga's automation features help you manage monitoring tasks, so your team can focus on more strategic activities. Icinga also offers robust notification features that ensure you and your team are always aware of any issues as they arise. This way, you can address hardware problems before they escalate, minimizing downtime and maintaining system performance. Plus, with its cloud monitoring capabilities, Icinga supports hybrid environments, offering flexibility for businesses of all sizes.
Standout features & integrations:
Features include monitoring automation, which allows you to automate repetitive monitoring tasks, saving time and reducing human error. Another feature is its scalability, enabling you to monitor large and complex infrastructures without compromising performance. Additionally, Icinga's analytics and metrics capabilities provide you with valuable insights into your hardware's health and performance, helping you make informed decisions.
Integrations include Grafana, Graphite, InfluxDB, Elastic, Graylog, Azure, PagerDuty, VictorOps, OpsGenie, ServiceNow, Puppet, and Ansible.
Pros and Cons
Pros:
- Provides customizable alert configurations
- Integrates with Grafana and Ansible
- Supports agent-based hardware monitoring
Cons:
- Requires plugins for extended functionality
- Complex setup and configuration process
New Product Updates from Icinga
Icinga Introduces Contacts/Groups API
Icinga introduces the Contacts and Contact Groups REST API, enabling automated management of notification users and groups while keeping contact data consistent and synchronized across systems. For more information, visit Icinga's official site.
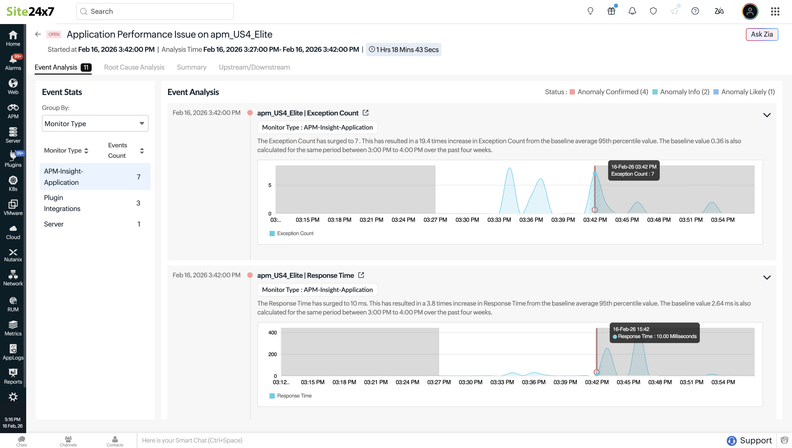
Site24x7 is a cloud-based hardware monitoring solution tailored for IT teams and businesses needing real-time insights into their infrastructure. It excels in providing SNMP monitoring, network device visibility, and VMware hardware component tracking.
Why I picked Site24x7: It’s ideal for remote teams due to its comprehensive network monitoring and cloud-based accessibility. The tool supports over 11,000 SNMP-enabled devices from 450+ vendors, making it versatile for diverse setups. You can automate incident remediation, which is crucial for teams spread across different locations. The customizable dashboards allow each team member to focus on relevant data.
Standout features & integrations:
Features include SNMP monitoring that gives your team detailed insights into network devices. The platform’s network monitoring covers a wide range of devices, making it suitable for complex infrastructures. You’ll also appreciate the VMware hardware component tracking for virtual environments.
Integrations include Slack, Microsoft Teams, ServiceNow, Jira, PagerDuty, Zapier, Amazon Web Services, Google Workspace, Zendesk, and Freshdesk.
Pros and Cons
Pros:
- Supports many SNMP-enabled devices
- Customizable dashboards
- Cloud-based accessibility
Cons:
- Limited offline capabilities
- Some features need configuration
New Product Updates from Site24x7
Site24x7 Enhances Monitoring with AI-Powered Features
Site24x7 introduces new AI-powered capabilities to improve monitoring and troubleshooting. These updates help teams identify issues faster and gain insights more efficiently across their systems. For more information, visit Site24x7’s official site.
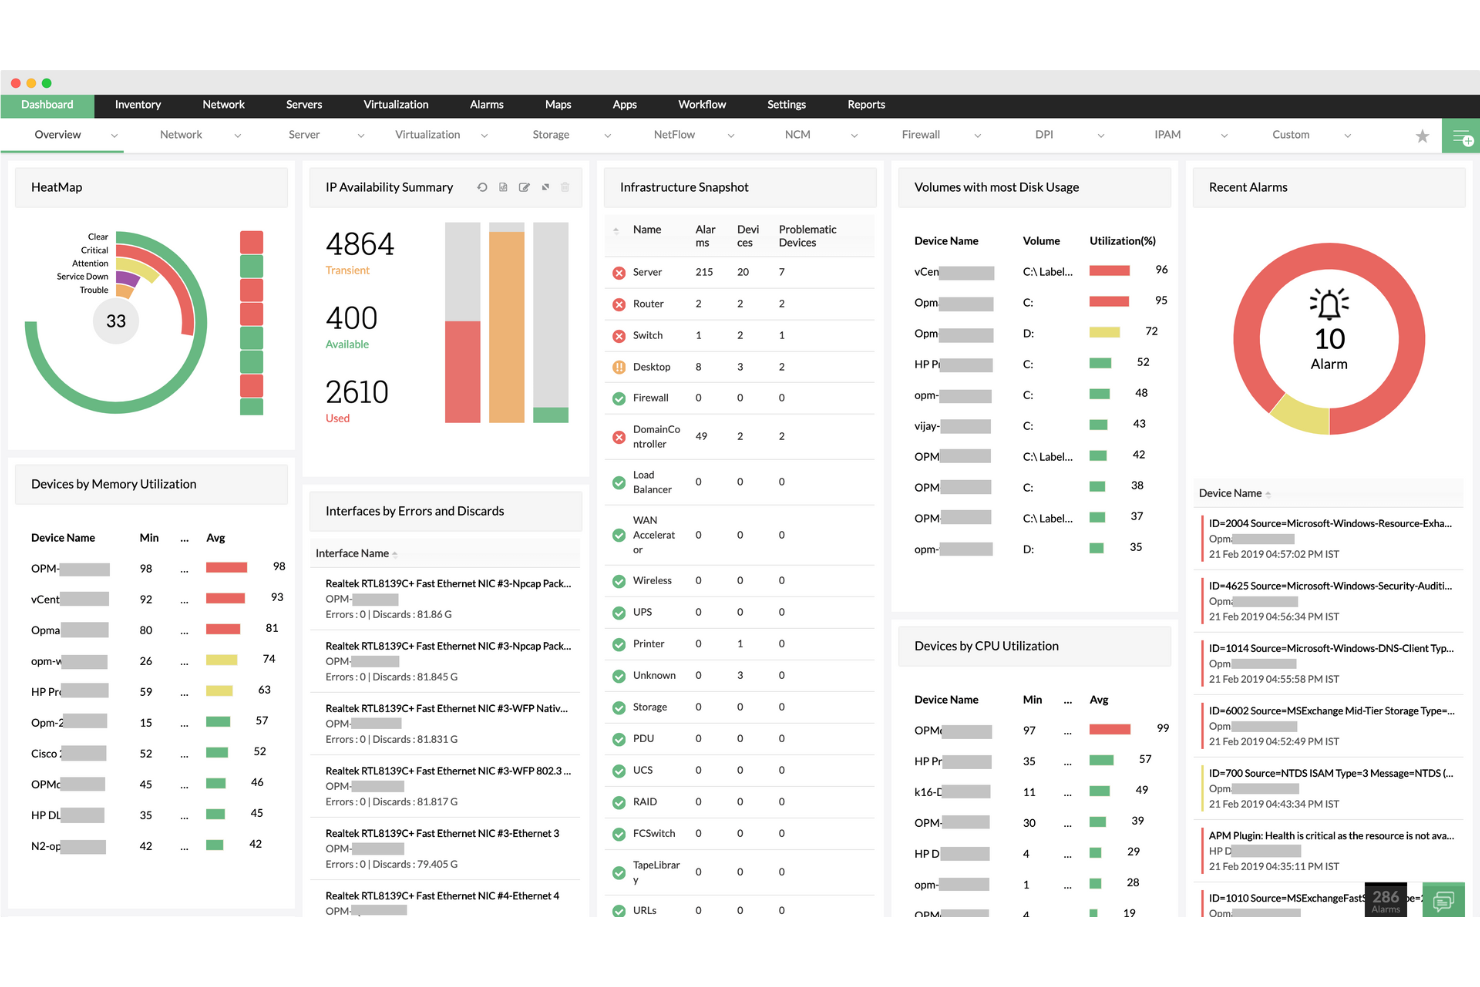
ManageEngine OpManager is a network monitoring tool designed for IT teams in small to medium-sized businesses. It helps monitor network performance, manage bandwidth, and ensure network devices operate efficiently.
Why I picked ManageEngine OpManager: It's tailored for small businesses with its user-friendly interface and straightforward setup. The tool offers real-time network monitoring, which is crucial for businesses needing immediate insights. You can track bandwidth usage to optimize network performance. Its customizable alerts keep your team informed about network status changes.
Standout features & integrations:
Features include advanced network mapping that helps visualize your entire network. The tool’s bandwidth monitoring lets you see which applications consume the most resources. You’ll also find its fault management capabilities useful for quickly identifying and resolving issues.
Integrations include ServiceNow, Jira, Slack, Microsoft Teams, PagerDuty, Zendesk, Spiceworks, Zoho CRM, Freshdesk, and ConnectWise.
Pros and Cons
Pros:
- Advanced network mapping
- Customizable alert options
- Real-time monitoring capabilities
Cons:
- May need additional configuration
- Requires technical knowledge to maximize use
New Product Updates from ManageEngine OpManager
ManageEngine OpManager Vendor Templates and NCM XML Import
ManageEngine OpManager introduces enhanced vendor template integration and device template import for the NCM module using XML files. This update helps teams improve device classification and speed up configuration workflows. For more information, visit ManageEngine OpManager’s official site.
Zabbix is an open-source monitoring software designed for IT infrastructure monitoring. It caters to IT teams and businesses looking to track performance and availability of servers, networks, and applications.
Why I picked Zabbix: It’s an open-source solution, offering flexibility and customization for various environments. With its agentless monitoring, you can monitor devices without installing additional software. The tool provides a centralized view of your entire IT infrastructure, which is essential for comprehensive oversight. Its alerting system ensures your team is aware of any critical issues immediately.
Standout features & integrations:
Features include a customizable dashboard that lets you tailor the interface to your needs. The tool offers distributed monitoring, which is ideal for large-scale environments. You’ll find its trend prediction capabilities useful for proactive infrastructure management.
Integrations include VMware, Docker, Kubernetes, AWS, Azure, Google Cloud, MySQL, PostgreSQL, Oracle, and IBM DB2.
Pros and Cons
Pros:
- Customizable dashboard options
- Centralized infrastructure view
- Agentless monitoring capabilities
Cons:
- Requires technical expertise
- Complex setup process
Splunk Enterprise is a data analytics platform geared towards IT and business professionals who need to harness machine data. It helps in searching, monitoring, and analyzing big data generated by machines for valuable insights.
Why I picked Splunk Enterprise: It excels in data analytics, offering powerful search capabilities and customizable dashboards. The tool allows you to explore large datasets efficiently, which is crucial for data-driven decision-making. You can create visualizations that simplify complex data, making it easier for your team to interpret. Its alerting system ensures you’re notified of critical changes in your data environment.
Standout features & integrations:
Features include real-time data processing that allows you to act on insights as they happen. The platform supports complex queries to help you dig deeper into your data. You’ll appreciate its machine learning toolkit for predictive analytics.
Integrations include AWS, Microsoft Azure, Google Cloud Platform, ServiceNow, Jira, Slack, Salesforce, Okta, GitHub, and Docker.
Pros and Cons
Pros:
- Real-time data processing
- Strong data visualization tools
- Efficient large dataset handling
Cons:
- Requires technical expertise
- Resource-intensive setup
CA Sysview Performance Management is a monitoring solution tailored for mainframe environments, designed to assist IT professionals in optimizing system performance. It provides real-time insights and control over mainframe operations, ensuring efficient resource management.
Why I picked CA Sysview Performance Management: It excels in mainframe environments with its real-time performance monitoring and control capabilities. The tool allows you to analyze system performance metrics comprehensively. You can automate routine checks to maintain optimal performance without constant manual oversight. Its detailed reporting features help you understand system behavior and plan for future needs.
Standout features & integrations:
Features include real-time monitoring that provides instant insights into system performance. The tool offers automated threshold management, which helps prevent performance issues. You’ll also appreciate its comprehensive reporting capabilities for detailed analysis.
Integrations include IBM Z, CA ACF2, CA Top Secret, CA OPS/MVS, CA NetMaster, CA Workload Automation, CA Mainframe Application Tuner, IBM Db2, IBM MQ, and CA Repository.
Pros and Cons
Pros:
- Automated threshold management
- Tailored for mainframe environments
- Real-time performance insights
Cons:
- Requires mainframe expertise
- High initial setup complexity
Splunk Infrastructure Monitoring is a cloud-based tool designed for IT professionals who need continuous monitoring of their infrastructure. It provides real-time metrics and analytics to help teams maintain optimal performance and quickly address any issues.
Why I picked Splunk Infrastructure Monitoring: It offers real-time metrics, which are crucial for maintaining infrastructure health. The tool features high-resolution monitoring, allowing you to track even the smallest changes in your environment. You can set up dynamic alerts to get notified of potential issues instantly. Its scalability supports growing infrastructures, making it a reliable choice for expanding teams.
Standout features & integrations:
Features include high-resolution data collection that ensures you capture every detail of your system's performance. The tool’s dynamic alerting lets you set thresholds that adjust automatically based on historical data. You’ll appreciate its predictive analytics, which help anticipate future infrastructure needs.
Integrations include AWS, Microsoft Azure, Google Cloud Platform, Kubernetes, Docker, Terraform, Ansible, Jenkins, PagerDuty, and Slack.
Pros and Cons
Pros:
- Dynamic alert thresholds
- High-resolution monitoring capabilities
- Real-time data collection
Cons:
- Requires technical expertise
- Resource-intensive setup
NetApp Cloud Insight tracks cloud resources and expenses for optimized operations and cost control. Ideal for those prioritizing their cloud resources and finances.
Why I Picked NetApp Cloud Insight:
In the ocean of cloud monitoring tools available today, choosing NetApp Cloud Insight was driven by its focused capabilities in tracking cloud resources and dissecting expenses. This tool emerged distinctively through my comparisons and judgments due to its in-depth resource visualization and precise financial tracking. This specificity and precision underlined its suitability as "Best for monitoring cloud resources and expenses".
Standout Features & Integrations:
NetApp Cloud Insight shines with its advanced performance monitoring capabilities, enabling users to pinpoint bottlenecks and optimize CPU load across cloud infrastructures. Its visualization tools transform intricate cloud data into user-friendly graphs, facilitating easier analysis and decision-making. Further amplifying its utility, Cloud Insight integrates with popular platforms like Windows Server, macOS, and Linux, ensuring a broad spectrum of compatibility.
Pros and Cons
Pros:
- Financial tracking tools provide clarity on cloud-related expenditures.
- Integration with major operating systems improves its flexibility.
- Detailed information presentation enables precise monitoring of cloud resources.
Cons:
- Limited remote access features compared to some competitors.
- Absence of transparent pricing can deter potential users.
- Might present a steeper learning curve for those new to cloud management tools.
IBM i Server Suites is a comprehensive monitoring solution specifically designed for IBM i environments. It caters to IT professionals managing IBM systems, ensuring optimal performance and reliability of server operations.
Why I picked IBM i Server Suites: It’s tailored for IBM systems, providing specialized tools to monitor and manage IBM i environments effectively. The suite includes real-time monitoring, which is crucial for maintaining system health. You can automate routine tasks to enhance operational efficiency. Its alerting system keeps you updated on any critical issues, minimizing downtime.
Standout features & integrations:
Features include automated job scheduling that helps streamline your operations. The tool's performance monitoring provides detailed insights into system activity. You’ll also find its capacity planning useful for anticipating future resource needs.
Integrations include IBM Power Systems, IBM i Access Client Solutions, IBM Db2, IBM WebSphere, Jenkins, Nagios, Microsoft Excel, Microsoft Power BI, SAP, and Jira.
Pros and Cons
Pros:
- Automated routine task management
- Real-time monitoring capabilities
- Specialized for IBM i environments
Cons:
- High initial setup complexity
- Requires IBM-specific expertise
Other Hardware Monitoring Software
Here are some additional hardware monitoring software options that didn’t make it onto my shortlist, but are still worth checking out:
- PRTG Network Monitor
For easy setup
- HWMonitor
For real-time temperature checks
- Icinga Infrastructure Monitoring
For integration flexibility
- Centreon
For centralized monitoring
- Freshservice
For unified asset & service health tracking
- ManageEngine Applications Manager
For application monitoring
- WebSitePulse
For website uptime tracking
- Sensu
For dynamic infrastructure monitoring
- IBM Instana
For automated root cause analysis
- OneIQ
For integrating varied tech stacks
- Loggle Hardware Asset Management Software
For hardware lifecycle tracking
- ParkView Hardware Monitoring
For proactive hardware alerts
- Splunk Cloud Platform
For scalable data analytics
- HWiNFO
For detailed hardware reporting
- Canonical Landscape
For Ubuntu systems management
- CPTRAX for Windows
For file system auditing
- ExpressConnect
For hardware maintenance
- Optanix Advanced Service Assurance Platform
For service assurance
- Network Asset Tracker Pro
For asset inventory management
- Revivn
For sustainable IT asset disposal
Hardware Monitoring Software Selection Criteria
When selecting the best hardware monitoring software to include in this list, I considered common buyer needs and pain points like system performance optimization and early detection of hardware failures. I also used the following framework to keep my evaluation structured and fair:
Core Functionality (25% of total score)
To be considered for inclusion in this list, each solution had to fulfill these common use cases:
- Monitor hardware health and performance
- Provide real-time alerts and notifications
- Track system resource usage
- Generate detailed performance reports
- Support integration with existing IT infrastructure
Additional Standout Features (25% of total score)
To help further narrow down the competition, I also looked for unique features, such as:
- Predictive analytics for hardware failure
- Advanced visualization tools
- Customizable alert thresholds
- Integration with AI for automated responses
- Multi-platform compatibility
Usability (10% of total score)
To get a sense of the usability of each system, I considered the following:
- Intuitive user interface design
- Easy navigation and accessibility
- Customizable dashboards
- Low learning curve for new users
- Availability of mobile access
Onboarding (10% of total score)
To evaluate the onboarding experience for each platform, I considered the following:
- Availability of training videos and tutorials
- Access to interactive product tours
- Use of chatbots for assistance
- Provision of pre-configured templates
- Access to webinars and live demos
Customer Support (10% of total score)
To assess each software provider’s customer support services, I considered the following:
- Availability of 24/7 support
- Access to live chat and phone support
- Comprehensive online knowledge base
- Responsiveness to customer inquiries
- Availability of dedicated account managers
Value For Money (10% of total score)
To evaluate the value for money of each platform, I considered the following:
- Competitive pricing compared to similar tools
- Flexibility in pricing plans and tiers
- Inclusion of essential features in base plans
- Discounts for long-term commitments
- Transparent pricing with no hidden fees
Customer Reviews (10% of total score)
To get a sense of overall customer satisfaction, I considered the following when reading customer reviews:
- Overall satisfaction ratings
- Consistency in positive feedback
- Commonly reported issues or complaints
- Frequency of software updates and improvements
- Testimonials from users in similar industries
How to Choose Hardware Monitoring Software
It’s easy to get bogged down in long feature lists and complex pricing structures. To help you stay focused as you work through your unique software selection process, here’s a checklist of factors to keep in mind:
| Factor | What to Consider |
| Scalability | Ensure the software can grow with your business. Check if it supports increasing numbers of devices and data as your infrastructure expands. |
| Integrations | Look for compatibility with your existing tools. Ensure it integrates with platforms like AWS, Azure, or any other specific systems your team uses. |
| Customizability | Choose software that allows you to tailor dashboards and alerts to fit your team’s specific needs and workflow preferences. |
| Ease of Use | Prioritize user-friendly interfaces. Your team should be able to navigate and utilize the tool without extensive training or a steep learning curve. |
| Budget | Evaluate the cost against your budget. Consider both the upfront costs and any ongoing fees, ensuring it delivers value for money for your needs. |
| Security Safeguards | Ensure robust security features are in place. Look for data encryption, user access controls, and compliance with industry standards to protect your data. |
| Support Services | Check for available support options. Consider if they offer 24/7 support, live chat, or dedicated account managers to assist your team. |
| Performance Monitoring | Verify the ability to provide real-time insights. It should offer detailed reports and alerts to keep your systems running smoothly. |
Trends in Hardware Monitoring Software
In my research, I sourced countless product updates, press releases, and release logs from different hardware monitoring software vendors. Here are some of the emerging trends I’m keeping an eye on:
- AI-Powered Analytics: AI is enhancing data analysis by predicting hardware failures and optimizing performance. Vendors like IBM Instana are integrating AI to provide more accurate insights and proactive solutions.
- Edge Computing Support: With the rise of IoT devices, edge computing is becoming crucial. Vendors are adapting their tools to monitor data processed at the edge, reducing latency and improving real-time decision-making.
- Sustainability Features: More tools are offering energy consumption metrics and eco-friendly options. This trend helps businesses reduce their environmental impact while cutting costs.
- Unified Monitoring Platforms: Vendors are merging hardware and software monitoring into single platforms. This holistic view simplifies management and provides comprehensive insights across all systems.
- Enhanced Security Monitoring: As cyber threats grow, security monitoring features are in demand. Solutions are now including real-time threat detection and compliance reporting to keep data secure.ftware that's tailored to your specific needs and offers the best value.
What Is Hardware Monitoring Software?
Hardware monitoring software is a tool that tracks the health and performance of computer hardware components. IT professionals, system administrators, and network managers typically use these tools to maintain system efficiency and prevent hardware failures.
Features like real-time alerts, AI-powered analytics, and edge computing support help with proactive maintenance and efficient resource management. Overall, these tools ensure systems run smoothly, saving time and reducing costs.
Features of Hardware Monitoring Software
When selecting hardware monitoring software, keep an eye out for the following key features:
- Real-time alerts: Notify users immediately of any hardware issues, allowing for quick response and minimizing downtime.
- AI-powered analytics: Provide predictive insights to anticipate hardware failures and optimize performance proactively.
- Edge computing support: Monitor data processed at the edge of the network, reducing latency and improving real-time decision-making.
- Customizable dashboards: Allow users to tailor the interface to display relevant data, enhancing usability and focus.
- Energy consumption metrics: Help businesses track and reduce their environmental impact while cutting operational costs.
- Unified monitoring platforms: Combine hardware and software monitoring into a single tool for comprehensive system insights.
- Automated threshold management: Adjust performance thresholds automatically to prevent potential issues before they escalate.
- Security monitoring: Include real-time threat detection to keep data secure and ensure compliance with industry standards.
Benefits of Hardware Monitoring Software
Implementing hardware monitoring software provides several benefits for your team and your business. Here are a few you can look forward to:
- Proactive maintenance: Real-time alerts and AI-powered analytics help you address issues before they become major problems.
- Cost savings: Energy consumption metrics and automated threshold management reduce operational costs and prevent expensive downtime.
- Enhanced security: Security monitoring features protect your data with real-time threat detection and compliance reporting.
- Improved efficiency: Customizable dashboards and unified monitoring platforms streamline processes by providing comprehensive insights.
- Scalability: Edge computing support and scalable architecture ensure the software grows with your business needs.
- Better decision-making: Predictive analytics offer valuable insights that guide resource allocation and future planning.
- Environmental impact reduction: Tracking energy use helps lower your carbon footprint while improving sustainability efforts.
Costs and Pricing of Hardware Monitoring Software
Selecting hardware monitoring software requires an understanding of the various pricing models and plans available. Costs vary based on features, team size, add-ons, and more. The table below summarizes common plans, their average prices, and typical features included in hardware monitoring software solutions:
Plan Comparison Table for Hardware Monitoring Software
| Plan Type | Average Price | Common Features |
| Free Plan | $0 | Basic monitoring capabilities, limited alerts, and community support. |
| Personal Plan | $5-$25/user/month | Real-time alerts, customizable dashboards, and email support. |
| Business Plan | $30-$75/user/month | Advanced analytics, integration with third-party tools, and phone support. |
| Enterprise Plan | $100-$200/user/month | Predictive analytics, multi-site support, dedicated account management, and 24/7 customer service. |
Hardware Monitoring Software FAQs
Here are some answers to common questions about hardware monitoring software:
How do I monitor hardware usage across my infrastructure?
You can monitor hardware usage by deploying a centralized hardware monitoring software across all critical servers and devices. These tools collect real-time data on CPU, memory, disk health, temperature, and power supply status. For CTOs, look for solutions that support remote access, customizable alerts, and dashboards so your team can proactively address issues and analyze long-term trends.
Can hardware monitoring software predict failures?
Yes, some advanced hardware monitoring platforms use predictive analytics to forecast hardware issues before they cause failures. They analyze performance trends, error logs, and sensor data—such as temperature spikes or power fluctuations—to flag components at risk. This lets CTOs schedule maintenance in advance, reducing costly outages.
What are the benefits of real-time alerts in hardware monitoring?
Real-time alerts notify your team instantly about hardware anomalies, such as overheating, component degradation, or unexpected shutdowns. This rapid response capability helps CTOs ensure system uptime, prevent cascading failures, and minimize business disruption. Configurable alert thresholds allow the team to prioritize the most urgent risks.
How do I choose the right hardware monitoring software for my business?
Start by identifying your infrastructure’s key hardware assets and the metrics you need to track. Prioritize tools that offer broad compatibility, automated reporting, strong security practices, and integrations with your existing IT stack. Look for solutions that scale with your company and support proactive alerting and remote management.
What key metrics should I monitor to ensure optimal server hardware health?
Monitor processor usage, memory utilization, disk read/write errors, temperature, fan speed, power consumption, and RAID status. Keeping an eye on these metrics lets you spot warning signs early, plan upgrades, and avoid hardware failures. Many CTOs use dashboards that summarize these insights for fast decision making.
How can hardware monitoring software help reduce unplanned downtime?
Hardware monitoring tools cut downtime by providing early warnings and precise diagnostics when issues occur. Automated alerts and historical data let your team act before critical systems fail. This proactive approach saves time during incidents and improves business continuity.
What's Next?
Boost your SaaS growth and leadership skills. Subscribe to our newsletter for the latest insights from CTOs and aspiring tech leaders.
We'll help you scale smarter and lead stronger with guides, resources, and strategies from top experts!


