23 strumenti di monitoraggio della rete basati su cloud per il 2026

Lista ristretta degli strumenti di monitoraggio della rete basati su cloud


Gli strumenti di monitoraggio della rete basati su cloud sono piattaforme che ti permettono di monitorare, analizzare e gestire la salute e le prestazioni della tua rete ovunque tu sia, utilizzando il cloud. Se cerchi un modo per ridurre i tempi di inattività, individuare problemi in anticipo e mantenere sicura la tua infrastruttura senza la complessità dell’hardware on-premise, questi strumenti fanno al caso tuo.
Con così tante opzioni disponibili, può essere difficile capire quale soluzione si adatti meglio al tuo ambiente, alle tue esigenze di conformità e ai requisiti di integrazione. Questa lista ti aiuterà a confrontare i principali strumenti di monitoraggio rete basati su cloud per il 2026, così potrai prendere una decisione informata e mantenere i tuoi sistemi sempre operativi.
Table of Contents
- Migliori software selezionati
- Perché fidarsi dei nostri revisori
- Confronta le specifiche
- Recensioni
- Altri strumenti di monitoraggio della rete basati su cloud
- Criteri di selezione
- Come scegliere
- Cosa sono gli strumenti di monitoraggio della rete basati su cloud?
- Caratteristiche
- Vantaggi
- Costi e prezzi
Perché Fidarti delle Nostre Recensioni Software
Testiamo e recensiamo software dal 2023. Come leader tecnologici, sappiamo quanto sia cruciale e difficile prendere la decisione giusta nella scelta di un software.
Investiamo in una ricerca approfondita per aiutare il nostro pubblico a effettuare scelte migliori di acquisto software. Abbiamo testato oltre 2.000 strumenti per diversi casi d’uso tecnologici e scritto più di 1.000 recensioni complete. Scopri come restiamo trasparenti e la nostra metodologia di recensione del software.
Sintesi dei migliori strumenti di monitoraggio della rete basati su cloud
Questa tabella comparativa riassume i dettagli dei prezzi delle mie principali scelte di strumenti di monitoraggio della rete basati su cloud, per aiutarti a trovare quello migliore per il tuo budget e per le esigenze aziendali.
| Tool | Best For | Trial Info | Price | ||
|---|---|---|---|---|---|
| 1 | Ideale per scalabilità nel monitoraggio distribuito | Download gratuito disponibile | Da $325/mese (fatturazione annuale) | Website | |
| 2 | Ideale per estensibilità open-source | Piano gratuito e demo gratuita disponibili | Da $2,595 (licenza perpetua per 100 nodi) | Website | |
| 3 | Ideale per il rilevamento automatico dei dispositivi | Prova gratuita di 15 giorni | Da $16/unità ibrida/mese | Website | |
| 4 | Ideale per la mappatura interattiva della rete | Prova gratuita di 30 giorni + Edizione gratuita disponibile | Prezzo su richiesta | Website | |
| 5 | Ideale per analisi avanzate delle prestazioni di rete | Prova gratuita di 30 giorni + demo gratuita disponibile | Da $7/nodo/mese | Website | |
| 6 | Ideale per la personalizzazione della visualizzazione dei dati | Piano gratuito disponibile | Da $19/mese | Website | |
| 7 | Ideale per il monitoraggio in tempo reale delle risorse AWS | Prova gratuita disponibile | Prezzo su richiesta | Website | |
| 8 | Ideale per flussi di lavoro di allerta personalizzabili | Prova gratuita di 30 giorni + demo gratuita disponibile | Da $104/mese | Website | |
| 9 | Ideale per il supporto ad ambienti ibridi | Prova gratuita + demo gratuita disponibile | Da GBP €590/perpetuo (fatturato annualmente) | Website | |
| 10 | Ideale per integrazione nativa con l'ecosistema Microsoft | Demo gratuita disponibile | Prezzo su richiesta | Website |
-

TestDevLab
Visit Website -
Site24x7
Visit WebsiteThis is an aggregated rating for this tool including ratings from Crozdesk users and ratings from other sites.4.7 -
GitHub Actions
Visit WebsiteThis is an aggregated rating for this tool including ratings from Crozdesk users and ratings from other sites.4.8


Recensioni degli strumenti di monitoraggio della rete basati su cloud
Di seguito trovi i miei approfondimenti sugli strumenti di monitoraggio della rete basati su cloud che sono entrati nella mia lista ristretta. Le mie recensioni offrono una panoramica dettagliata delle funzionalità, delle integrazioni e dei casi d’uso ideali di ogni piattaforma per aiutarti a trovare quella più adatta alle tue esigenze.

Zabbix è progettato per team IT e aziende che devono monitorare reti ampie e distribuite in più sedi. È particolarmente adatto alle organizzazioni che gestiscono infrastrutture complesse con migliaia di dispositivi o endpoint. Zabbix aiuta a centralizzare il monitoraggio, automatizzare il rilevamento e aumentare la visibilità man mano che la rete cresce.
Perché ho scelto Zabbix
Ciò che distingue Zabbix è la capacità di scalare il monitoraggio su ambienti altamente distribuiti e complessi. Ho scelto Zabbix perché supporta il monitoraggio sia basato su agent che senza agent, rendendolo flessibile per differenti architetture di rete. La sua architettura di monitoraggio distribuito consente di implementare proxy in sedi remote, così da raccogliere e centralizzare i dati da più siti senza perdere visibilità. Questo approccio è particolarmente utile per le organizzazioni che devono monitorare migliaia di dispositivi o infrastrutture geograficamente disperse.
Funzionalità principali di Zabbix
Altre funzionalità che rendono Zabbix utile nel monitoraggio di reti cloud includono:
- Dashboard personalizzabili: Crea panoramiche visive sullo stato e sulle prestazioni della rete tramite widget e grafici.
- Allerta automatizzata: Configura trigger e notifiche per eventi o soglie specifici della rete.
- Libreria di template: Utilizza template predefiniti per dispositivi, applicazioni e servizi comuni, velocizzando così la distribuzione.
- Accesso API: Integra Zabbix con altri strumenti o automatizza attività tramite la sua API REST.
Integrazioni Zabbix
Le integrazioni includono Microsoft Azure, Amazon Web Services, VMware, Cisco, IBM, Oracle, Slack, Elasticsearch, MySQL, PostgreSQL e altro ancora.
Pros and Cons
Pros:
- Ampia libreria di template della community
- Altamente scalabile per ambienti di grandi dimensioni
- Basso impatto sulle risorse per gli agent
Cons:
- L'esperienza utente può risultare macchinosa
- La gestione del database richiede molte risorse

Se stai cercando uno strumento di monitoraggio di rete con profonda flessibilità open-source, Nagios merita attenzione. È ideale per specialisti IT e organizzazioni che desiderano personalizzare il monitoraggio per ambienti cloud e ibridi unici. Grazie alla sua architettura a plugin e alla community attiva, Nagios aiuta i team a creare soluzioni su misura per sfide infrastrutturali complesse.
Perché ho scelto Nagios
Ciò che rende Nagios eccezionale per il monitoraggio di reti cloud è l'estensibilità open-source, che ti offre il pieno controllo su come monitorare il tuo ambiente. Il framework a plugin ti permette di aggiungere o creare controlli personalizzati per servizi cloud, macchine virtuali e infrastrutture ibride. Apprezzo che si possa accedere a un'ampia libreria di plugin forniti dalla community, così non sei limitato alle opzioni di monitoraggio predefinite. Questa flessibilità è particolarmente utile per team IT con esigenze particolari o architetture cloud in rapida evoluzione.
Funzionalità principali di Nagios
Altre funzioni che rendono Nagios interessante per il monitoraggio di reti orientato al cloud includono:
- Monitoraggio multi-tenant: Supporta il monitoraggio di più ambienti o clienti da una singola istanza.
- Avvisi automatizzati: Invia notifiche tramite email, SMS o script personalizzati quando vengono rilevati problemi.
- Grafici delle prestazioni: Visualizza dati sulle prestazioni storici e in tempo reale delle risorse monitorate.
- Controllo degli accessi basato sui ruoli: Permette di assegnare diversi permessi agli utenti in base alle loro responsabilità.
Integrazioni di Nagios
Le integrazioni includono Amazon Web Services, Microsoft Azure, VMware, Cisco, Dell EMC e altro ancora.
Pros and Cons
Pros:
- Estremamente flessibile e personalizzabile
- Minimo impatto sulle risorse su Linux
- Affidabilità impeccabile una volta configurato
Cons:
- La versione Core non dispone di un'interfaccia web moderna
- Nessuna auto-scoperta nativa nella versione Core
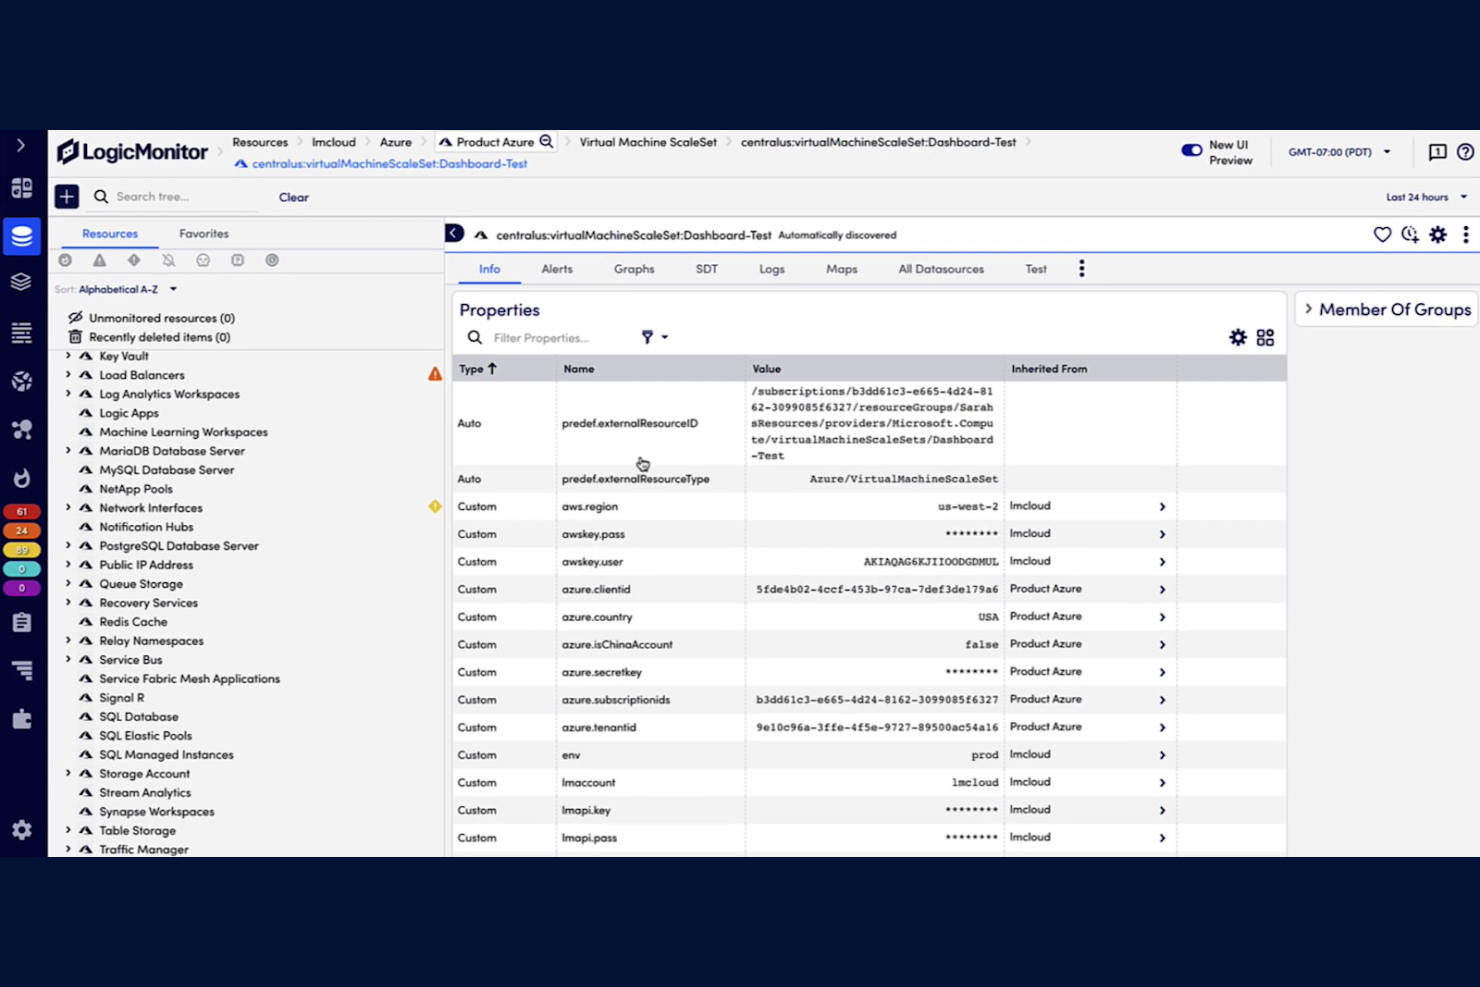
Se stai cercando uno strumento di monitoraggio della rete che possa rilevare e mappare automaticamente i dispositivi in ambienti complessi, LogicMonitor merita sicuramente attenzione. Questa piattaforma è pensata per i team IT che gestiscono infrastrutture ibride e hanno la necessità di ridurre le configurazioni manuali mantenendo il passo con i rapidi cambiamenti delle reti. Il rilevamento automatico dei dispositivi ti aiuta a mantenere visibilità e controllo man mano che la rete cresce o cambia.
Perché ho scelto LogicMonitor
A differenza di alcuni software di monitoraggio della rete che richiedono l'inserimento manuale dei dispositivi, LogicMonitor si distingue per le sue capacità di rilevamento automatico dei dispositivi. Ho scelto LogicMonitor perché esegue una scansione continua dell’ambiente per individuare nuovi dispositivi e mappare la topologia di rete senza configurazioni aggiuntive. Questa automazione è particolarmente preziosa per i team IT che gestiscono reti dinamiche o su larga scala dove i dispositivi vengono spesso aggiunti o modificati. Con LogicMonitor puoi mantenere un inventario sempre aggiornato e ridurre il rischio di zone cieche nella copertura di monitoraggio.
Funzionalità chiave di LogicMonitor
Oltre al rilevamento automatico dei dispositivi, LogicMonitor offre anche altre funzioni a supporto del monitoraggio della rete:
- Mappatura dinamica della topologia: visualizza in tempo reale le relazioni e le dipendenze della rete.
- Soglie di allerta personalizzabili: ti consente di impostare trigger specifici per diversi dispositivi o metriche.
- Analisi log integrata: correla i dati dei log con le metriche di prestazione per una risoluzione più approfondita dei problemi.
- Monitoraggio di infrastrutture cloud e ibride: monitora le risorse attraverso cloud pubblici, privati e ambienti on-premises.
Integrazioni di LogicMonitor
Le integrazioni includono AWS, Azure, NetApp, ServiceNow, Slack, PagerDuty e Microsoft Teams.
Pros and Cons
Pros:
- Ottimo rilevamento automatico delle risorse
- Vista unificata per stack ibridi/cloud
- AI predittiva per il rilevamento delle anomalie
Cons:
- Configurazione complessa per fonti di dati personalizzate
- L'interfaccia può risultare macchinosa e poco uniforme
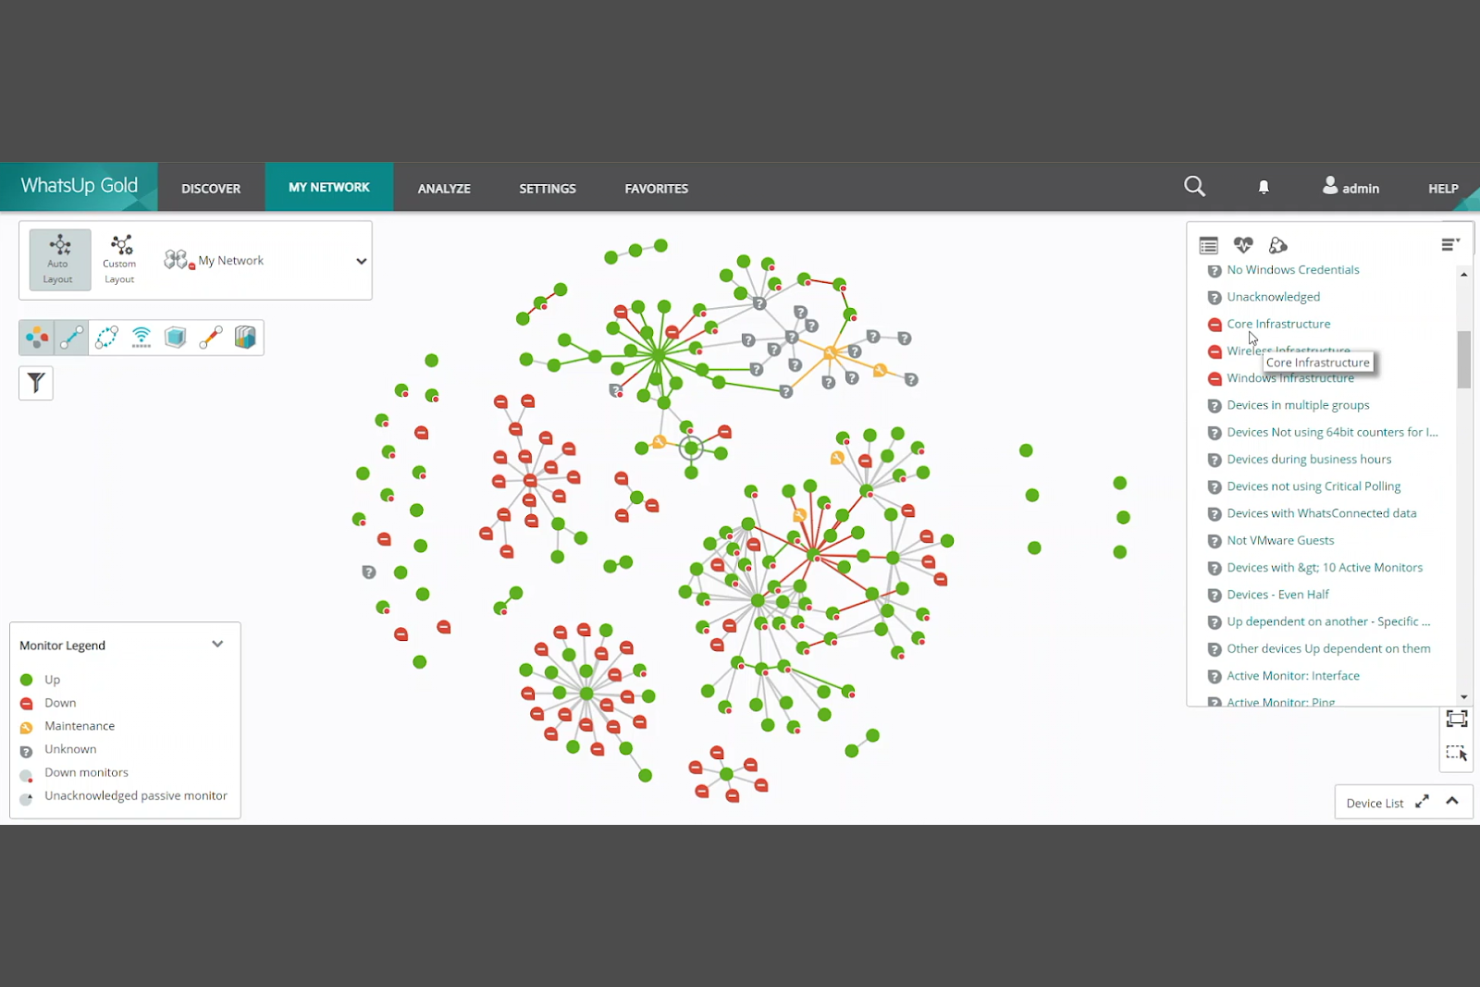
WhatsUp Gold si distingue per i team IT che necessitano di una mappatura di rete interattiva e in tempo reale per visualizzare ambienti complessi. Le sue mappe dinamiche aiutano gli amministratori di rete a individuare rapidamente i problemi e a comprendere le relazioni tra i dispositivi su infrastrutture cloud e on-premises. Questo approccio è particolarmente utile per le organizzazioni che gestiscono reti ibride o che affrontano frequenti cambiamenti di topologia.
Perché ho scelto WhatsUp Gold
Una delle caratteristiche che distingue WhatsUp Gold è la sua mappatura di rete interattiva, particolarmente preziosa per il monitoraggio delle reti basato su cloud. La piattaforma rileva automaticamente i dispositivi e crea mappe topologiche live, così puoi vedere in tempo reale i cambiamenti mentre la tua rete evolve. Mi piace come sia possibile approfondire singoli dispositivi o connessioni direttamente dalla mappa, rendendo più semplice la risoluzione rapida dei problemi. Questo livello di chiarezza visiva è perfetto per i team che gestiscono ambienti di rete dinamici o ibridi.
Funzionalità principali di WhatsUp Gold
Oltre alle sue capacità di mappatura interattiva, ci sono altre funzionalità degne di nota:
- Monitoraggio delle risorse cloud: tiene traccia dello stato e delle prestazioni delle risorse AWS e Azure insieme ai dispositivi locali.
- Allertamento configurabile: consente di impostare soglie personalizzate e ricevere notifiche tramite più canali.
- Analisi del traffico di rete: offre visibilità sull'utilizzo della larghezza di banda e sui modelli di traffico delle applicazioni.
- Report sullo stato dei dispositivi: genera report dettagliati sulla salute dei dispositivi, il tempo di disponibilità e le metriche di prestazione.
Integrazioni di WhatsUp Gold
Le integrazioni includono Microsoft Azure, Amazon Web Services, VMware, Cisco, Dell EMC e altro.
Pros and Cons
Pros:
- Prezzi basati sui dispositivi facili da prevedere
- Robuste opzioni di allerta già pronte
- Monitoraggio di rete affidabile senza agenti
Cons:
- L'interfaccia web può risultare lenta e poco fluida
- Costi elevati per moduli plugin avanzati
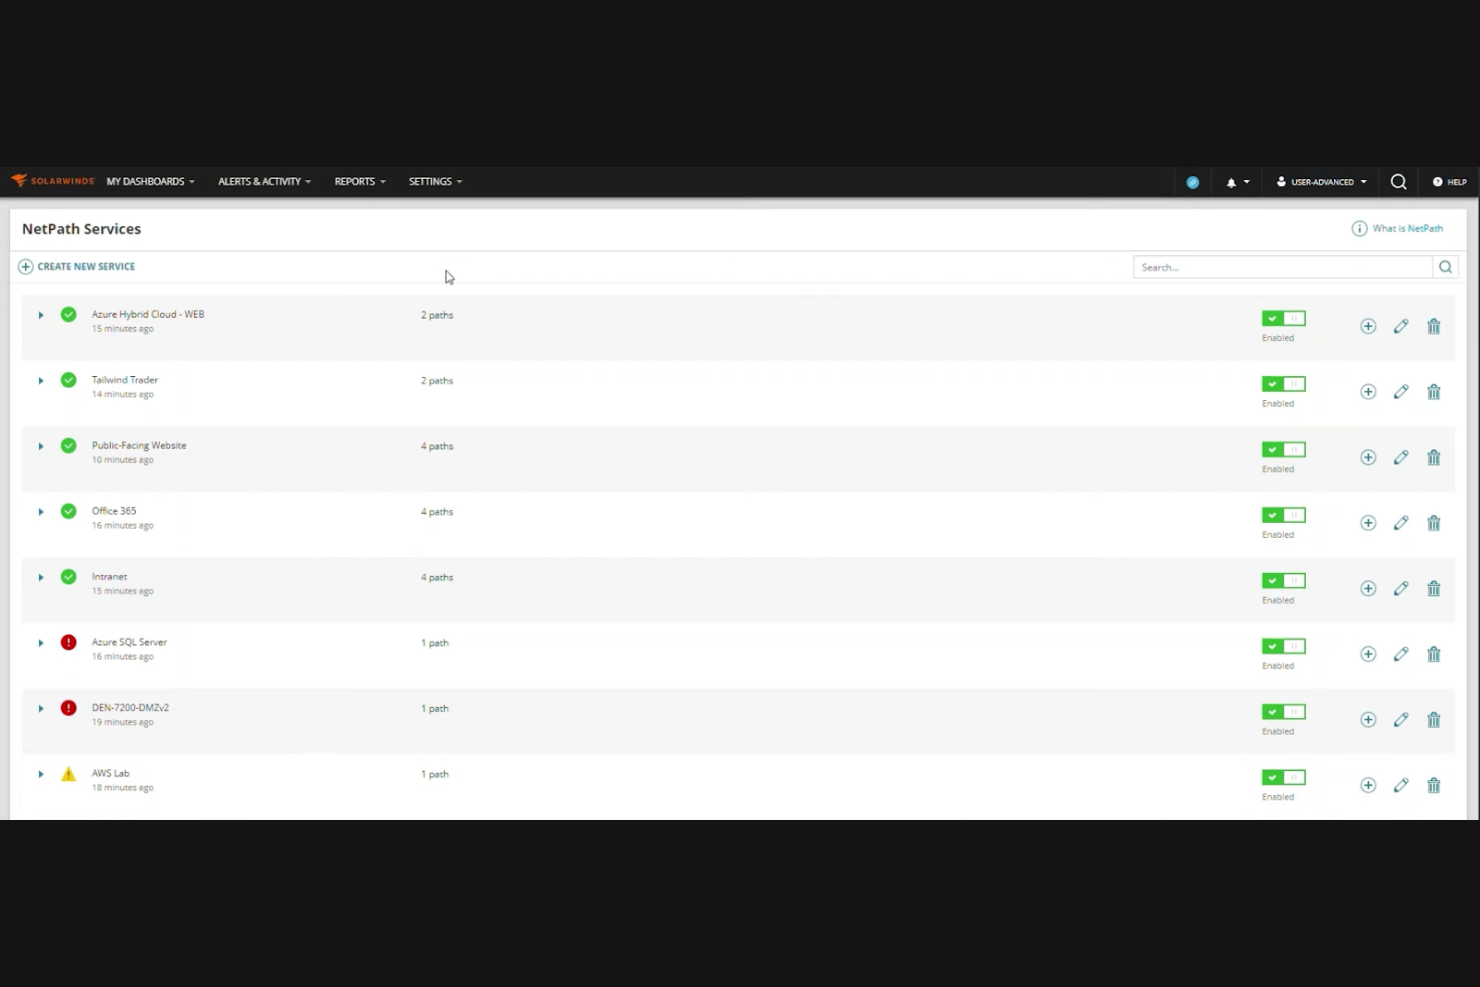
SolarWinds è progettato per i team IT che necessitano di una visibilità approfondita sulle prestazioni della rete attraverso ambienti cloud e ibridi. È particolarmente utile per le organizzazioni che desiderano analisi avanzate per individuare colli di bottiglia e ottimizzare l'utilizzo delle risorse. Grazie al suo focus sul monitoraggio granulare e le diagnosi in tempo reale, SolarWinds aiuta ad affrontare sfide di rete complesse prima che abbiano impatto sugli utenti.
Perché ho scelto SolarWinds
Quando ho valutato gli strumenti per analisi avanzate delle prestazioni di rete, SolarWinds si è distinto per la profondità delle sue funzionalità di monitoraggio e diagnostica. La piattaforma offre un'analisi dettagliata del traffico e una definizione di baseline delle prestazioni, che aiutano a identificare pattern insoliti e potenziali problemi in tempo reale. Apprezzo come la funzione NetPath visualizzi graficamente i percorsi di rete tra ambienti cloud e on-premises, rendendo più semplice individuare eventuali colli di bottiglia. Queste funzionalità guidate dall'analisi rendono SolarWinds una scelta solida per i team IT che necessitano di insight operativi per mantenere prestazioni di rete cloud affidabili.
Caratteristiche principali di SolarWinds
Altre funzionalità che rendono SolarWinds utile per il monitoraggio di reti cloud includono:
- Dashboard personalizzabili: Crea layout visivi adattati alle priorità di monitoraggio del tuo team.
- Rilevamento automatico dei dispositivi: Individua e aggiunge nuovi dispositivi di rete non appena si connettono.
- Controllo degli accessi basato sui ruoli: Assegna permessi in base ai ruoli e alle responsabilità degli utenti.
- Supporto REST API: Si integra con altri strumenti di gestione IT e flussi di lavoro personalizzati.
Integrazioni di SolarWinds
Le integrazioni includono Microsoft Active Directory, VMware, Amazon Web Services, Microsoft Azure, Slack e altre ancora.
Pros and Cons
Pros:
- Vasta community e documentazione
- Modello di licenza semplificato basato sui nodi
- Rilevamento rapido delle risorse di rete locali
Cons:
- Le funzionalità avanzate richiedono i piani di livello superiore
- I tempi di risposta dell'assistenza possono essere incostanti
Grafana Cloud offre ai team IT e agli specialisti di rete un modo flessibile per visualizzare e analizzare i dati provenienti da più fonti in un unico posto. È particolarmente utile per le organizzazioni che devono creare dashboard personalizzate e monitorare ambienti cloud complessi e distribuiti. Grazie alla sua architettura aperta, Grafana Cloud consente di adattare le visualizzazioni alle tue esigenze specifiche di monitoraggio della rete.
Perché ho scelto Grafana Cloud
Grafana Cloud si distingue per il suo profondo focus sulla personalizzazione della visualizzazione dei dati, fondamentale per i team che monitorano reti cloud complesse. Ho scelto Grafana Cloud perché permette di creare dashboard altamente personalizzate che raccolgono metriche da un'ampia gamma di fonti. La piattaforma supporta opzioni di visualizzazione avanzate, inclusi pannelli personalizzati e aggiornamenti dinamici in tempo reale dei dati. Questo livello di flessibilità è particolarmente prezioso quando è necessario monitorare KPI unici o correlare dati provenienti da molteplici servizi cloud.
Caratteristiche principali di Grafana Cloud
Altre funzionalità che rendono Grafana Cloud prezioso per il monitoraggio di reti basate su cloud includono:
- Sistema di avvisi e notifiche: configura avvisi basati su soglie e invia notifiche tramite canali come Slack, PagerDuty o email.
- Supporto dati multi-sorgente: connettiti a database, servizi cloud e strumenti di monitoraggio come Prometheus, AWS CloudWatch e Azure Monitor.
- Controlli di accesso utente: imposta permessi granulari per team e individui per gestire l'accesso e i diritti di modifica delle dashboard.
- Ecosistema di plugin: estendi le funzionalità con plugin per nuove fonti dati, visualizzazioni e integrazioni applicative.
Integrazioni di Grafana Cloud
Le integrazioni includono Prometheus, InfluxDB, Elasticsearch, AWS CloudWatch, MySQL, Graphite, Splunk e altri.
Pros and Cons
Pros:
- Generoso piano gratuito per piccoli progetti
- Potente supporto per query PromQL e KQL
- Il servizio gestito riduce il carico operativo
Cons:
- Mancanza di controlli di fatturazione granulari
- La configurazione degli avvisi può essere piuttosto complessa
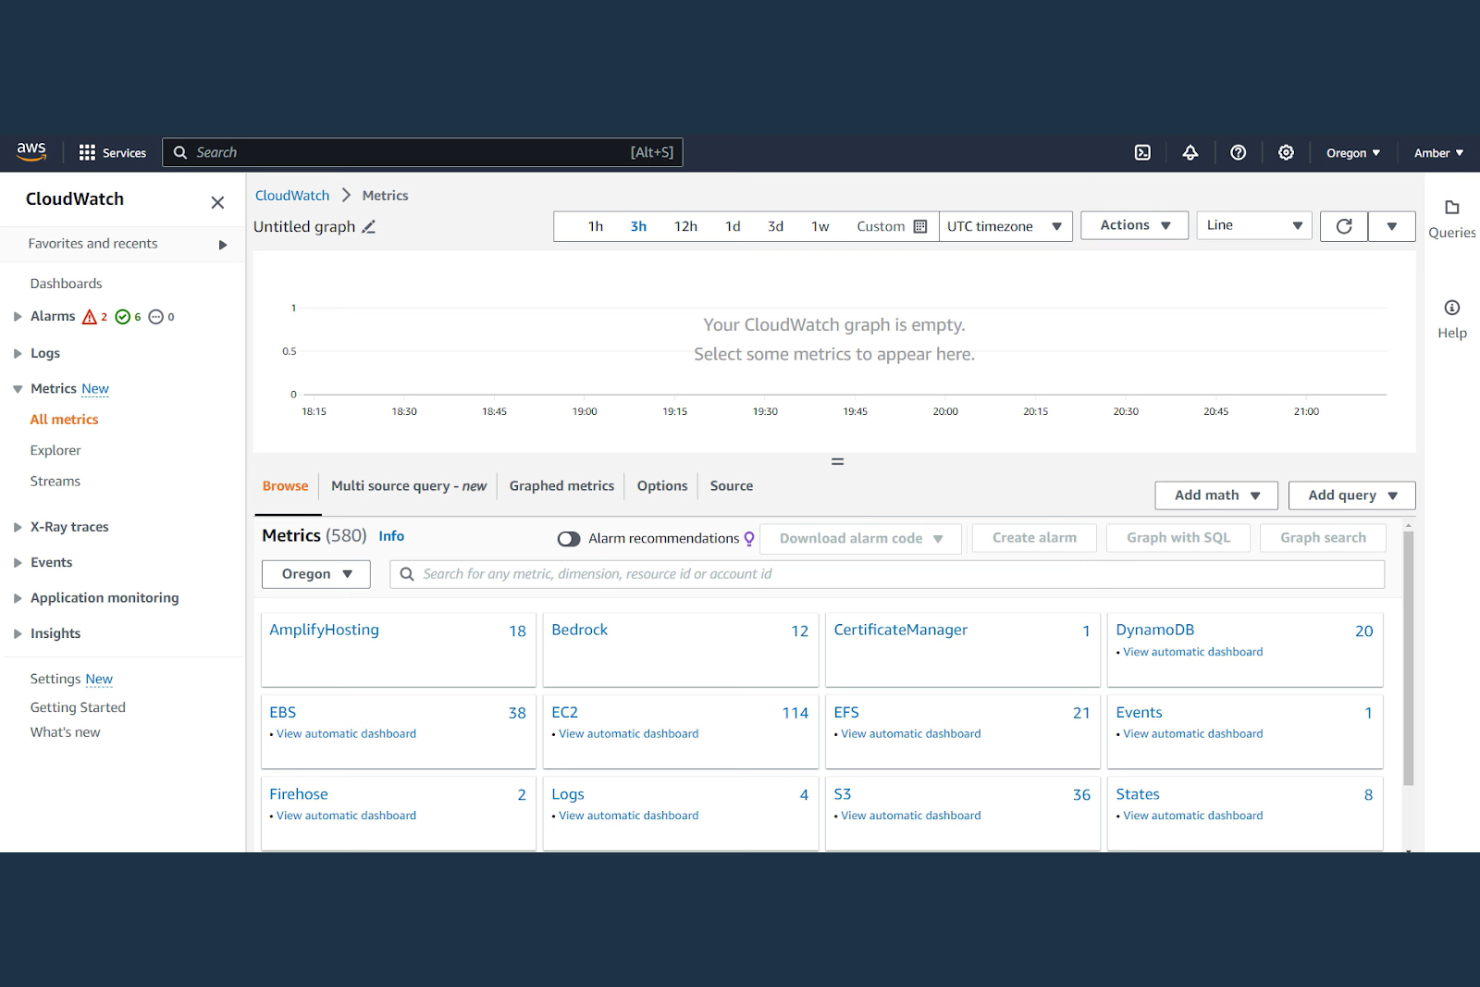
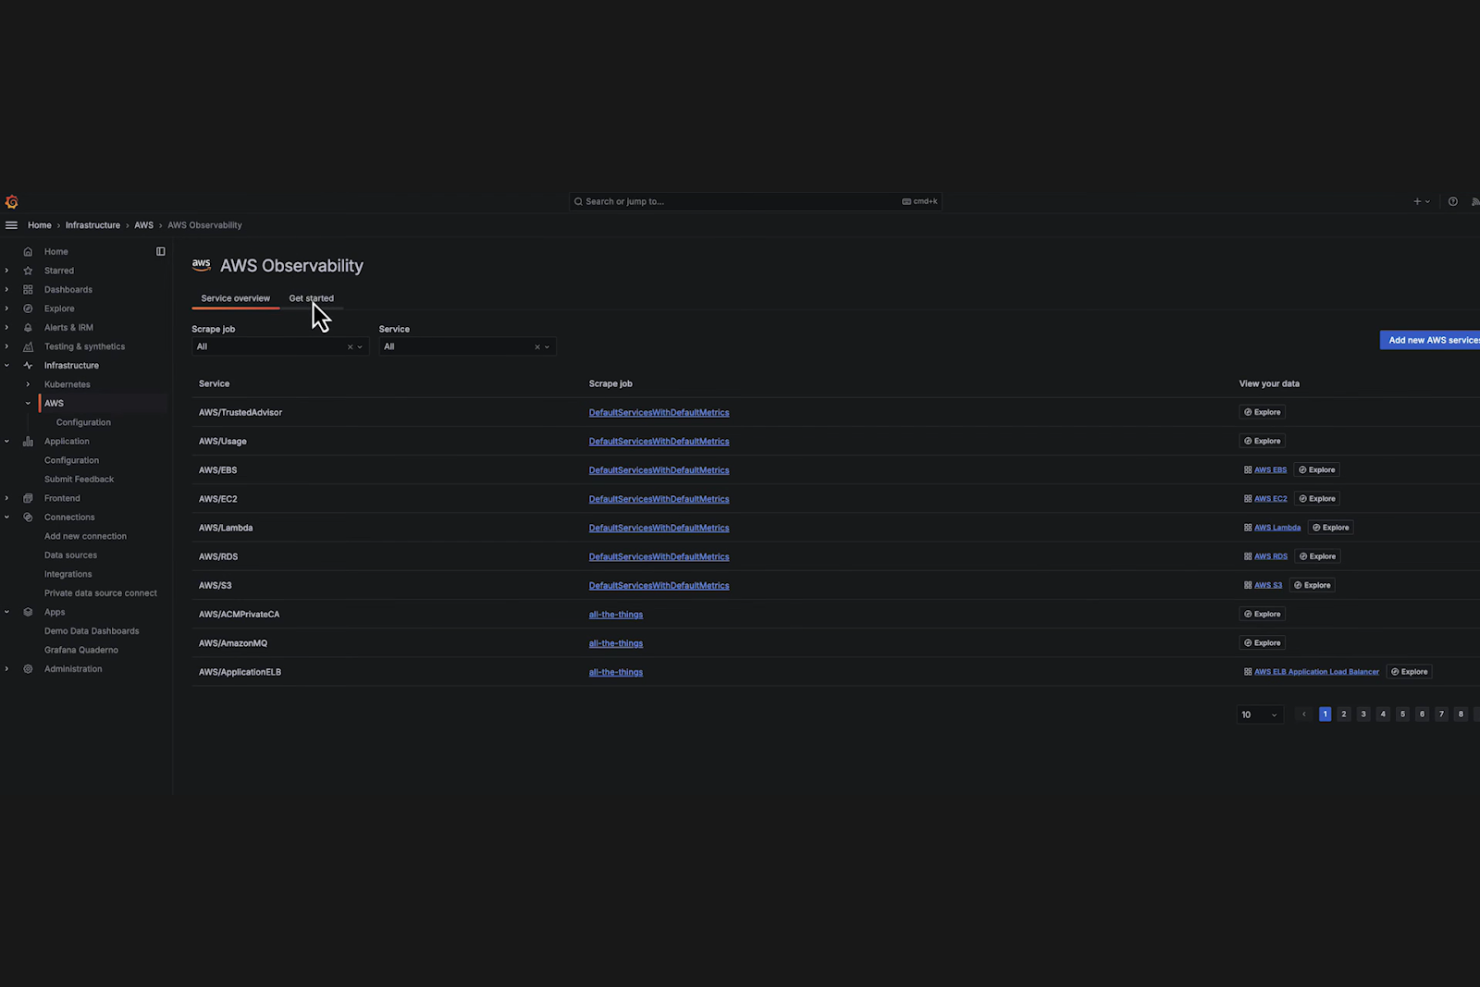
Per i team IT che gestiscono l'infrastruttura AWS, AWS CloudWatch offre monitoraggio e osservabilità in tempo reale, pensati su misura per gli ambienti Amazon Web Services. Questo strumento è particolarmente adatto alle organizzazioni che hanno bisogno di tenere traccia dell'utilizzo delle risorse, delle prestazioni delle applicazioni e della salute operativa su carichi di lavoro AWS. Grazie alla sua capacità di raccogliere e visualizzare metriche, log ed eventi direttamente dalle risorse AWS, CloudWatch ti aiuta a individuare e rispondere rapidamente ai problemi in ambienti cloud dinamici.
Perché ho scelto AWS CloudWatch
Quando hai bisogno di una panoramica immediata delle tue risorse AWS, AWS CloudWatch offre un monitoraggio in tempo reale strettamente integrato con l'ecosistema AWS. Ho scelto CloudWatch perché raccoglie e visualizza automaticamente metriche, log ed eventi da una vasta gamma di servizi AWS, garantendoti una visibilità sempre aggiornata sulla tua infrastruttura cloud. I suoi dashboard in tempo reale e gli allarmi automatici ti aiutano a individuare e rispondere ai problemi di performance non appena si verificano. Per gli specialisti IT che operano in ambienti AWS, questo livello di performance ottimale è difficile da eguagliare.
Funzionalità principali di AWS CloudWatch
Altre funzionalità utili di AWS CloudWatch per il monitoraggio della rete includono:
- Metriche personalizzate: ti consente di pubblicare e monitorare metriche personalizzate delle tue applicazioni o infrastrutture insieme ai dati dei servizi AWS.
- Log Insights: offre un motore di query per cercare e analizzare i dati di log su larga scala.
- Allarmi compositi: permette di combinare più allarmi in un unico avviso per un monitoraggio più dettagliato.
- CloudWatch Synthetics: simula l'attività degli utenti per monitorare la disponibilità e la latenza degli endpoint e delle API delle applicazioni.
Integrazioni di AWS CloudWatch
Le integrazioni includono Amazon EC2, Amazon S3, Amazon RDS, AWS Lambda, Amazon ECS, Amazon EKS e Amazon SNS.
Pros and Cons
Pros:
- Potenti analisi dei log in stile SQL (KQL)
- Altamente scalabile per carichi di lavoro aziendali
- Segnalazioni affidabili con rilevamento delle anomalie
Cons:
- Le tariffe di archiviazione dei log possono aumentare rapidamente
- La dashboard ha un'interfaccia semplice e datata
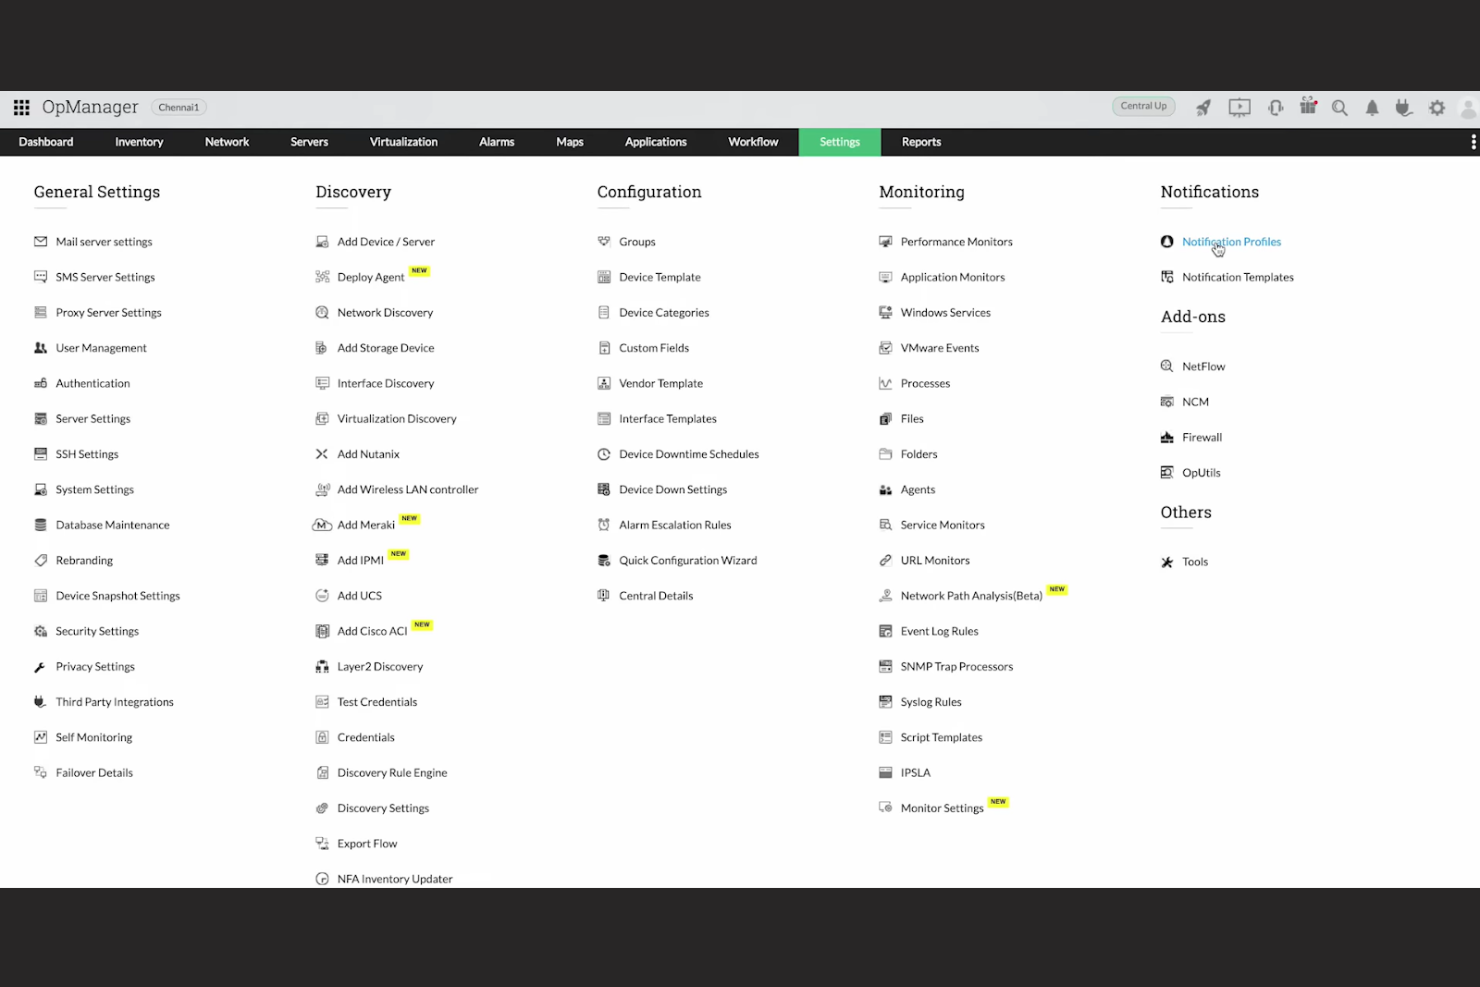
Con ManageEngine, ottieni una soluzione per il monitoraggio della rete che si distingue per i flussi di lavoro di allerta altamente personalizzabili. Questo strumento è particolarmente indicato per i team IT di organizzazioni con infrastrutture complesse o dinamiche che necessitano di un controllo granulare su come e quando vengono attivate e gestite le segnalazioni. Se la tua azienda richiede regole di notifica su misura e risposte automatizzate a specifici eventi di rete, ManageEngine offre la flessibilità per progettare flussi di lavoro adattabili al tuo ambiente.
Perché ho scelto ManageEngine
Ciò che mi ha attratto di ManageEngine è il suo focus sui flussi di lavoro di allerta personalizzabili, un'esigenza fondamentale per molti team IT che gestiscono reti basate su cloud. Puoi impostare regole di escalation multilivello, definire inneschi di avviso personalizzati basati su condizioni specifiche della rete e automatizzare le risposte agli incidenti. Apprezzo il fatto che la piattaforma ti permetta di personalizzare i canali e i programmi di notifica per differenti team o ruoli, così che le allerta arrivino sempre alle persone giuste al momento giusto. Questo livello di flessibilità è particolarmente utile se il tuo ambiente richiede un controllo preciso su come vengono rilevati e gestiti i problemi di rete.
Caratteristiche principali di ManageEngine
Altre funzionalità di ManageEngine utili per il monitoraggio della rete includono:
- Mappatura della topologia di rete: Rileva e visualizza automaticamente i dispositivi di rete e le loro relazioni in tempo reale.
- Analisi della larghezza di banda: Monitora e genera report sull'utilizzo della banda per applicazione, protocollo o dispositivo.
- Gestione della configurazione: Tiene traccia e gestisce le modifiche alle configurazioni dei dispositivi di rete con il controllo delle versioni.
- Gestione degli indirizzi IP: Centralizza la tracciabilità e l'allocazione degli indirizzi IP su tutta la rete.
Integrazioni ManageEngine
Le integrazioni includono ServiceNow, Slack, Microsoft Teams, Jira, AWS e Dell EMC.
Pros and Cons
Pros:
- Gestione patch automatizzata molto efficiente
- Consolle di gestione IT unificata
- Piani gratuiti generosi per piccoli team
Cons:
- Configurazione iniziale complessa e lenta
- La qualità dell'assistenza può essere incostante

Pandora FMS è progettato per i team IT che gestiscono infrastrutture sia cloud che on-premises in ambienti complessi e ibridi. È ideale per le organizzazioni che necessitano di un monitoraggio unificato su sistemi eterogenei, dai server legacy alle moderne piattaforme cloud. Grazie alla sua flessibilità nel monitoraggio con e senza agenti, Pandora FMS consente di controllare ogni componente della rete, indipendentemente dalla sua ubicazione.
Perché ho scelto Pandora FMS
Ciò che mi ha colpito di Pandora FMS è il suo forte supporto agli ambienti ibridi, fondamentale per i team che gestiscono risorse sia cloud che locali. La piattaforma offre un monitoraggio unificato per infrastrutture fisiche, virtuali e cloud da una singola console. Apprezzo il fatto che supporti sia il monitoraggio basato su agenti che quello senza agenti, offrendo flessibilità nella raccolta dati su sistemi diversi. Questo rende Pandora FMS una scelta pratica per le organizzazioni che devono collegare infrastrutture legacy con implementazioni cloud moderne.
Funzionalità principali di Pandora FMS
Altre funzionalità che rendono Pandora FMS utile per il monitoraggio delle reti in cloud includono:
- Sistema di allerta personalizzabile: Configura avvisi dettagliati basati su soglie, eventi o anomalie.
- Service mapping: Visualizza le dipendenze e le relazioni tra servizi e dispositivi di rete.
- Monitoraggio SNMP e WMI: Raccogli dati da una vasta gamma di dispositivi di rete e sistemi Windows.
- Motore di reportistica e analisi: Genera report programmati o su richiesta con dati storici e in tempo reale.
Integrazioni Pandora FMS
Le integrazioni includono Microsoft Azure, Amazon Web Services, VMware, Cisco, Slack e altri.
Pros and Cons
Pros:
- Potenti funzionalità multi-tenant per MSP
- Opzioni flessibili con e senza agenti
- Ampia personalizzazione tramite oltre 500 plugin
Cons:
- Configurazione e impostazione iniziali complesse
- Costo elevato per l'edizione Enterprise
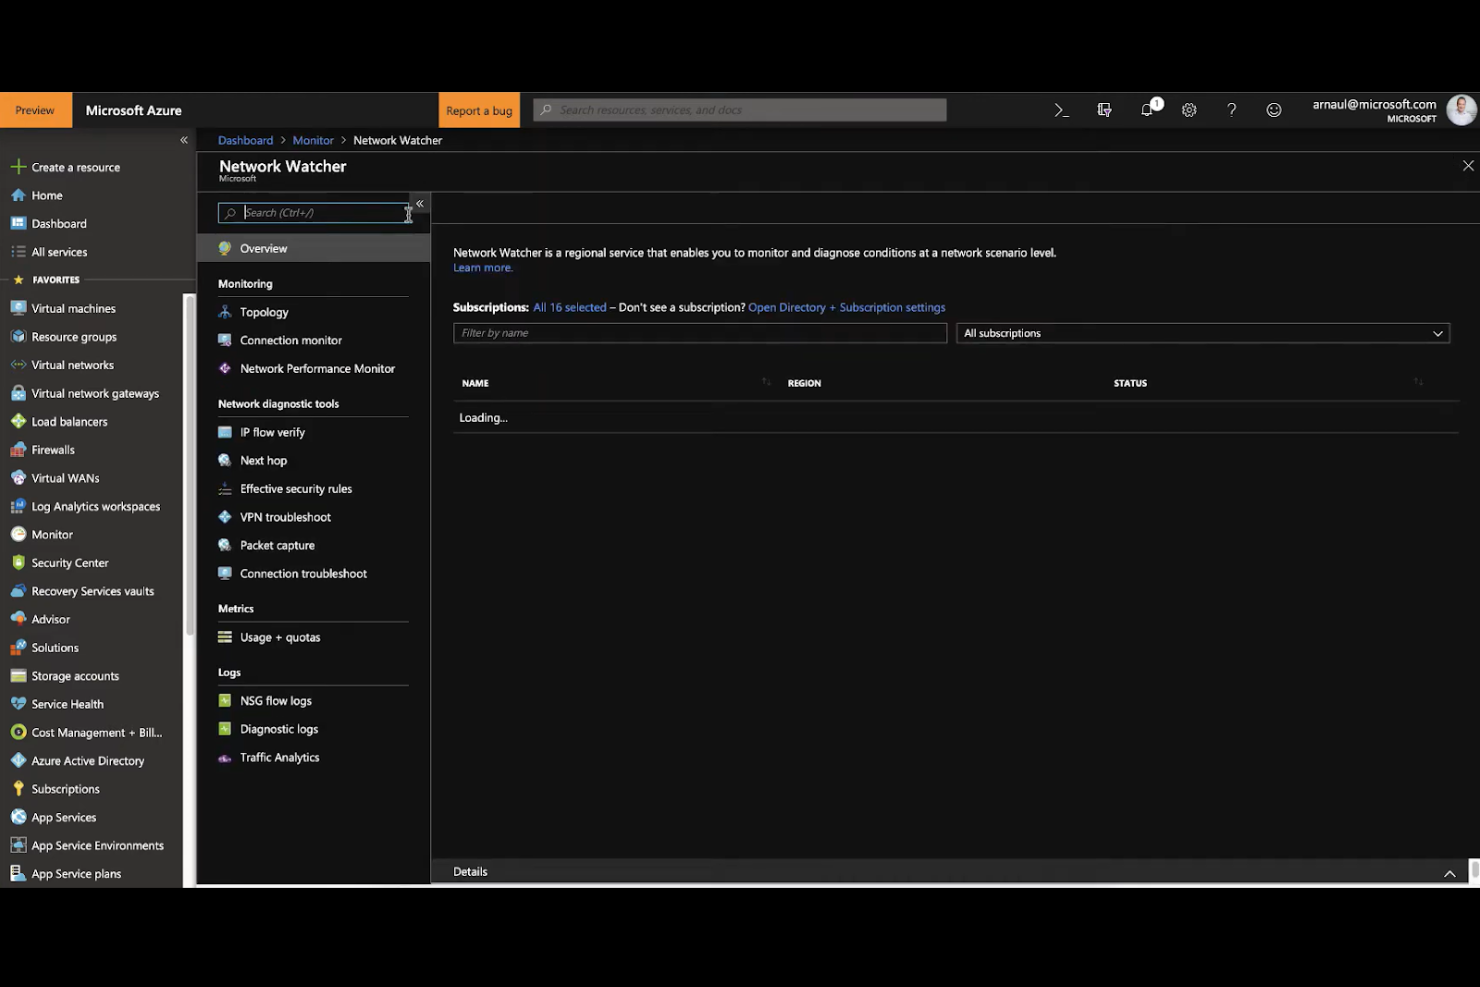
Se la tua organizzazione si affida a Microsoft Azure o ad altri servizi Microsoft, Azure Monitor offre un'integrazione profonda e nativa per il monitoraggio dell'infrastruttura basata su cloud. Questo strumento è particolarmente utile per i team IT che gestiscono ambienti ibridi o multi-cloud e desiderano una visibilità unificata su risorse Azure, macchine virtuali e applicazioni. Grazie al supporto integrato per i servizi Azure e agli approfondimenti automatici, Azure Monitor ti aiuta a monitorare le prestazioni, rilevare problemi e mantenere la conformità all'interno dell'ecosistema Microsoft.
Perché ho scelto Azure Monitor
Per i team già investiti nelle tecnologie Microsoft, Azure Monitor si distingue per la sua integrazione perfetta con l'intero ecosistema Microsoft. Puoi raccogliere, analizzare e agire sulla telemetria proveniente da risorse Azure, ambienti on-premises e persino da altre piattaforme cloud, tutto attraverso un'unica interfaccia. Mi piace il fatto che offra un monitoraggio integrato per servizi Azure, macchine virtuali e container, rendendo semplice mantenere la visibilità su ambienti complessi e distribuiti. Questo livello di integrazione nativa aiuta gli specialisti IT a ottimizzare il monitoraggio e la risoluzione dei problemi senza uscire dall'ambiente Microsoft.
Funzionalità principali di Azure Monitor
Altre funzionalità utili di Azure Monitor per il monitoraggio di rete includono:
- Workspace Log Analytics: Centralizza e interroga i dati di log provenienti da più fonti per analisi dettagliate.
- Avvisi intelligenti: Utilizza il machine learning per rilevare anomalie e attivare notifiche automaticamente.
- Dashboard personalizzati: Permette di creare visualizzazioni su misura per le esigenze di monitoraggio della rete.
- Accesso API: Abilita l'integrazione con strumenti esterni e flussi di lavoro di automazione personalizzata.
Integrazioni di Azure Monitor
Le integrazioni includono Microsoft Teams, Power BI, Azure Logic Apps, Azure Automation e PagerDuty.
Pros and Cons
Pros:
- Potente linguaggio di query Kusto (KQL)
- Approfondimenti automatici per PaaS e VM
- Scalabile per grossi carichi di lavoro aziendali
Cons:
- Il sistema di avvisi può diventare molto rumoroso
- L'interfaccia è spesso macchinosa e frammentata
Altri strumenti di monitoraggio della rete basati su cloud
Ecco altre opzioni di strumenti di monitoraggio rete basati su cloud che non sono entrate nella mia lista ristretta, ma che vale comunque la pena considerare:


Criteri di selezione degli strumenti di monitoraggio della rete basati su cloud
Nel selezionare i migliori strumenti di monitoraggio rete basati su cloud da includere in questa lista, ho considerato le esigenze comuni degli acquirenti e le principali criticità come la gestione di ambienti distribuiti e la riduzione dei tempi di inattività causati da problemi di rete. Ho anche utilizzato il seguente schema per mantenere la valutazione strutturata ed equa:
Funzionalità principali (25% del punteggio totale)
Per essere inserita in questa lista, ogni soluzione doveva soddisfare questi casi d’uso comuni:
- Monitorare i dispositivi e il traffico di rete in tempo reale
- Generare avvisi in caso di interruzioni o problemi di prestazioni
- Fornire report e analisi storiche
- Supportare ambienti di rete multi-sito o distribuiti
- Offrire accesso remoto sicuro alle dashboard di monitoraggio
Caratteristiche aggiuntive di rilievo (25% del punteggio totale)
Per restringere ulteriormente il campo, ho cercato anche funzionalità uniche, come ad esempio:
- Rilevamento automatico e mappatura della rete
- Rilevamento anomalie basato su intelligenza artificiale
- Widget e visualizzazioni dashboard personalizzabili
- Report di conformità e audit integrati
- Integrazione con le API dei fornitori di servizi cloud
Usabilità (10% del punteggio totale)
Per valutare la facilità d’uso di ogni sistema, ho preso in considerazione i seguenti aspetti:
- Interfaccia utente semplice e intuitiva
- Navigazione e struttura dei menu logica
- Visualizzazione chiara dello stato della rete
- Funzionalità principali raggiungibili con pochi clic
- Design reattivo per mobile e desktop
Onboarding (10% del punteggio totale)
Per valutare l'esperienza di onboarding di ciascuna piattaforma, ho preso in considerazione i seguenti aspetti:
- Disponibilità di guide di configurazione passo passo
- Accesso a video di formazione e documentazione
- Template predefiniti per i dispositivi di rete più comuni
- Tour o walkthrough interattivi del prodotto
- Chat dal vivo o webinar di onboarding
Assistenza clienti (10% del punteggio totale)
Per valutare i servizi di assistenza clienti di ciascun fornitore software, ho preso in considerazione i seguenti aspetti:
- Disponibilità di assistenza 24/7
- Molteplici canali di supporto come chat, email e telefono
- Accesso a una knowledge base ricercabile
- Tempi di risposta rapidi alle richieste di supporto
- Forum della community o gruppi di utenti
Rapporto qualità/prezzo (10% del punteggio totale)
Per valutare il rapporto qualità/prezzo di ciascuna piattaforma, ho preso in considerazione i seguenti aspetti:
- Struttura dei prezzi trasparente e prevedibile
- Piani flessibili per aziende di diverse dimensioni
- Nessuna tariffa nascosta o addebiti imprevisti
- Funzionalità incluse in ogni fascia di prezzo
- Disponibilità di prova gratuita o demo
Recensioni dei clienti (10% del punteggio totale)
Per avere un'idea della soddisfazione complessiva dei clienti, ho preso in considerazione i seguenti punti alla lettura delle recensioni:
- Feedback costante su affidabilità e uptime
- Commenti positivi su scalabilità e flessibilità
- Segnalazioni di supporto utile e competente
- Soddisfazione degli utenti su reportistica e analisi
- Feedback sull'integrazione con altri strumenti IT
Come scegliere gli strumenti di monitoraggio di rete basati sul cloud
È facile perdersi tra lunghe liste di funzionalità e strutture di prezzo complesse. Per aiutarti a rimanere concentrato durante il tuo esclusivo processo di selezione del software, ecco un elenco di fattori da tenere a mente:
| Fattore | Cosa considerare |
|---|---|
| Scalabilità | Lo strumento può gestire le dimensioni attuali e future della tua rete, incluse configurazioni multisito o ibride? Cerca un supporto comprovato per migliaia di dispositivi se necessario. |
| Integrazioni | Lo strumento si integra nativamente con il tuo stack IT esistente, come provider cloud, sistemi di ticketing o piattaforme SIEM? Verifica la presenza dei connettori richiesti. |
| Personalizzazione | Puoi personalizzare dashboard, avvisi e report secondo i flussi di lavoro e la terminologia della tua organizzazione? Evita strumenti che impongono template rigidi. |
| Facilità d’uso | Il tuo team sarà in grado di navigare e operare lo strumento senza una formazione approfondita? Verifica la presenza di menu logici e visualizzazioni chiare. |
| Implementazione e onboarding | Quanto tempo occorre per implementare e iniziare a monitorare? Chiedi informazioni su supporto alla migrazione, template disponibili e risorse di onboarding. |
| Costo | Le fasce di prezzo sono trasparenti e prevedibili man mano che la rete cresce? Fai attenzione ai costi nascosti legati al numero di dispositivi, alla conservazione dei dati o alle funzionalità avanzate. |
| Tutele per la sicurezza | Lo strumento offre crittografia, accesso basato sui ruoli e conformità agli standard del tuo settore? Verifica come vengono archiviati e trasmessi i dati. |
| Disponibilità del supporto | L’assistenza è disponibile quando ti serve, soprattutto durante gli incidenti? Controlla la presenza di supporto 24/7, SLA di risposta e percorsi di escalation. |
Cosa sono gli strumenti di monitoraggio di rete basati sul cloud?
Gli strumenti di monitoraggio di rete basati sul cloud sono piattaforme software che tracciano, analizzano e riportano lo stato di salute e le prestazioni dell’infrastruttura di rete utilizzando servizi ospitati nel cloud. Questi strumenti aiutano i team IT a monitorare dispositivi, traffico e connettività in ambienti distribuiti senza affidarsi all’hardware locale. Offrono visibilità in tempo reale, avvisi automatici e analisi storiche per supportare una gestione proattiva della rete e una risposta rapida agli incidenti.
Funzionalità
Quando valuti gli strumenti di monitoraggio di rete cloud, presta attenzione alle seguenti caratteristiche chiave:
- Monitoraggio in tempo reale: Tiene traccia continuamente dei dispositivi di rete, delle connessioni e del traffico per fornire dati aggiornati su stato e prestazioni.
- Notifiche automatizzate: Invia avvisi quando vengono rilevati problemi di rete, interruzioni o superamenti di soglia, così i team possono rispondere tempestivamente.
- Dashboard personalizzabili: Consentono agli utenti di creare panoramiche visive sulla salute della rete, lo stato dei dispositivi e i principali indicatori attraverso widget e grafici configurabili.
- Reportistica storica: Archivia e analizza dati di rete passati per aiutare a identificare trend, problemi ricorrenti e variazioni delle prestazioni nel tempo.
- Supporto multi-sede: Monitora dispositivi e connessioni in più sedi o ambienti cloud da un'unica interfaccia.
- Scoperta dei dispositivi: Scansiona e identifica automaticamente nuovi dispositivi nella rete, riducendo la configurazione manuale e garantendo una visibilità completa.
- Controllo accessi basato sui ruoli: Limita le autorizzazioni degli utenti in base ai ruoli, contribuendo a mantenere la sicurezza e la conformità tra i team.
- Capacità di integrazione: Connette altri strumenti di gestione IT, sistemi di ticketing o servizi cloud per centralizzare i flussi di lavoro e i dati.
- Mappatura della rete: Rappresenta visivamente la topologia della rete, mostrando come dispositivi e connessioni sono correlati per facilitare la risoluzione dei problemi e la pianificazione.
Vantaggi
L'implementazione di strumenti di monitoraggio della rete basati su cloud offre numerosi vantaggi per il tuo team e la tua azienda. Ecco alcuni benefici a cui puoi aspirare:
- Visibilità centralizzata: Monitora tutti i dispositivi e le sedi di rete da un'unica dashboard accessibile dal cloud, rendendo più facile la gestione di ambienti distribuiti.
- Risposta più rapida agli incidenti: Avvisi automatici e monitoraggio in tempo reale aiutano il team a rilevare e risolvere i problemi prima che si aggravino.
- Riduzione dei costi di infrastruttura: Elimina la necessità di hardware di monitoraggio in sede e manutenzione grazie ai servizi ospitati nel cloud.
- Scalabilità: Espandi facilmente la copertura di monitoraggio con la crescita della rete, senza dover apportare grandi modifiche alla configurazione esistente.
- Collaborazione migliorata: Accesso basato sui ruoli e dashboard remote consentono a più membri del team di lavorare insieme, ovunque si trovino.
- Informazioni storiche: L'accesso a report e analisi di lungo periodo supporta una migliore pianificazione, risoluzione dei problemi e gestione della capacità.
- Integrazione con i flussi di lavoro IT: Collega i dati di monitoraggio con strumenti di ticketing, automazione o gestione cloud per semplificare le operazioni e la gestione degli incidenti.
Costi e prezzi
La scelta di strumenti di monitoraggio della rete basati su cloud richiede la comprensione dei diversi modelli di prezzo e piani disponibili. Alcuni fornitori offrono soluzioni gratuite di monitoraggio di rete, mentre altri riservano l'accesso completo agli abbonamenti a pagamento. I costi variano in base a funzionalità, dimensione del team, componenti aggiuntivi e molto altro.
La tabella seguente riassume i piani più comuni, i prezzi medi e le caratteristiche tipiche incluse nelle soluzioni di strumenti di monitoraggio della rete basati su cloud:
Tabella di confronto dei piani per strumenti di monitoraggio della rete basati su cloud
| Tipo di piano | Prezzo medio | Caratteristiche comuni |
|---|---|---|
| Piano gratuito | $0 | Monitoraggio di base dei dispositivi, notifiche limitate, supporto della community e accesso a dashboard standard. |
| Piano personale | $5-$19/user/month | Monitoraggio per un numero limitato di dispositivi, reportistica di base, notifiche email e accesso monoutente. |
| Piano business | $40-$100/user/month | Monitoraggio multi-sede, report avanzati, integrazioni, accesso basato sui ruoli e supporto prioritario. |
| Piano enterprise | $120-$300/user/month | Monitoraggio illimitato dei dispositivi, dashboard personalizzate, accesso API, caratteristiche di conformità e supporto 24/7. |
Domande frequenti sugli strumenti di monitoraggio della rete basati su cloud
Ecco alcune risposte alle domande più comuni sugli strumenti di monitoraggio della rete basati su cloud:
In cosa differiscono gli strumenti di monitoraggio della rete basati su cloud dalle soluzioni on-premise?
Gli strumenti di monitoraggio della rete basati su cloud operano su server remoti e vengono utilizzati tramite un’interfaccia web, mentre le soluzioni on-premise richiedono l’installazione di hardware e software locali. I tool cloud offrono accesso remoto facilitato, implementazione più rapida e riduzione della manutenzione, ma richiedono un’attenta valutazione delle esigenze in materia di privacy e conformità dei dati.
Gli strumenti di monitoraggio su cloud sono in grado di gestire ambienti ibridi o multi-cloud?
Sì, la maggior parte degli strumenti di monitoraggio della rete su cloud sono progettati per monitorare reti on-premise, ibride e multi-cloud da un’unica dashboard. Scegli strumenti che supportano integrazioni con i principali provider cloud e offrono un rilevamento flessibile dei dispositivi nei diversi ambienti.
Quali considerazioni di sicurezza bisogna tenere presenti utilizzando strumenti di monitoraggio su cloud?
Dovresti assicurarti che lo strumento utilizzi la crittografia per i dati in transito e a riposo, supporti i controlli di accesso basati sui ruoli e sia conforme ai principali standard di settore. Chiedi ai fornitori informazioni su localizzazione dei dati, politiche di conservazione e procedure di risposta agli incidenti.
Quanto velocemente può essere implementato uno strumento di monitoraggio di rete su cloud dal mio team?
La maggior parte degli strumenti di monitoraggio della rete su cloud può essere implementata in poche ore o giorni, a seconda della complessità della rete e delle esigenze d’integrazione. Molti offrono rilevamento automatico dei dispositivi, procedure guidate d’installazione e risorse per l’onboarding per velocizzare il processo.
Che tipi di supporto sono normalmente disponibili per gli strumenti di monitoraggio di rete su cloud?
Alcuni provider includono piani gratuiti di monitoraggio della rete, mentre altri riservano le funzionalità complete solo agli abbonamenti a pagamento. Le opzioni di supporto includono solitamente email, chat dal vivo, telefono e una knowledge base consultabile. Alcuni offrono anche webinar per l’onboarding, forum comunitari e supporto 24/7 per i piani di livello superiore. Controlla sempre i tempi di risposta e le procedure di escalation prima di scegliere uno strumento.
Cosa succede dopo:
Se stai valutando strumenti per il monitoraggio della rete su cloud, contatta un consulente SoftwareSelect per ricevere raccomandazioni gratuite.
Compila un modulo e fai una breve chiacchierata nella quale spieghi le specifiche delle tue esigenze. Riceverai così una rosa di software da valutare. Ti accompagneranno anche durante tutto il processo d'acquisto, incluse le negoziazioni sul prezzo.