I 10 migliori strumenti per il monitoraggio delle prestazioni per SaaS

10 Migliori strumenti di monitoraggio delle prestazioni - Shortlist


Gli strumenti di monitoraggio delle prestazioni ti aiutano a tenere traccia di come funzionano i tuoi sistemi e le tue applicazioni, così puoi individuare tempestivamente i problemi e mantenere tutto efficiente.
Molti team cercano questi strumenti quando affrontano tempi di caricamento lenti, prestazioni imprevedibili o difficoltà nell'individuare la causa principale dei problemi. Senza lo strumento giusto rischi di passare ore a inseguire avvisi poco chiari o di trascurare completamente eventuali cali di performance.
Ho aiutato diversi team a implementare sistemi di monitoraggio delle prestazioni che forniscono dati utili e riducono le supposizioni. Questa guida nasce da quell'esperienza per aiutarti a scegliere uno strumento che si adatti al tuo flusso di lavoro e ti permetta di restare aggiornato su ciò che conta davvero.
Table of Contents
- Migliori software selezionati
- Perché fidarsi di noi
- Confronta le specifiche
- Recensioni
- Altri strumenti per il monitoraggio delle prestazioni
- Recensioni correlate
- Criteri di selezione
- Come scegliere
- Cosa sono gli strumenti di monitoraggio delle prestazioni?
- Funzionalità
- Vantaggi
- Costi e prezzi
- Domande frequenti
Perché Fidarti delle Nostre Recensioni Software
Testiamo e recensiamo software dal 2023. Come leader tecnologici, sappiamo quanto sia cruciale e difficile prendere la decisione giusta nella scelta di un software.
Investiamo in una ricerca approfondita per aiutare il nostro pubblico a effettuare scelte migliori di acquisto software. Abbiamo testato oltre 2.000 strumenti per diversi casi d’uso tecnologici e scritto più di 1.000 recensioni complete. Scopri come restiamo trasparenti e la nostra metodologia di recensione del software.
Riepilogo dei migliori strumenti di monitoraggio delle prestazioni
Questa tabella di confronto riassume i dettagli sui prezzi delle migliori soluzioni di monitoraggio delle prestazioni per aiutarti a trovare quella più adatta al tuo budget e alle esigenze della tua azienda.
| Tool | Best For | Trial Info | Price | ||
|---|---|---|---|---|---|
| 1 | Ideale per la mappatura automatica della rete | Prova gratuita di 14 giorni + demo gratuita disponibile | Prezzi su richiesta | Website | |
| 2 | Ideale per insight tramite session replay | Piano gratuito + prova gratuita + demo gratuita disponibili | A partire da $26/mese (fatturazione annuale) | Website | |
| 3 | Ideale per il monitoraggio di cloud ibridi | Prova gratuita di 30 giorni + demo gratuita disponibile | Da $9/utente/mese (fatturazione annuale) | Website | |
| 4 | Ideale per approfondimenti a livello di codice | Prova gratuita di 30 giorni + demo gratuita + piano gratuito disponibile | A partire da $199/anno | Website | |
| 5 | Ideale per il monitoraggio delle prestazioni di rete | Demo gratuita disponibile | A partire da $245/25 dispositivi | Website | |
| 6 | Ideale per il tracciamento degli errori in tempo reale | Prova gratuita di 14 giorni + demo gratuita disponibile | Da $12/utente/mese (fatturazione annuale) | Website | |
| 7 | Ideale per informazioni su uptime e velocità dei siti web | Prova gratuita di 30 giorni + demo disponibile | Da $10/utente/mese (fatturazione annuale) | Website | |
| 8 | Ideale per il monitoraggio completo dell'infrastruttura IT | Piano gratuito e demo gratuita disponibili | Da $20/utente/mese (fatturato annualmente) | Website | |
| 9 | Ideale per il monitoraggio automatico delle infrastrutture ibride | Prova gratuita di 15 giorni | Da $89/utente/mese (fatturazione annuale) | Website | |
| 10 | Ideale per il tracciamento end-to-end delle transazioni di business | Prova gratuita disponibile | Da $90/utente/mese (fatturazione annuale) | Website |
-

TestDevLab
Visit Website -
Site24x7
Visit WebsiteThis is an aggregated rating for this tool including ratings from Crozdesk users and ratings from other sites.4.7 -
GitHub Actions
Visit WebsiteThis is an aggregated rating for this tool including ratings from Crozdesk users and ratings from other sites.4.8


Recensioni dei migliori strumenti di monitoraggio delle prestazioni
Di seguito trovi i miei riepiloghi dettagliati degli strumenti di monitoraggio delle prestazioni che ho selezionato per la shortlist. Le recensioni offrono una panoramica approfondita delle principali funzionalità, dei pro e contro, delle integrazioni e degli utilizzi ideali di ogni soluzione per aiutarti a trovare la più adatta alle tue esigenze.

Auvik è uno strumento di gestione della rete che offre funzionalità di monitoraggio delle prestazioni per aiutarti a tenere traccia delle prestazioni della rete e ottimizzare la tua infrastruttura. È progettato per offrirti una visione chiara dello stato di salute della rete, consentendoti di identificare e risolvere rapidamente i problemi.
Perché ho scelto Auvik: Uno dei motivi per cui ho scelto Auvik come strumento di monitoraggio delle prestazioni è la sua capacità di mappare automaticamente dispositivi e connessioni. Questa funzione ti permette di visualizzare l’intera topologia della rete, facilitando l’individuazione dei possibili punti critici. Inoltre, Auvik monitora la salute dell’hardware e tiene traccia delle metriche di prestazione su diversi tipi di dispositivi di oltre 700 fornitori, garantendo dati completi per mantenere la rete efficiente. Un’altra caratteristica distintiva sono gli avvisi personalizzabili di Auvik. Questi ti consentono di impostare soglie specifiche e ricevere notifiche quando qualcosa va storto, così sei sempre aggiornato e puoi intervenire tempestivamente. La piattaforma supporta anche la gestione remota e i backup delle configurazioni, il che significa che puoi gestire la rete ovunque ti trovi e assicurarti che i dati siano sicuri e recuperabili.
Funzionalità e integrazioni principali:
Le funzionalità includono una mappatura di rete intuitiva, che offre una rappresentazione visiva della struttura della rete, aiutandoti a comprenderne rapidamente la configurazione. Auvik offre anche impostazioni globali degli avvisi, consentendo di configurare facilmente gli alert su tutta la rete. Inoltre, la piattaforma supporta i confronti di configurazione, permettendoti di tracciare le modifiche e individuare possibili problemi prima che diventino critici. Le integrazioni includono ConnectWise, Cisco, Datto, ServiceNow, Slack, Microsoft Intune, Salesforce, Fortinet, Sophos, Splunk, Palo Alto Networks e Zendesk.
Pros and Cons
Pros:
- Il monitoraggio in tempo reale migliora il controllo delle prestazioni
- I backup automatici delle configurazioni garantiscono la sicurezza dei dati
- La mappatura della rete migliora l'efficienza nella risoluzione dei problemi
Cons:
- Opzioni di personalizzazione limitate per gli utenti
- Consuma molte risorse su grandi implementazioni
New Product Updates from Auvik
Auvik Adds Aurora Troubleshooting Assistance
Auvik introduces Aurora Troubleshooting Assistance with AI-powered troubleshooting guidance, possible root causes, conversation downloads, and feedback tools. The open beta helps IT teams diagnose network issues faster with contextual recommendations tailored to specific devices and alerts. For more information, visit Auvik's official site.
 .
.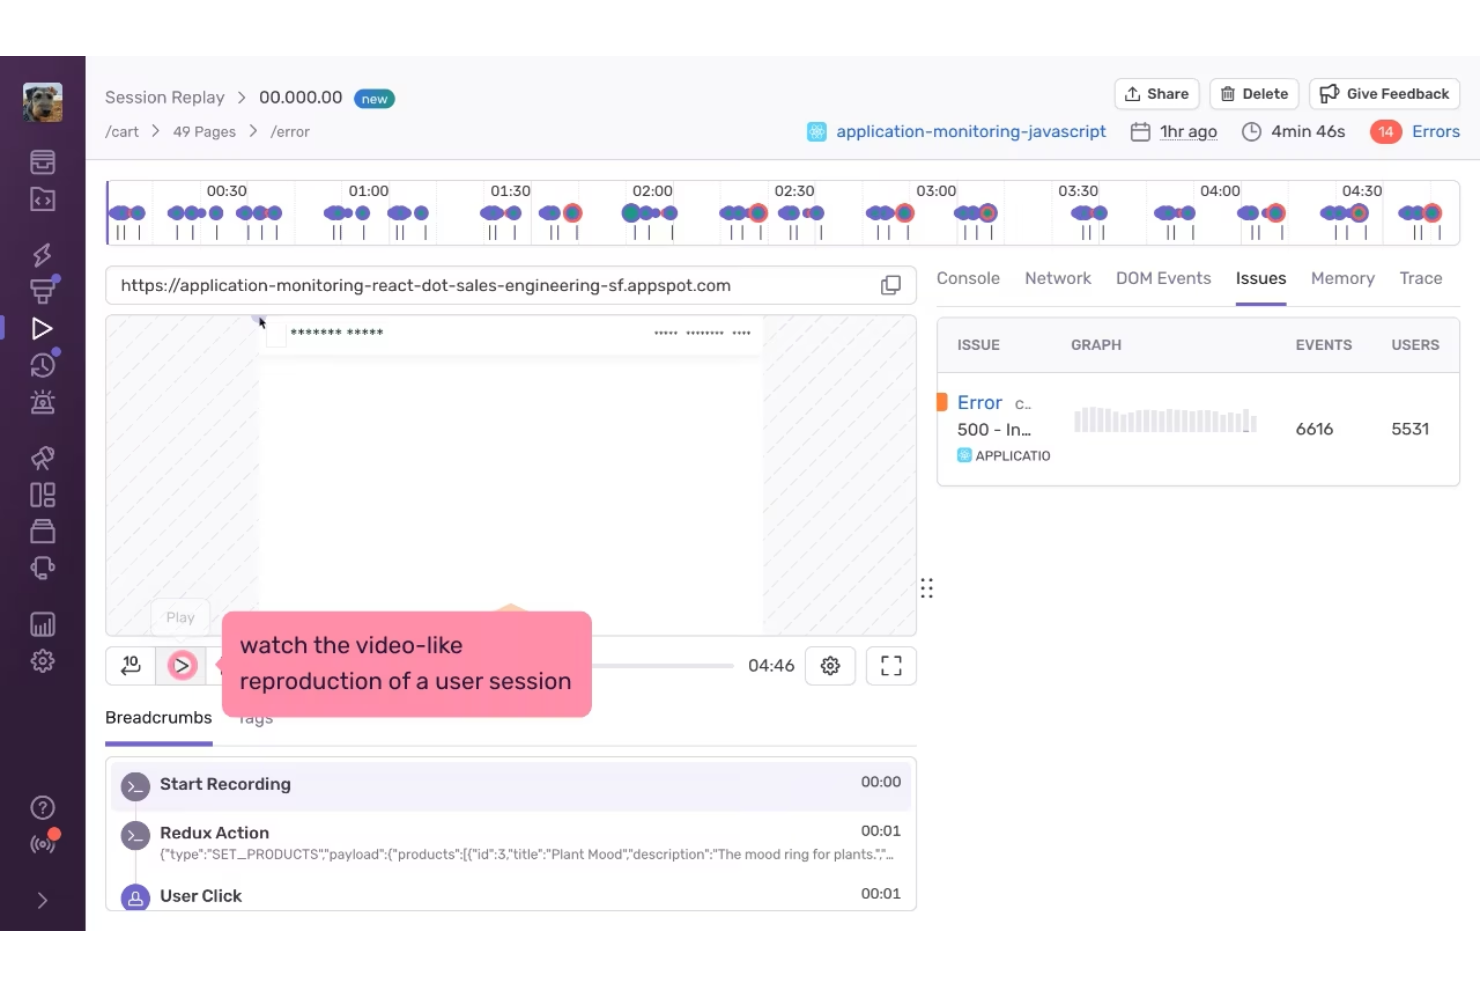
Sentry è uno strumento di monitoraggio delle prestazioni utilizzato da sviluppatori e aziende per comprendere il comportamento delle proprie applicazioni nell'uso reale, con ulteriori informazioni ottenute dal replay delle sessioni. Offre strumenti di rilevamento errori, tracciamento e replay che aiutano i team a vedere dove gli utenti incontrano problemi e rallentamenti. Fornendo una visibilità più chiara sui problemi di prestazioni, Sentry aiuta i team a ridurre i tempi di inattività e a migliorare l'esperienza complessiva dell'utente.
Perché ho scelto Sentry
Ho scelto Sentry per le sue funzionalità di session replay, che consentono ai team di vedere esattamente cosa sperimentano gli utenti quando si verificano problemi di prestazioni. Ciò rende più semplice collegare errori e rallentamenti alle azioni reali degli utenti, invece di affidarsi solamente a log o metriche. Abbinato al rilevamento errori e al tracciamento, Sentry aiuta i team a identificare e risolvere i problemi più rapidamente, offrendo un contesto più chiaro.
Funzionalità principali di Sentry
Oltre alle informazioni ricavate dal session replay, Sentry offre:
- Copertura del codice: Fornisce informazioni su quali parti del codice sono testate, aiutando a dare priorità ai test e a snellire il lavoro di sviluppo.
- Report dei crash delle app mobili: Supporta le piattaforme mobile identificando e risolvendo i problemi di crash, garantendo un'esperienza utente fluida sui dispositivi mobili.
- Osservabilità AI: Monitora le applicazioni AI, facilitando il rilevamento e la risoluzione di problemi di prestazioni specifici delle funzionalità guidate dall'intelligenza artificiale.
Integrazioni Sentry
Le integrazioni includono GitHub, Slack, Jira, Bitbucket, Trello, GitLab, PagerDuty, Microsoft Teams e Asana.
Pros and Cons
Pros:
- Gli avvisi aiutano i team a rispondere rapidamente ai problemi critici
- Robusto rilevamento degli errori con tracce dello stack ben chiare
- Il session replay aiuta i team a comprendere i problemi dal punto di vista dell’utente
Cons:
- Il session replay può richiedere una configurazione attenta per gestire volume dei dati e privacy
- Non è una piattaforma completa di monitoraggio dell’infrastruttura o osservabilità
New Product Updates from Sentry

Sentry Adds Heatmaps to Application Metrics
Sentry introduced heatmaps for Application Metrics to visualize metric value distributions over time, helping teams spot patterns like latency bursts and use heatmaps in Custom Dashboards. For more information, visit Sentry's official site.
 .
.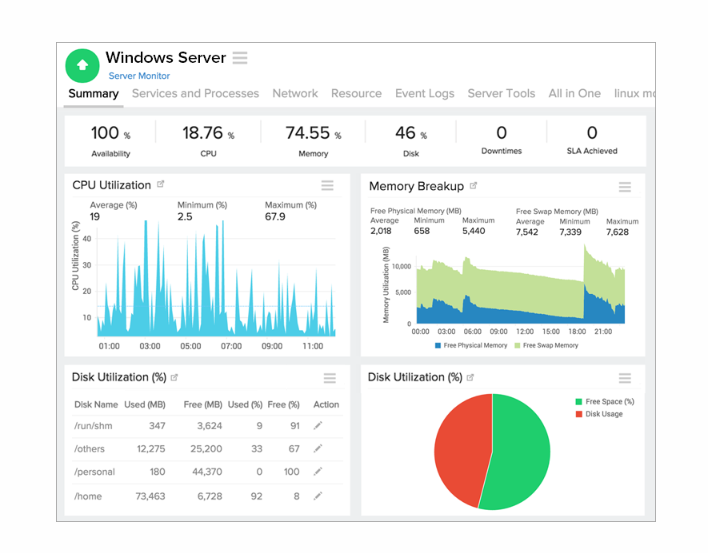
Site24x7 offre alle aziende uno strumento completo per monitorare gli ambienti cloud ibridi, garantendo prestazioni ottimali e massima disponibilità. Data la crescente adozione di architetture cloud ibride da parte delle aziende, gli strumenti specializzati di Site24x7 colmano una nicchia fondamentale monitorando in modo coeso sia le componenti locali che quelle in cloud.
Perché ho scelto Site24x7: Dopo aver confrontato diversi strumenti di monitoraggio, Site24x7 si è distinto per la sua attenzione specifica agli ambienti cloud ibridi. Ho riscontrato che la sua capacità di monitorare in modo olistico infrastrutture sia locali che su cloud lo distingue dai suoi concorrenti. Questo approccio unico è il motivo per cui considero Site24x7 la scelta migliore per le organizzazioni che desiderano supervisionare le proprie soluzioni cloud ibride.
Funzionalità e integrazioni principali:
Site24x7 offre funzionalità come metriche prestazionali in tempo reale, automazione della risoluzione degli incidenti e avanzate capacità AIOps. Per quanto riguarda le integrazioni, la piattaforma si collega facilmente con i principali fornitori di servizi cloud, come AWS, Microsoft Azure e Google Cloud, facilitando un controllo più ampio su vari servizi.
Pros and Cons
Pros:
- Progettato appositamente per ambienti cloud ibridi
- Automazione della risoluzione degli incidenti che riduce l'intervento manuale
- Potenti funzionalità AIOps per insight avanzati
Cons:
- Alcune funzionalità avanzate di monitoraggio sono disponibili solo nei piani premium
- La configurazione iniziale può richiedere un periodo di apprendimento
- L'interfaccia dei report potrebbe essere più intuitiva per alcuni utenti
New Product Updates from Site24x7

Site24x7 Adds Discovery Issues for AWS Monitoring
Site24x7 added Discovery Issues for AWS monitoring, helping teams identify why resources are not being discovered across services and regions. The feature surfaces permission gaps, policy restrictions, and blocked API actions to support faster troubleshooting. For more information, visit Site24x7’s official site.
 .
.Ideale per approfondimenti a livello di codice

ManageEngine Applications Manager è una soluzione di monitoraggio delle prestazioni e osservabilità che offre una visibilità completa sull’intero stack di applicazioni cloud e on-premise. Supporta oltre 150 tecnologie, aiutando i team IT a rilevare e risolvere i colli di bottiglia delle prestazioni prima che influiscano sugli utenti.
Perché ho scelto ManageEngine Applications Manager: Apprezzo la sua capacità di fornire diagnostica approfondita tramite analisi a livello di codice e tracciamento distribuito delle transazioni. Puoi monitorare le prestazioni delle applicazioni in vari linguaggi di programmazione, tra cui Java, .NET, Python e Ruby. Con le mappe dei servizi applicativi, ottieni una visione chiara delle dipendenze, aiutando il tuo team a individuare transazioni lente e ottimizzare l’esecuzione del codice. Inoltre, il monitoraggio reale degli utenti offre metriche dettagliate sulle prestazioni front-end basate sul traffico reale, inclusi tempi di risposta per area geografica, browser e rete.
Funzionalità e integrazioni principali:
Altre funzionalità includono il monitoraggio sintetico delle transazioni, che simula le interazioni degli utenti utilizzando script di test basati su Selenium per verificare proattivamente le prestazioni del sito da più località. Inoltre, la scoperta automatizzata e la mappatura delle dipendenze ti aiutano a visualizzare le relazioni tra applicazioni, database e servizi, aggiornandosi dinamicamente al variare dell’ambiente. Le integrazioni includono ManageEngine ServiceDesk Plus, ServiceNow, Site24x7, AlarmsOne, Slack, Prometheus, AWS, Google Cloud, Microsoft Azure, Oracle e MySQL.
Pros and Cons
Pros:
- Monitora un’ampia gamma di applicazioni e componenti dell’infrastruttura
- Il sistema di allerta in tempo reale aiuta i team a rispondere prontamente ai problemi
- Semplifica la gestione delle applicazioni e delle loro relazioni
Cons:
- La configurazione dello strumento per esigenze specifiche può essere complessa
- Lo strumento può richiedere molte risorse
New Product Updates from ManageEngine Applications Manager
Oracle Cloud Application Monitoring Now Available in ManageEngine Applications Manager
ManageEngine Applications Manager introduces Oracle Cloud Application Monitoring, Oracle Cloud Function Monitoring, and Oracle Cloud NAT Gateway Monitoring. These new capabilities help teams monitor Oracle Cloud applications, serverless workloads, and network resources from a single platform. For more information, visit ManageEngine Applications Manager's official site.
 .
.Ideale per il monitoraggio delle prestazioni di rete
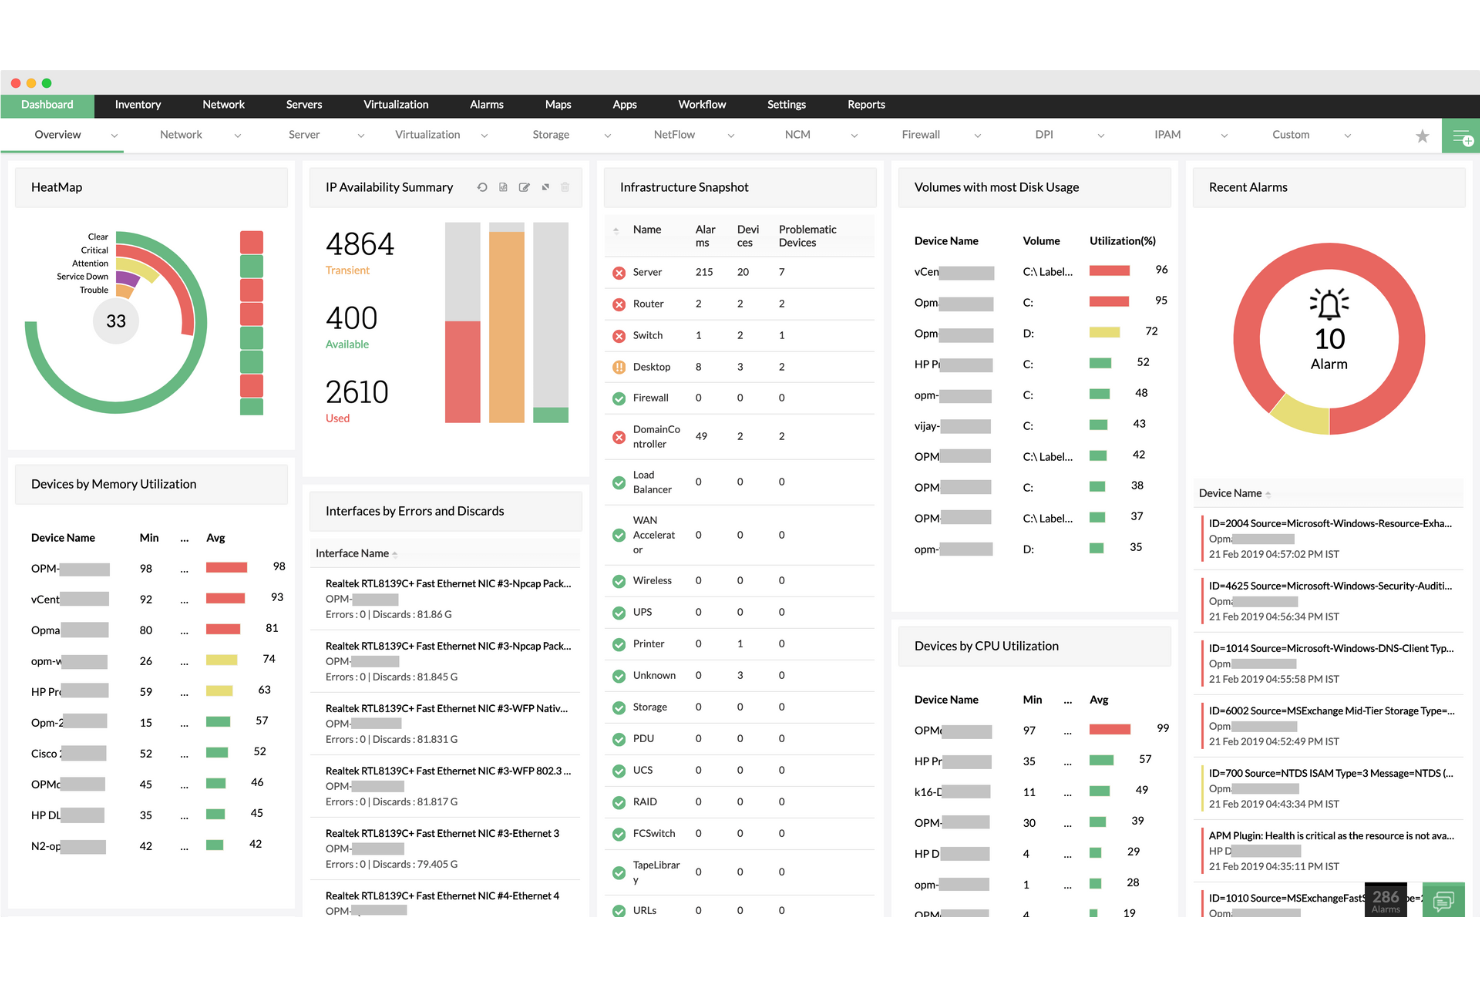
ManageEngine OpManager è uno strumento di monitoraggio delle prestazioni di rete che ti aiuta a tenere sotto controllo la salute e le prestazioni della tua rete. Monitora dispositivi come router, switch, server e macchine virtuali per garantirne il buon funzionamento.
Perché ho scelto ManageEngine OpManager: Ho scelto OpManager per la sua capacità di monitorare in tempo reale le prestazioni della rete. Tiene traccia di metriche importanti come latenza, perdita di pacchetti e tempi di risposta, offrendoti una visione chiara dello stato della tua rete. Questo monitoraggio in tempo reale ti permette di rilevare e affrontare rapidamente eventuali problemi, aiutando a prevenire tempi di inattività e a mantenere operative le tue attività. Apprezzo anche il fatto che OpManager offra oltre 100 report integrati che puoi personalizzare in base alle tue esigenze, fornendo approfondimenti su disponibilità della rete, tendenze di utilizzo e analisi delle prestazioni.
Funzionalità e integrazioni principali:
Altre funzionalità includono l'analisi del traffico di rete, che permette di monitorare l'utilizzo della banda e di identificare i principali utilizzatori, e la gestione della configurazione di rete, che consente di programmare backup delle configurazioni e tracciare le modifiche. Offre anche la gestione degli indirizzi IP e delle porte degli switch, aiutandoti a gestire gli indirizzi IP e a mappare le porte degli switch ai dispositivi. Alcune integrazioni includono ADManager Plus, ADAudit Plus, ADSelfService Plus, M365 Manager Plus, PAM360, Password Manager Pro, ServiceDesk Plus e Log360.
Pros and Cons
Pros:
- Scalabilità per reti in crescita
- Avvisi in tempo reale
- Capacità di monitoraggio complete
Cons:
- Potrebbe offrire più opzioni di integrazione
- Configurazione iniziale complessa
New Product Updates from ManageEngine OpManager
ManageEngine OpManager Vendor Templates and NCM XML Import
ManageEngine OpManager introduces enhanced vendor template integration and device template import for the NCM module using XML files. This update helps teams improve device classification and speed up configuration workflows. For more information, visit ManageEngine OpManager’s official site.
 .
.
Atatus si specializza nel fornire agli utenti una comprensione chiara e immediata degli errori nel momento in cui si verificano, così non ci sono ritardi nella risoluzione dei problemi. Questo strumento eccelle nella capacità di rilevare errori in tempo reale, offrendo chiarezza e azioni rapide quando i sistemi si bloccano o si interrompono.
Perché ho scelto Atatus: Tra tutti gli strumenti che ho valutato, Atatus mi ha colpito per la sua attenzione esclusiva al rilevamento degli errori in tempo reale. Ho scelto Atatus perché, a mio avviso, offre un vantaggio evidente nel monitoraggio istantaneo degli errori, distinguendosi da molti altri strumenti di monitoraggio. Il punto di forza principale risiede nella capacità di ridurre i tempi di inattività e massimizzare l'efficienza operativa, motivo per cui l'ho ritenuto il migliore per il rilevamento degli errori in tempo reale.
Funzionalità principali & integrazioni:
Atatus offre metriche sulle prestazioni delle applicazioni oltre al tracciamento degli errori, permettendo agli utenti di avere una visione completa dello stato di salute delle applicazioni. Il sistema di avvisi è sia tempestivo che personalizzabile, così le persone giuste vengono informate immediatamente di eventuali problemi. Sul fronte delle integrazioni, Atatus supporta una gamma di piattaforme tra cui Slack, JIRA e Webhooks, consentendo una comunicazione efficiente e una rapida risoluzione dei problemi all'interno dei team.
Pros and Cons
Pros:
- Rilevamento e avvisi degli errori immediati
- Metriche complete sulle prestazioni delle applicazioni
- Ampia gamma di integrazioni per la comunicazione del team
Cons:
- Potrebbe richiedere configurazioni per ambienti specifici
- Un'interfaccia potrebbe sembrare complessa per i principianti
- Funzionalità limitate nel piano base

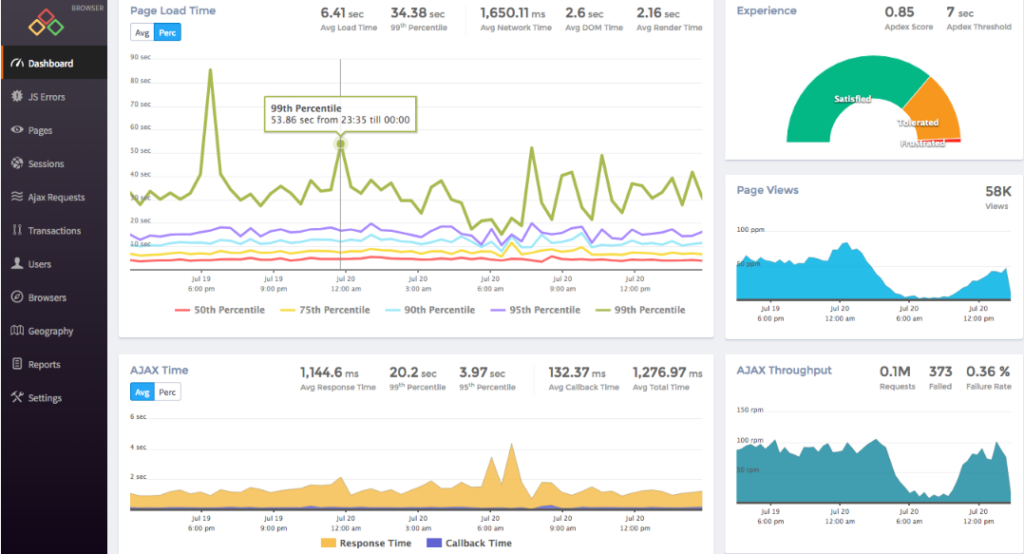
Pingdom fornisce alle aziende preziose informazioni sulla disponibilità online, sulle prestazioni e sulla velocità dei siti web. Riconoscendo che l’accessibilità e la rapidità di caricamento di un sito possono influenzare notevolmente l’esperienza utente e le conversioni, Pingdom offre strumenti specializzati per monitorare queste metriche fondamentali.
Perché ho scelto Pingdom: Nel corso della mia valutazione degli strumenti per il monitoraggio dei siti web, Pingdom è emerso costantemente come leader di settore. Ho scelto Pingdom soprattutto perché è specializzato nel fornire metriche precise su uptime e velocità, elementi essenziali per qualsiasi attività online. La profondità e l’accuratezza delle sue analisi confermano il mio giudizio che sia il migliore per ottenere dati chiari su velocità e disponibilità del sito web.
Funzionalità chiave e integrazioni:
Pingdom spicca per il suo monitoraggio delle prestazioni in tempo reale, offrendo avvisi istantanei non appena vengono rilevati problemi. La funzione di analisi delle cause alla radice offre informazioni preziose per risolvere tempestivamente eventuali difficoltà. Sul fronte integrazioni, Pingdom supporta diverse piattaforme, tra cui Slack, Opsgenie e PagerDuty, assicurando che i team siano immediatamente informati su eventuali discrepanze.
Pros and Cons
Pros:
- Monitoraggio in tempo reale e avvisi immediati
- Analisi approfondita delle cause per una rapida risoluzione dei problemi
- Supporta molteplici integrazioni per una migliore comunicazione del team
Cons:
- L'interfaccia potrebbe essere leggermente complessa per i principianti
- Limitazioni sul numero di controlli nei piani base
- Alcune funzionalità avanzate sono disponibili solo nei piani più costosi
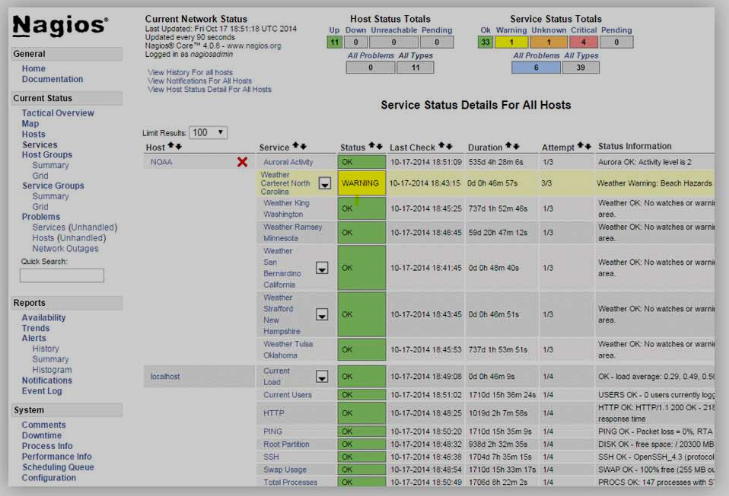
Con Nagios, gli utenti ottengono una panoramica a tutto tondo della loro intera infrastruttura IT, assicurandosi che ogni componente, dai server alle applicazioni, funzioni in modo ottimale. Riconoscendo il ruolo fondamentale di un'infrastruttura IT affidabile nelle aziende moderne, Nagios ha personalizzato il proprio strumento per offrire una soluzione di monitoraggio olistica.
Perché ho scelto Nagios: Nel mio percorso di valutazione degli strumenti di monitoraggio, Nagios è sempre risultato tra i migliori candidati. Ho scelto Nagios per il suo approccio completo al monitoraggio dell'infrastruttura IT, garantendo che nessun componente venga trascurato.
Questa natura onnicomprensiva è il motivo per cui ritengo Nagios ideale per le aziende che desiderano una supervisione approfondita dell'infrastruttura IT.
Funzionalità principali e integrazioni:
Nagios eccelle nella fornitura di report sia visivi che dettagliati, offrendo ai team IT una chiara visione dello stato di salute della loro infrastruttura. Il suo sistema di avvisi è particolarmente robusto, notificando immediatamente i team in caso di potenziali interruzioni. Sul fronte delle integrazioni, Nagios supporta una varietà di plugin ed è sostenuto da una comunità attiva, garantendo compatibilità con una vasta gamma di sistemi e strumenti.
Pros and Cons
Pros:
- Capacità di reportistica dettagliata e visiva
- Sistema di avvisi proattivo per una risoluzione tempestiva dei problemi
- Ampio supporto ai plugin e comunità attiva
Cons:
- La configurazione iniziale può risultare complessa per i nuovi arrivati
- L'interfaccia può sembrare datata ad alcuni utenti
- Richiede una manutenzione costante per prestazioni ottimali
Ideale per il monitoraggio automatico delle infrastrutture ibride
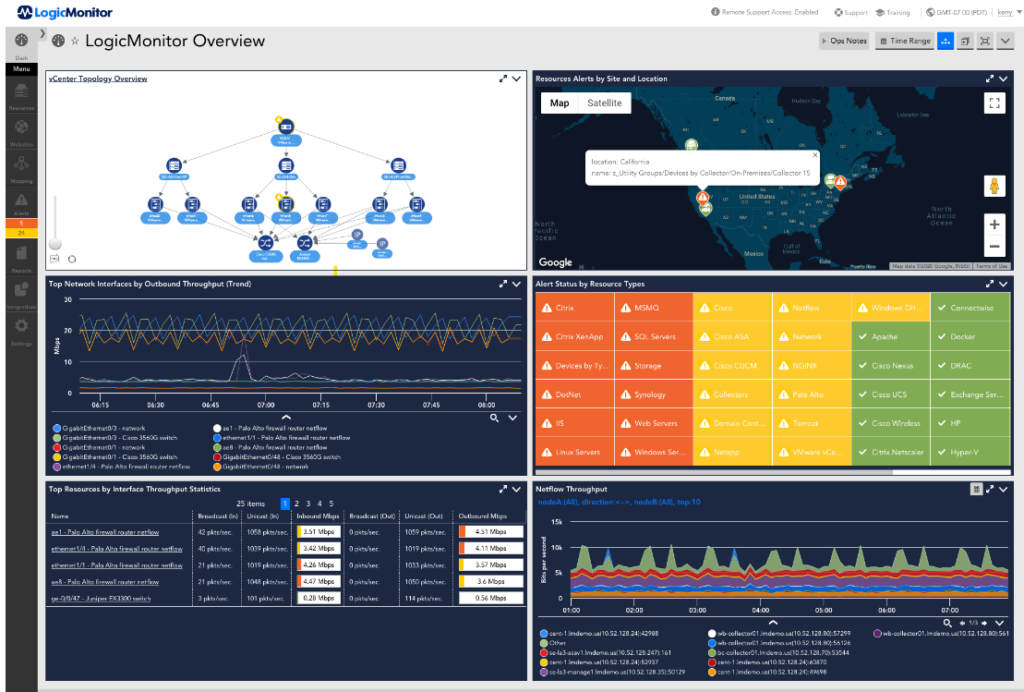
LogicMonitor offre una piattaforma basata su cloud specializzata nel monitoraggio e nell'osservazione di infrastrutture ibride, che comprendono sia sistemi on-premises che implementazioni in cloud. Il suo approccio automatizzato al monitoraggio delle prestazioni dei vari componenti dell'infrastruttura la rende particolarmente preziosa per le aziende con ambienti complessi e diversificati.
Perché ho scelto LogicMonitor: Nella scelta delle soluzioni di monitoraggio per questo elenco, ho valutato le loro capacità e LogicMonitor si è costantemente distinta. Ciò che la differenzia dalle altre sono le sue capacità di automazione, in particolare per le configurazioni ibride, che combinano ambienti tradizionali e cloud.
A mio avviso, la sua competenza in questo ambito la rende la migliore per il monitoraggio automatico delle infrastrutture ibride.
Funzionalità e integrazioni principali:
Le principali funzionalità di LogicMonitor includono la rilevazione automatica dei dispositivi, la soglia dinamica e meccanismi avanzati di allerta. Dal punto di vista delle integrazioni, LogicMonitor è compatibile con una moltitudine di servizi come AWS, Azure, Cisco, VMware e molti altri, garantendo una copertura ampia su più piattaforme.
Pros and Cons
Pros:
- Monitoraggio completo delle infrastrutture ibride
- Robuste funzionalità di automazione riducono l'intervento manuale
- Supporta un'ampia gamma di integrazioni
Cons:
- L'interfaccia può essere complessa per i principianti
- Le funzionalità avanzate possono risultare complesse per implementazioni di piccole dimensioni
- Alcuni utenti segnalano ritardi occasionali nelle notifiche di allerta.
AppDynamics
Ideale per il tracciamento end-to-end delle transazioni di business

AppDynamics è una soluzione di gestione delle prestazioni che fornisce alle organizzazioni approfondimenti dettagliati sulla salute e sull'efficienza delle loro applicazioni. La sua abilità nel tracciare le transazioni di business dall'inizio alla fine la rende una risorsa preziosa per chi cerca metriche complete sulle prestazioni delle applicazioni.
Perché ho scelto AppDynamics: Dopo un'ampia ricerca e il confronto tra vari strumenti di monitoraggio delle applicazioni, ho concluso che AppDynamics offre un netto vantaggio nel tracciamento end-to-end delle transazioni di business. La chiarezza e la profondità degli approfondimenti forniti dal suo meccanismo di tracciamento hanno superato quelle di altri strumenti nel settore.
Data l'importanza di comprendere l'intero ciclo di vita delle transazioni nel mondo aziendale digitale di oggi, ritengo che AppDynamics sia la scelta migliore per questa esigenza specifica.
Caratteristiche distintive e integrazioni:
AppDynamics offre funzionalità come il rilevamento in tempo reale delle anomalie, la definizione dinamica delle baseline e dashboard dettagliate sulle prestazioni. Per quanto riguarda le integrazioni, AppDynamics si sincronizza bene con molte delle principali piattaforme, in particolare AWS, Azure e una vasta gamma di tecnologie di database, assicurando un'esperienza di monitoraggio applicativo coesa.
Pros and Cons
Pros:
- Potenziate capacità di tracciamento delle transazioni di business
- Il rilevamento in tempo reale delle anomalie aiuta nella rapida risoluzione dei problemi
- La definizione dinamica delle baseline adatta le soglie in base al comportamento
Cons:
- Il costo può essere proibitivo per le aziende più piccole
- Il volume di dati e metriche inizialmente può essere travolgente
- Alcune integrazioni richiedono passaggi aggiuntivi di configurazione
Altri strumenti di monitoraggio delle prestazioni
Di seguito trovi un elenco di altri strumenti di monitoraggio delle prestazioni che avevo inserito nella shortlist, ma che non sono entrati nella top 10. Meritano comunque di essere considerati.
- New Relic
Ideale per la collaborazione tra DevOps e SRE
- SolarWinds AppOptics
Ideale per metriche granulari sulle prestazioni delle applicazioni
- Paessler PRTG
Ideale per opzioni flessibili di monitoraggio della rete
- Sematext
Ideale per log e metriche centralizzati
- Dynatrace
Ideale per diagnosi guidate dall’IA
- Datadog
Ideale per il monitoraggio integrato su scala cloud
- Dotcom Monitor
Ideale per monitoraggi complessi e personalizzati su API


Criteri di selezione degli strumenti di monitoraggio delle prestazioni
Nella selezione dei migliori strumenti di monitoraggio delle prestazioni da inserire in questa lista, ho considerato bisogni comuni e punti di dolore degli acquirenti come la scalabilità e la facilità di integrazione. Ho utilizzato inoltre il seguente framework per mantenere la valutazione strutturata ed equa:
Funzionalità principali (25% del punteggio totale)
Per essere prese in considerazione, tutte le soluzioni dovevano coprire questi casi d'uso comuni:
- Monitoraggio delle prestazioni delle applicazioni
- Monitoraggio dell'uptime dei server
- Fornitura di analisi in tempo reale
- Notifiche di allerta
- Supporto per ambienti multi-piattaforma
Funzionalità aggiuntive distintive (25% del punteggio totale)
Per restringere ulteriormente la rosa dei candidati, ho considerato anche funzionalità uniche, come:
- Dashboard personalizzabili
- Analisi guidate dall'intelligenza artificiale
- Tracciamento distribuito
- Rilevamento anomalie
- Monitoraggio dell'esperienza utente
Usabilità (10% del punteggio totale)
Per valutare l'usabilità di ciascun sistema, ho analizzato i seguenti aspetti:
- Interfaccia intuitiva
- Facilità di navigazione
- Opzioni di personalizzazione
- Curva di apprendimento
- Funzionalità di accessibilità
Onboarding (10% del punteggio totale)
Per valutare l'esperienza di onboarding di ogni piattaforma, ho considerato i seguenti aspetti:
- Disponibilità di video formativi
- Tour interattivi del prodotto
- Accesso a modelli preimpostati
- Assistenza tramite chatbot
- Webinar e demo dal vivo
Supporto clienti (10% del punteggio totale)
Per valutare i servizi di assistenza clienti di ciascun fornitore di software, ho considerato i seguenti aspetti:
- Disponibilità 24/7
- Opzioni di supporto multicanale
- Reattività alle richieste
- Presenza di una knowledge base
- Servizi di supporto personalizzati
Rapporto qualità-prezzo (10% del punteggio totale)
Per valutare il rapporto qualità-prezzo di ciascuna piattaforma, ho considerato i seguenti aspetti:
- Prezzi competitivi
- Trasparenza dei prezzi
- Disponibilità di prove gratuite
- Gamma di funzionalità in ogni fascia di prezzo
- Sconti su abbonamenti annuali
Recensioni dei clienti (10% del punteggio totale)
Per ottenere una panoramica della soddisfazione generale dei clienti, ho preso in considerazione i seguenti aspetti leggendo le recensioni:
- Valutazioni sulla soddisfazione degli utenti
- Problemi segnalati più frequentemente
- Elogi per funzionalità specifiche
- Feedback sui servizi di assistenza
- Tassi di raccomandazione complessivi
Come scegliere uno strumento di monitoraggio delle prestazioni
È facile perdersi tra lunghe liste di funzionalità e strutture di prezzo complesse. Per aiutarti a rimanere concentrato durante il tuo processo di selezione software, ecco una checklist di fattori da tenere a mente:
| Fattore | Da considerare |
|---|---|
| Scalabilità | Lo strumento può crescere con le esigenze della tua azienda? Verifica se supporta carichi di dati e numero di utenti crescenti senza problemi di prestazioni. |
| Integrazioni | Si integra con il tuo stack tecnologico attuale? Controlla la compatibilità con sistemi chiave come AWS, Azure o Kubernetes per evitare silos di dati. |
| Personalizzazione | Puoi adattare lo strumento ai tuoi flussi di lavoro? Cerca opzioni che permettano di modificare dashboard e report in base alle esigenze specifiche del tuo team. |
| Facilità d'uso | L'interfaccia è intuitiva per il tuo team? Una curva di apprendimento ripida può rallentare l'adozione: scegli soluzioni user-friendly e con navigazione chiara. |
| Implementazione e onboarding | Quanto tempo servirà per essere operativi? Valuta la disponibilità di risorse come tutorial e supporto per facilitare la transizione. I servizi di rete forniti dai vendor di ottimizzazione WAN potrebbero avere procedure di onboarding più complesse rispetto ad altri strumenti. |
| Costo | I prezzi sono trasparenti e rientrano nel tuo budget? Valuta non solo i costi iniziali ma anche le spese a lungo termine, inclusi potenziali add-on o upgrade. |
| Tutele di sicurezza | Lo strumento rispetta i tuoi standard di sicurezza? Assicurati che offra forti misure di protezione dei dati, come crittografia e aggiornamenti di sicurezza regolari. |
| Disponibilità del supporto | L'assistenza è disponibile quando necessario? Verifica orari e canali di supporto, come chat e telefono, per assicurarti che soddisfino le esigenze del tuo team. |
Cosa sono gli strumenti di monitoraggio delle prestazioni?
Gli strumenti di monitoraggio delle prestazioni sono soluzioni software utilizzate per tracciare e analizzare le prestazioni di applicazioni, server e reti. In genere, questi strumenti vengono impiegati da professionisti IT, sviluppatori e team operativi per garantire il corretto funzionamento dei sistemi e individuare tempestivamente eventuali criticità prima che si aggravino.
Il monitoraggio in tempo reale, le notifiche di allerta e dashboard personalizzabili aiutano a mantenere in salute i sistemi e a ottimizzare le prestazioni. I software di monitoraggio hardware offrono una panoramica ancora più completa fornendo approfondimenti dettagliati sui componenti fisici dell’infrastruttura. Questi strumenti forniscono informazioni fondamentali che consentono ai team di migliorare l’affidabilità e la soddisfazione degli utenti.
Caratteristiche
Quando scegli strumenti di monitoraggio delle prestazioni, presta attenzione alle seguenti caratteristiche chiave:
- Notifiche di allerta: Invia avvisi immediati per notificare agli utenti eventuali anomalie di sistema, consentendo risposte rapide a potenziali problemi.
- Dashboard personalizzabili: Permette agli utenti di adattare la visualizzazione di metriche e dati alle loro esigenze e preferenze specifiche.
- Rilevamento anomalie: Individua schemi inconsueti e deviazioni nelle metriche di prestazione, facilitando la rapida diagnosi dei problemi.
- Analisi delle prestazioni applicative: Offre analisi dettagliate sulla salute e l'efficienza delle applicazioni, aiutando i team a ottimizzare le prestazioni del software.
- Capacità di integrazione: Garantisce la compatibilità con sistemi e piattaforme esistenti, riducendo i silos di dati e migliorando il flusso di lavoro.
- Monitoraggio dell'esperienza utente: Traccia le interazioni e le esperienze degli utenti finali, fornendo indicazioni utili per migliorare soddisfazione e coinvolgimento.
- Monitoraggio in tempo reale: Fornisce dati continui sulle prestazioni del sistema, aiutando i team a identificare e risolvere rapidamente i problemi non appena si presentano. Soluzioni popolari come le alternative a Nagios offrono vari approcci al monitoraggio dei sistemi.
- Scoperta automatizzata: Semplifica il processo di configurazione identificando e mappando automaticamente i componenti di sistema.
- Tutele di sicurezza: Fornisce funzionalità di protezione dei dati come la crittografia per mantenere l'integrità del sistema e la conformità agli standard.
Vantaggi
Implementare strumenti di monitoraggio delle prestazioni offre numerosi vantaggi sia al tuo team che alla tua azienda. Ecco alcuni benefici a cui puoi guardare con interesse:
- Maggiore affidabilità del sistema: Il monitoraggio in tempo reale e le notifiche di allerta aiutano a mantenere l'operatività identificando e risolvendo rapidamente i problemi.
- Maggiore soddisfazione degli utenti: Il monitoraggio dell'esperienza utente offre informazioni sulle interazioni con gli utenti finali, consentendo miglioramenti che aumentano la soddisfazione.
- Prestazioni ottimizzate: Le analisi delle prestazioni applicative e il rilevamento delle anomalie aiutano a individuare i colli di bottiglia, migliorando l'efficienza del software.
- Gestione efficiente delle risorse: Dashboard personalizzabili e capacità di integrazione assicurano che i dati siano facilmente accessibili e utilizzabili su diverse piattaforme.
- Aumentata sicurezza: Le tutele di sicurezza proteggono l'integrità dei dati, garantendo la conformità agli standard del settore e riducendo i rischi.
- Risoluzione proattiva dei problemi: La scoperta automatizzata e le notifiche in tempo reale permettono ai team di affrontare i problemi potenziali prima che impattino sulle operazioni.
- Flussi di lavoro ottimizzati: Le capacità di integrazione garantiscono un flusso di dati senza interruzioni tra i sistemi, riducendo il lavoro manuale e aumentando la produttività.
Costi e Prezzi
Scegliere strumenti di monitoraggio delle prestazioni richiede la comprensione dei diversi modelli e piani di prezzo disponibili. I costi variano in base alle funzionalità, alla dimensione del team, ai componenti aggiuntivi e altro ancora. La tabella seguente riassume i piani comuni, i prezzi medi e le tipiche funzionalità incluse nelle soluzioni di strumenti di monitoraggio delle prestazioni:
Tabella di Confronto dei Piani per Strumenti di Monitoraggio delle Prestazioni
| Tipologia di Piano | Prezzo Medio | Funzionalità Comuni |
|---|---|---|
| Piano Gratuito | $0 | Monitoraggio di base, conservazione dei dati limitata e supporto dalla community. |
| Piano Personale | $5-$25/user/month | Monitoraggio in tempo reale, notifiche di allerta, dashboard personalizzabili e supporto via email. |
| Piano Business | $30-$75/user/month | Analisi avanzate, capacità di integrazione, monitoraggio dell'esperienza utente e supporto telefonico. |
| Piano Enterprise | $100-$200/user/month | Visibilità su tutti i livelli, gestione account dedicata, funzionalità di sicurezza avanzate e supporto premium 24/7. |
Domande frequenti sugli strumenti di monitoraggio delle prestazioni
Ecco alcune risposte alle domande più comuni sugli strumenti di monitoraggio delle prestazioni:
Quali aspetti considereresti nella scelta di uno strumento di monitoraggio delle prestazioni?
Quando scegli uno strumento di monitoraggio delle prestazioni, valuta sicurezza, protezione dei dati e privacy. Assicurati che lo strumento sia conforme agli standard di settore come GDPR o HIPAA. Valuta quanto bene si integra con i tuoi sistemi esistenti e la sua capacite0 di crescere insieme alle esigenze aziendali. Se il tuo team cerca opzioni pif9 complete oltre alle soluzioni tradizionali, la nostra guida allea0u003ca href=u0022https://thectoclub.com/tools/best-new-relic-alternatives/u0022u003ealternative a New Relicu003c/au003ea0offre confronti dettagliati tra i migliori strumenti del settore.
Come gestiscono la privacy dei dati gli strumenti di monitoraggio delle prestazioni?
Gli strumenti di monitoraggio delle prestazioni includono spesso funzionalite0 per garantire la privacy dei dati, come crittografia e controlli di accesso. c8 importante verificare che lo strumento scelto sia conforme alle normative vigenti sulla protezione dei dati e offra log di audit per tracciare l2019;accesso e l2019;utilizzo delle informazioni.
Come si integrano gli strumenti di monitoraggio delle prestazioni con i sistemi esistenti?
La maggior parte degli strumenti di monitoraggio delle prestazioni offre API e connettori per integrarsi con altri sistemi. Verifica che lo strumento sia compatibile con il tuo ambiente tecnologico attuale, compresi servizi cloud e applicazioni on-premise, per garantire un flusso di dati fluido ed evitare silos informativi.
Come avvisano gli strumenti di monitoraggio delle prestazioni in caso di problemi?
Questi strumenti utilizzano generalmente sistemi di allerta in tempo reale per notificare agli utenti eventuali problemi di prestazioni. Gli avvisi possono essere inviati tramite email, SMS o piattaforme di messaggistica integrate. Cerca soglie di allerta personalizzabili e percorsi di escalation per adattarsi al flusso di lavoro del tuo team.
Che tipo di supporto si puf2 aspettare dai fornitori di strumenti di monitoraggio delle prestazioni?
Il supporto varia in base al fornitore, ma spesso include assistenza 24/7 tramite chat, email o telefono. Alcuni offrono account manager dedicati o piani di supporto premium. Valuta il livello di supporto di cui hai bisogno e assicurati che sia disponibile nei tuoi canali preferiti.
In che modo gli strumenti di monitoraggio delle prestazioni aiutano a ottimizzare le risorse?
Offrendo analisi sulle prestazioni dei sistemi e identificando i colli di bottiglia, questi strumenti aiutano a ottimizzare l2019;allocazione delle risorse. Consentono di modificare i carichi di lavoro, scalare le risorse in modo efficiente e migliorare le prestazioni complessive del sistema, portando a risparmi sui costi e una migliore gestione delle risorse.
Cosa succede ora:
Se stai cercando uno strumento di monitoraggio delle prestazioni, contatta un consulente SoftwareSelect per ricevere consigli gratuiti.
Compila un modulo e fai una breve chiacchierata per approfondire le tue necessità specifiche. Riceverai quindi una shortlist di software da valutare. Sarai supportato durante tutto il processo d’acquisto, comprese le negoziazioni sui prezzi.