12 mejores alternativas a Datadog revisadas en 2026

Mejores alternativas a Datadog: Lista corta


Si utilizas Datadog para la monitorización en la nube, puede que hayas encontrado ciertos desafíos, como costos elevados o funciones complejas que no se adaptan a las necesidades de tu equipo. No eres el único. Muchos expertos en tecnología buscan alternativas a Datadog para ajustarse mejor a sus requerimientos específicos.
Por experiencia, encontrar la herramienta adecuada puede aumentar significativamente la eficiencia de tu equipo. Por eso, he probado y revisado de manera independiente varias alternativas a Datadog. Mi objetivo es ofrecerte una guía imparcial y bien investigada que te ayude a tomar una decisión informada.
En este artículo, compartiré mis principales opciones de alternativas a Datadog, centrándome en características y beneficios únicos que pueden ajustarse mejor a tu equipo. Vamos a explorar las opciones que podrían atender mejor las necesidades de tu negocio.
¿Qué es Datadog?
Datadog es una plataforma de monitorización en la nube que te ayuda a realizar un seguimiento en tiempo real de tus aplicaciones, infraestructura y registros. Normalmente, profesionales de TI, desarrolladores y equipos de operaciones utilizan Datadog para supervisar el rendimiento y resolver problemas rápidamente. Funciones como la monitorización en tiempo real, la gestión de registros y los paneles personalizables ayudan a identificar cuellos de botella y mantener la salud del sistema. En general, Datadog ofrece una forma simple de mantener tus sistemas funcionando sin problemas.
Resumen de las mejores alternativas a Datadog
Esta tabla comparativa resume los detalles de precios de mis principales selecciones como alternativas a Datadog para ayudarte a encontrar la mejor opción para tu presupuesto y las necesidades de tu negocio.
| Tool | Best For | Trial Info | Price | ||
|---|---|---|---|---|---|
| 1 | Ideal para retención flexible de datos | Prueba gratuita de 14 días disponible | Desde $0.42/GB | Website | |
| 2 | Ideal para visualización independiente de la fuente de datos | Plan gratuito + prueba gratuita disponible | Desde $19/mes + uso | Website | |
| 3 | El mejor ecosistema unificado de telemetría full-stack | Plan gratuito disponible | Desde $49/usuario/mes | Website | |
| 4 | Ideal para el análisis de seguridad a nivel empresarial | Prueba gratuita de 14 días + demo gratuita disponible | Precios a petición | Website | |
| 5 | El mejor motor de métricas basado en pull para Kubernetes | Gratis para usar | Sin costo de licencia | Website | |
| 6 | Mejor para el descubrimiento de aplicaciones en tiempo real | Demo gratis disponible | Desde $21.20/MVS/mes | Website | |
| 7 | Ideal para entornos AWS | Disponible plan gratuito | Precios a consultar | Website | |
| 8 | Ideal para búsqueda de registros a gran escala | Prueba gratuita + demo gratuita disponible | Desde $0.07/GB de datos ingeridos | Website | |
| 9 | Mejor integración con Azure | Demo gratuita disponible | Precios bajo solicitud | Website | |
| 10 | Ideal para la resolución de problemas asistida por IA | Prueba gratuita de 14 días + demo gratuita disponible | Desde $0.20/millón de puntos de datos métricos | Website |
Por qué confiar en nuestras reseñas de software
Llevamos probando y revisando software desde 2023. Como líderes tecnológicos, sabemos lo crítico y difícil que es tomar la decisión correcta al seleccionar software.
Invertimos en una investigación profunda para ayudar a nuestra audiencia a tomar mejores decisiones de compra de software. Hemos probado más de 2,000 herramientas para diferentes casos de uso tecnológicos y escrito más de 1,000 reseñas de software exhaustivas. Descubre cómo mantenemos la transparencia y nuestra metodología de revisión de software.
-

TestDevLab
Visit Website -
Site24x7
Visit WebsiteThis is an aggregated rating for this tool including ratings from Crozdesk users and ratings from other sites.4.7 -
GitHub Actions
Visit WebsiteThis is an aggregated rating for this tool including ratings from Crozdesk users and ratings from other sites.4.8


Reseñas de las mejores alternativas a Datadog
A continuación, puedes leer mis resúmenes detallados de las mejores alternativas a Datadog que entraron en mi lista corta. Mis análisis ofrecen una visión detallada de las características clave, ventajas y desventajas, integraciones, y casos de uso ideales de cada herramienta para ayudarte a encontrar la mejor para ti.
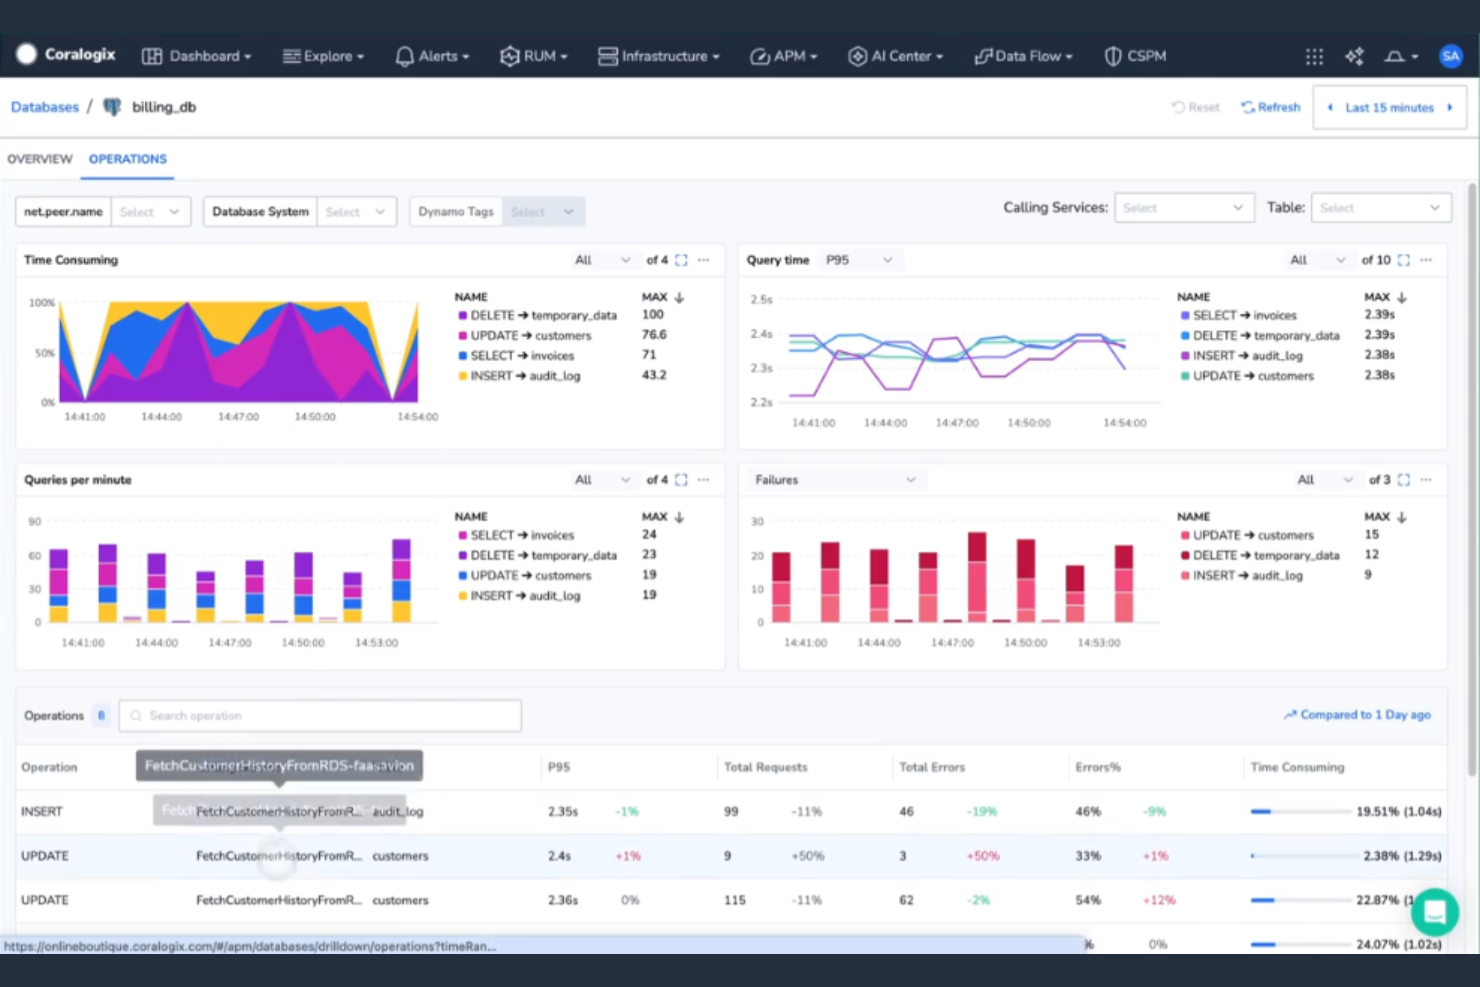
Coralogix es una plataforma de análisis y monitoreo de registros diseñada para equipos de DevOps y profesionales de TI. Te ayuda a gestionar y analizar los datos de registros para obtener información valiosa y mejorar el rendimiento del sistema.
Por qué es una buena alternativa a Datadog: Coralogix ofrece opciones flexibles de retención de datos, permitiéndote controlar cuánto tiempo conservas tu información. Su análisis en tiempo real proporciona información inmediata sobre tus registros. Con capacidades de aprendizaje automático, Coralogix te ayuda a identificar patrones y anomalías rápidamente. Esto puede ser especialmente útil para equipos que buscan optimizar el almacenamiento y la recuperación de datos.
Características destacadas e integraciones:
Entre las características se incluyen el monitoreo en tiempo real (live tailing), que te permite ver los datos de registros al instante para detectar problemas en el momento en que ocurren. Los algoritmos de aprendizaje automático de la plataforma mejoran la detección de anomalías. También puedes usar sus paneles personalizables para concentrarte en las métricas más importantes para tu equipo.
Las integraciones incluyen AWS, Microsoft Azure, Google Cloud Platform, Kubernetes, Docker, GitHub, Slack, Jira, PagerDuty y más.
Pros and Cons
Pros:
- Retención de datos flexible
- Análisis de registros en tiempo real
- Información por aprendizaje automático, incluyendo detección inmediata de anomalías
Cons:
- Interfaz compleja y lenguaje de consultas propietario
- Las configuraciones por niveles pueden volverse costosas
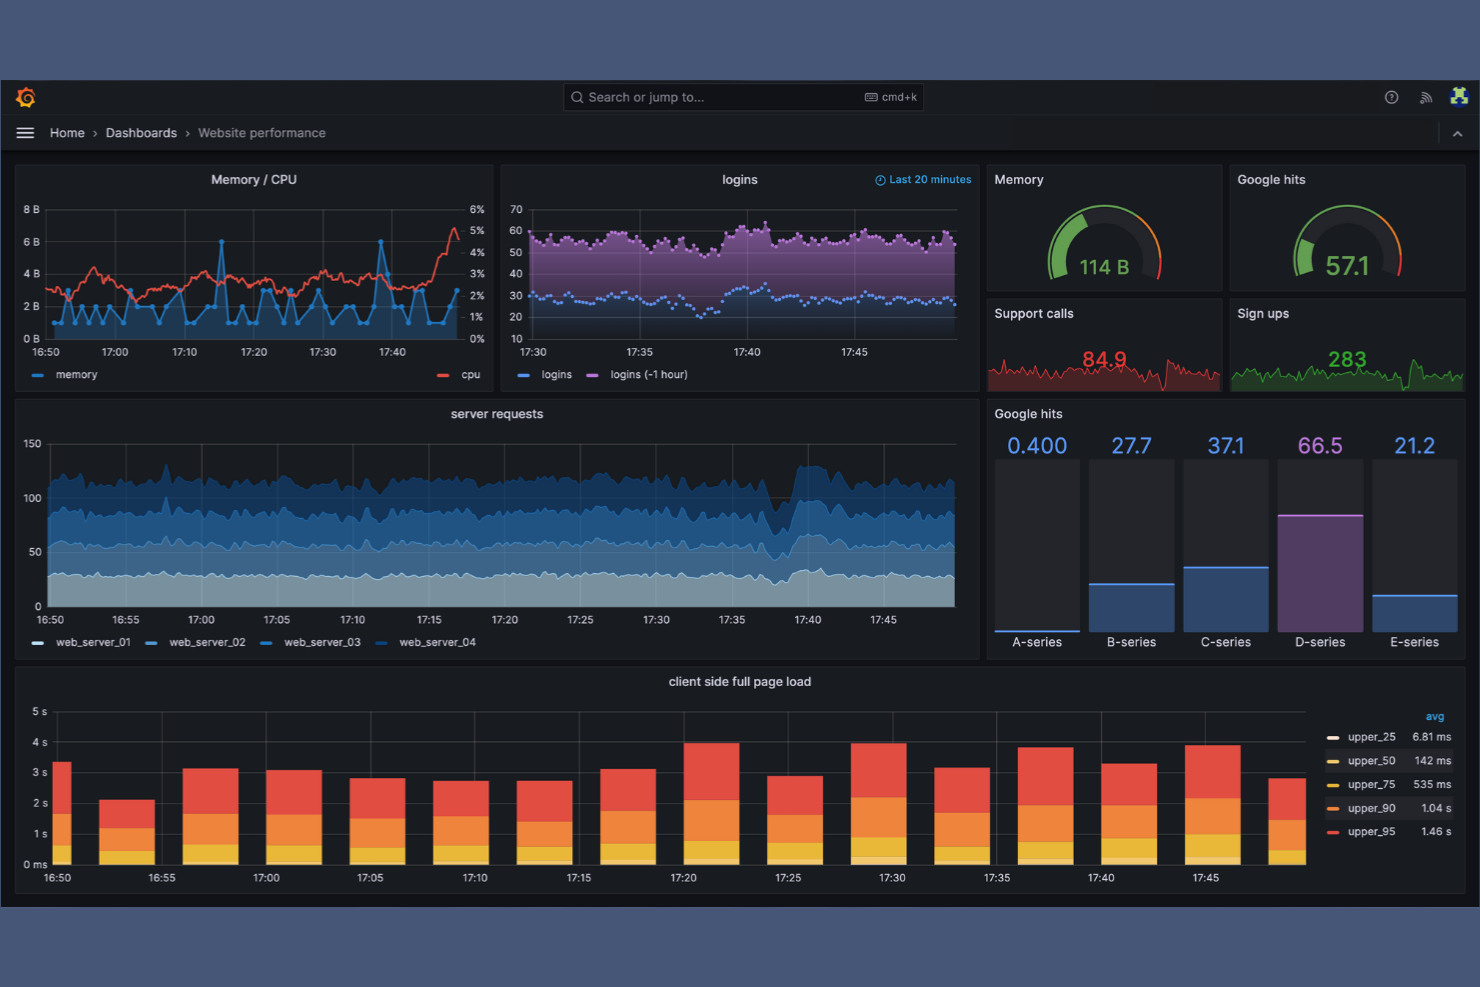
Grafana es una plataforma de visualización y monitoreo de datos utilizada por equipos de TI y DevOps para crear paneles interactivos y compartibles. Te ayuda a monitorear y analizar métricas de diversas fuentes de datos.
Por qué es una buena alternativa a Datadog: Grafana destaca en la visualización de métricas gracias a su amplia gama de paneles personalizables. Puedes adaptar estos paneles para mostrar los datos más relevantes para tu equipo. El flexible sistema de alertas de la plataforma te mantiene informado sobre cambios críticos. Al ser de código abierto, puedes adaptarlo exactamente a tus necesidades.
Características e integraciones sobresalientes:
Las características incluyen plantillas, que te permiten crear paneles reutilizables y dinámicos. La función de anotaciones te ayuda a marcar eventos importantes en los gráficos para mayor contexto. También puedes usar sus capacidades de alertas para recibir notificaciones basadas en umbrales específicos.
Las integraciones incluyen el stack de Grafana Labs, Prometheus, InfluxDB, Elasticsearch, AWS CloudWatch, Microsoft Azure Monitor, Google Cloud, MySQL, PostgreSQL, Graphite, OpenTSDB y más.
Pros and Cons
Pros:
- Visualización avanzada de múltiples fuentes
- Agregación de datos eficiente
- Fuertes capacidades de visualización
Cons:
- Alta complejidad operativa
- Analítica integrada limitada

New Relic es una herramienta de monitoreo del rendimiento de aplicaciones (APM) utilizada por desarrolladores y equipos de operaciones de TI para garantizar un rendimiento óptimo de las aplicaciones. Proporciona información sobre el comportamiento de las aplicaciones y el estado de la infraestructura.
Por qué es una buena alternativa a Datadog: Con amplias integraciones, New Relic te permite conectar con una gran variedad de servicios y plataformas. Sus funciones en tiempo real de APM y alertas te ayudan a mantener el control sobre los problemas de rendimiento. Los paneles personalizables te brindan la flexibilidad de adaptar las métricas a las necesidades de tu equipo. Esto facilita la gestión de entornos complejos con tecnologías diversas.
Características destacadas e integraciones:
Las características incluyen monitoreo sintético, que simula interacciones de usuario para detectar problemas de forma anticipada. El rastreo distribuido te ayuda a comprender el flujo de solicitudes en tus aplicaciones. También puedes utilizar analíticas avanzadas para obtener información más profunda de tus datos.
Las integraciones incluyen AWS, Microsoft Azure, Google Cloud, Kubernetes, Docker, Slack, PagerDuty, Jenkins, GitHub, Jira y más.
Pros and Cons
Pros:
- Opciones de integración extensas
- Potente APM y rastreo
- Vista consolidada centrada en entidades
Cons:
- Modelo de precios complejo
- Algunas funciones requieren configuración avanzada

Splunk es una plataforma de análisis de datos utilizada por profesionales de TI y seguridad para monitorear y analizar datos generados por máquinas. Te ayuda a obtener información de registros, métricas y eventos para mejorar el rendimiento operativo y la seguridad.
Por qué es una buena alternativa a Datadog: Splunk destaca en análisis de seguridad, incluyendo SIEM, proporcionando capacidades avanzadas de detección y respuesta a amenazas. Sus potentes herramientas de búsqueda y visualización te permiten identificar y mitigar rápidamente riesgos de seguridad. La capacidad de la plataforma para manejar grandes volúmenes de datos la hace adecuada para entornos complejos. También puedes personalizar dashboards para enfocarte en las métricas de seguridad que más le importan a tu equipo.
Funciones destacadas e integraciones:
Funciones incluyen avanzadas capacidades de búsqueda que te permiten explorar tus datos en detalle. Las herramientas de aprendizaje automático de la plataforma mejoran el análisis predictivo para una mejor toma de decisiones. Además, puedes beneficiarte del monitoreo en tiempo real para mantener tus sistemas seguros.
Integraciones incluyen AWS, Microsoft Azure, Google Cloud Platform, AppDynamics, ServiceNow, Docker, Kubernetes, Salesforce, Cisco, Okta, Palo Alto Networks y más.
Pros and Cons
Pros:
- Análisis avanzado de registros
- Potentes herramientas de seguridad y SIEM
- Extenso ecosistema de integraciones
Cons:
- Mantenimiento intensivo del indexador
- Alto costo total de propiedad
Prometheus es un conjunto de herramientas de monitoreo y alerta de código abierto, utilizado principalmente por desarrolladores y equipos de operaciones de TI. Se centra en la captura de datos de series temporales para ofrecer información sobre el rendimiento y la fiabilidad del sistema.
Por qué es una buena alternativa a Datadog: Prometheus ofrece una solución de código abierto que permite un alto grado de personalización y flexibilidad. Su potente lenguaje de consultas, PromQL, te permite explorar y analizar datos de forma eficiente. El enfoque de la herramienta en los datos de series temporales te ayuda a monitorizar y alertar sobre métricas clave. Además, su capacidad de integrarse con distintos sistemas la hace adaptable a diferentes entornos.
Características e integraciones destacadas:
Las características incluyen un modelo de datos flexible que soporta la recopilación de datos multidimensionales. El gestor de alertas te permite definir y gestionar alertas de forma efectiva. También puedes utilizar herramientas de visualización integradas para crear paneles informativos.
Las integraciones incluyen Kubernetes, Docker, Consul, etcd, Amazon EC2, Google Cloud Platform, Microsoft Azure, DigitalOcean y Grafana.
Pros and Cons
Pros:
- Flexibilidad de código abierto
- Lenguaje de consulta personalizable
- Gestión eficiente de datos de series temporales
Cons:
- Visualización integrada limitada
- Sin almacenamiento nativo a largo plazo

IBM Instana es una herramienta APM diseñada para equipos de DevOps y operaciones de TI. Proporciona información en tiempo real sobre el rendimiento de las aplicaciones y el estado de la infraestructura.
Por qué es una buena alternativa a Datadog: Con información basada en IA en tiempo real y capacidades de correlación, IBM Instana detecta automáticamente los problemas y proporciona datos procesables para resolverlos. Su descubrimiento y mapeo automático de servicios te da una vista completa de tu entorno. El análisis de causa raíz impulsado por IA de la herramienta te ayuda a identificar y solucionar problemas rápidamente. Las actualizaciones continuas aseguran que tu equipo siempre tenga la información más reciente al alcance.
Características destacadas e integraciones:
Características incluyen integración continua con flujos de trabajo DevOps para mejorar la eficiencia de tu equipo. La plataforma ofrece rastreo de transacciones de extremo a extremo para monitorear la experiencia del usuario. También puedes acceder a un monitoreo detallado de la infraestructura para obtener información más profunda sobre el rendimiento del sistema.
Integraciones incluyen Kubernetes, Docker, AWS, Microsoft Azure, Google Cloud Platform, IBM Cloud, Red Hat OpenShift, VMware, Jenkins, Grafana y más.
Pros and Cons
Pros:
- Rastreo y monitoreo en tiempo real
- Mapeo automático de dependencias
- Sólido soporte para Kubernetes
Cons:
- Precios poco claros por MVS
- Configuración inicial compleja

Amazon CloudWatch es un servicio de monitoreo y gestión creado para desarrolladores, operadores de sistemas y administradores de TI que utilizan recursos de AWS. Te ayuda a recopilar y rastrear métricas, supervisar archivos de registro y establecer alarmas.
Por qué es una buena alternativa a Datadog: Gracias a su profunda integración con AWS, Amazon CloudWatch ofrece un monitoreo coherente de todos tus recursos AWS. Proporciona datos detallados sobre el rendimiento e información sobre la salud operativa. La capacidad del servicio para establecer alarmas basadas en umbrales de métricas ayuda en la gestión proactiva. Además, su función de escalado automático mantiene los niveles de rendimiento de tu aplicación.
Características destacadas e integraciones:
Las características incluyen monitoreo detallado, lo que te permite recopilar y analizar métricas en intervalos de un minuto. El servicio también ofrece almacenamiento y gestión de datos de registro, ayudándote a solucionar problemas rápidamente. Puedes configurar paneles personalizados para visualizar las métricas que más importan a tu equipo.
Las integraciones incluyen AWS Lambda, Amazon EC2, Amazon S3, Amazon RDS, Amazon ECS, AWS Elastic Beanstalk, Amazon API Gateway, AWS CloudTrail, AWS Step Functions, AWS IoT, y más.
Pros and Cons
Pros:
- Integrado con la seguridad de AWS
- Datos de rendimiento detallados
- Alarmas personalizables
Cons:
- Visibilidad limitada entre diferentes nubes
- Se requiere experiencia en AWS

Elastic es una plataforma de análisis impulsada por búsqueda que atiende a desarrolladores y equipos de TI que necesitan buscar, analizar y visualizar datos en tiempo real. Admite diversas funciones, incluyendo registro de eventos, seguridad y observabilidad.
Por qué es una buena alternativa a Datadog: Elastic sobresale en capacidades de búsqueda, facilitando la localización y el análisis de puntos de datos específicos. Sus herramientas de observabilidad ofrecen información profunda sobre el rendimiento de las aplicaciones y la salud de la infraestructura. La escalabilidad de la plataforma te permite manejar grandes volúmenes de datos de manera eficiente. Con paneles personalizables, tu equipo puede enfocarse en las métricas que más importan.
Funciones destacadas e integraciones:
Las funciones incluyen potentes capacidades de búsqueda que te permiten consultar grandes conjuntos de datos rápidamente. Las características de aprendizaje automático de la plataforma te ayudan a detectar anomalías en tus datos. También puedes utilizar sus herramientas de visualización para crear paneles informativos que resalten métricas clave.
Las integraciones incluyen Kubernetes, Docker, AWS, Microsoft Azure, Google Cloud Platform, Apache Kafka, Apache Hadoop, Logstash, Beats, MySQL y más.
Pros and Cons
Pros:
- Sólidas capacidades de búsqueda de texto completo
- Análisis escalable de registros y métricas
- Métodos de ingesta de datos altamente flexibles
Cons:
- Potencial de dependencia operativa
- Puede ser intensivo en recursos

Azure Monitor es un servicio de monitorización todo en uno diseñado para profesionales de TI y desarrolladores que utilizan Microsoft Azure. Recoge, analiza y actúa sobre datos de telemetría de tus entornos en la nube y locales.
Por qué es una buena alternativa a Datadog: Con integración nativa en Microsoft Azure, Azure Monitor proporciona una monitorización fluida de tus recursos de Azure. Ofrece análisis integrados para obtener información detallada sobre tus aplicaciones. La capacidad del servicio para crear alertas basadas en métricas personalizadas te notifica rápidamente sobre cualquier problema en tus pipelines. Además, su escalabilidad soporta entornos grandes y dinámicos, lo que lo hace ideal para empresas en crecimiento.
Características y integraciones destacadas:
Las características incluyen análisis de registros, que te ayudan a consultar y analizar los datos de registro de manera eficiente. Insights de aplicaciones proporciona supervisión de extremo a extremo de tus aplicaciones. El servicio también incluye monitorización del rendimiento de la red para rastrear y diagnosticar problemas de red.
Las integraciones incluyen Azure Automation, Azure Log Analytics, Azure Event Hubs, Azure Logic Apps, Azure Functions, Azure DevOps, Microsoft Graph, Power BI y más.
Pros and Cons
Pros:
- Integración y observabilidad nativas con Microsoft Azure
- Herramientas de análisis de registros integradas
- Soporta configuraciones de nube híbrida
Cons:
- Configuración manual significativa para paneles y alertas
- Visibilidad limitada en entornos que no sean Azure

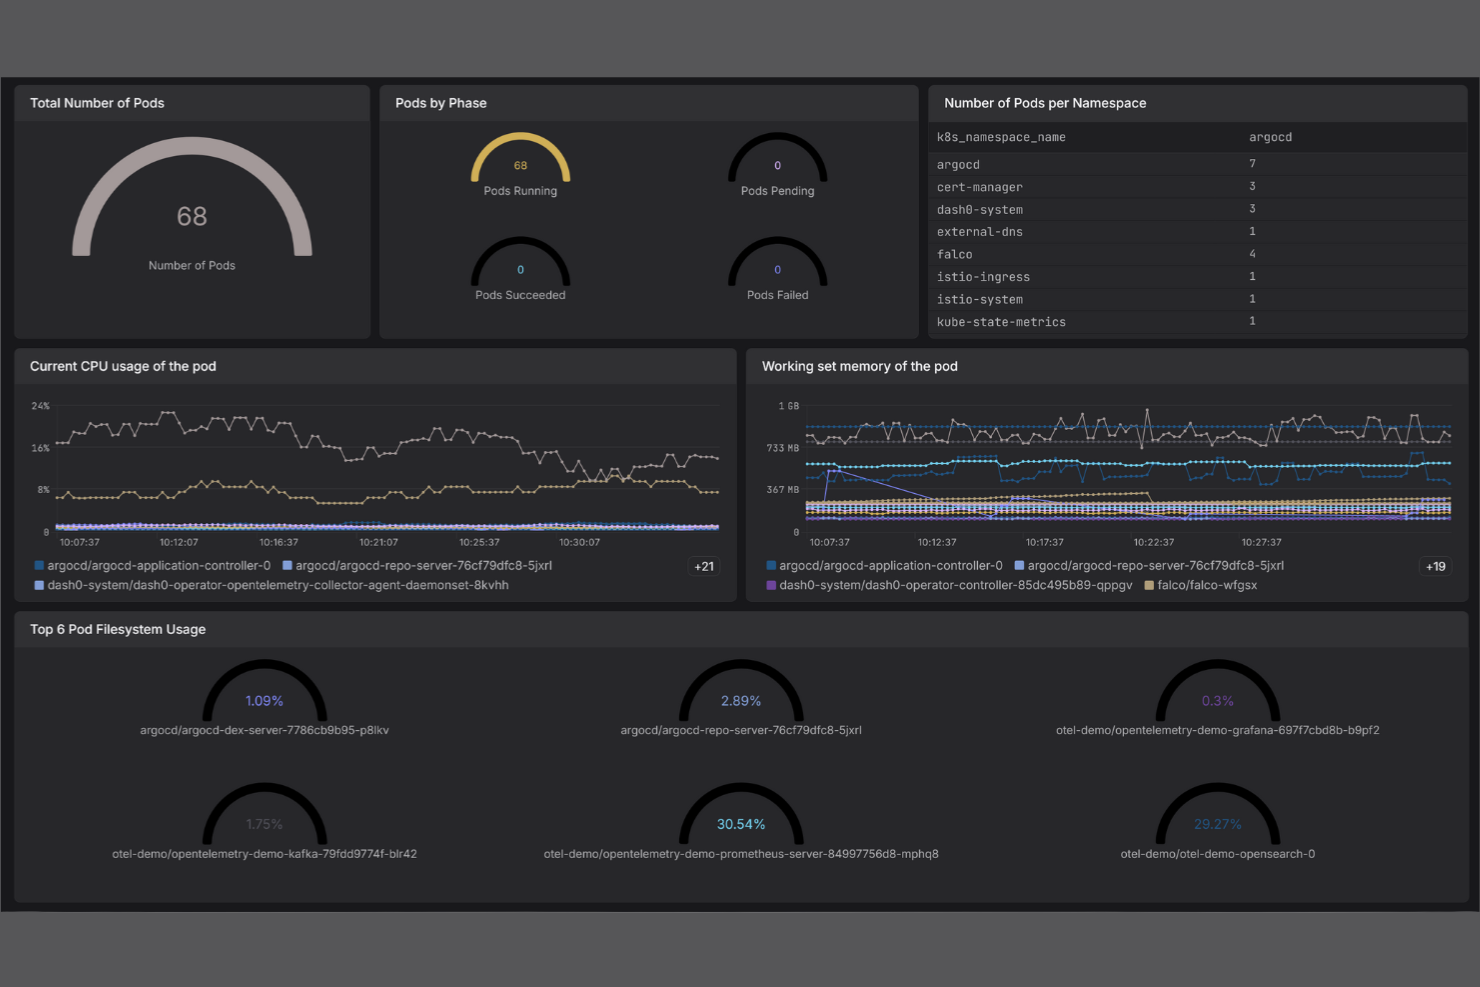
Dash0 es una plataforma de observabilidad nativa de IA dirigida a desarrolladores, ingenieros de confiabilidad del sitio (SRE) e ingenieros de plataformas. Ayuda a simplificar la monitorización y gestión de registros, métricas y trazas.
Por qué es una buena alternativa a Datadog: Dash0 ofrece observabilidad nativa de IA, lo que permite una supervisión simplificada sin configuraciones complejas. Su filtrado instantáneo de registros y la monitorización centralizada de métricas aseguran que puedas rastrear el rendimiento de manera eficiente. El diseño nativo de OpenTelemetry de la plataforma admite instrumentación, proporciona flexibilidad y evita el bloqueo por parte de proveedores. El trazado en tiempo real y los paneles personalizables permiten a tu equipo gestionar y visualizar los datos de forma más efectiva.
Características destacadas e integraciones:
Características incluyen filtrado instantáneo de registros, que facilita encontrar registros específicos rápidamente. La monitorización centralizada de métricas te permite supervisar todos los indicadores clave de rendimiento en un solo lugar. También puedes utilizar el trazado en tiempo real para obtener información inmediata sobre el rendimiento de las aplicaciones.
Integraciones incluyen Kubernetes, Prometheus, AWS, Google Cloud Platform, Microsoft Azure, Datadog, Grafana y más.
Pros and Cons
Pros:
- Filtrado instantáneo de registros
- Trazado en tiempo real
- Resolución de problemas orientada a OTEL
Cons:
- Carece de algunas funcionalidades avanzadas
- Capacidades de integración limitadas
Otras alternativas a Datadog
Aquí tienes otras alternativas a Datadog que no entraron en mi lista corta, pero que aún así valen la pena revisar:
- SigNoz
Ideal para la monitorización de backend nativo de OpenTelemetry
- Dynatrace
Ideal para mapeo de dependencias impulsado por IA a gran escala
- Chronosphere
Ideal para métricas cloud-native de escala


Criterios de selección de alternativas a Datadog
Para seleccionar las mejores alternativas a Datadog incluidas en esta lista, consideré las necesidades y puntos de dolor más comunes de los compradores de plataformas de monitorización en la nube, como la escalabilidad y las capacidades de integración. Además, utilicé el siguiente marco para mantener mi evaluación estructurada y justa:
Funcionalidad principal (25% de la puntuación total)
Para ser considerada, cada solución debía cubrir estos casos de uso comunes:
- Monitorizar el rendimiento del sistema
- Alertar sobre anomalías
- Visualizar métricas de datos
- Recopilación de datos de registros
- Compatibilidad con entornos en la nube
Otras características destacadas (25% de la puntuación total)
Para reducir aún más la competencia, también busqué funciones únicas, como:
- Información basada en IA
- Paneles personalizables
- Analítica en tiempo real
- Analítica predictiva
- Soporte multi-nube
Usabilidad (10% de la puntuación total)
Para obtener una impresión sobre la usabilidad de cada sistema, consideré lo siguiente:
- Interfaz de usuario intuitiva
- Navegación sencilla
- Opciones de personalización
- Accesibilidad en diferentes dispositivos
- Eficiencia en el flujo de trabajo
Incorporación (10% de la puntuación total)
Para evaluar la experiencia de incorporación de cada plataforma, consideré lo siguiente:
- Disponibilidad de videos de formación
- Recorridos interactivos por el producto
- Requisitos de curva de aprendizaje
- Webinars en vivo
- Asistencia mediante chatbot
Atención al cliente (10% de la puntuación total)
Para evaluar los servicios de soporte al cliente de cada proveedor de software, consideré lo siguiente:
- Disponibilidad de soporte 24/7
- Tiempo de respuesta
- Soporte multicanal
- Acceso a base de conocimientos
- Asistencia personalizada
Relación calidad-precio (10% de la puntuación total)
Para evaluar la relación calidad-precio de cada plataforma, consideré lo siguiente:
- Precios competitivos
- Conjunto de características ofrecidas
- Flexibilidad de licencias
- Costo de complementos
- Retorno de inversión
Opiniones de clientes (10% de la puntuación total)
Para tener una idea de la satisfacción general de los clientes, consideré lo siguiente al leer las reseñas de usuarios:
- Satisfacción del usuario
- Quejas comunes
- Valoración de funcionalidades
- Comentarios sobre el soporte
- Fiabilidad del producto
¿Por qué buscar una alternativa a Datadog?
Aunque Datadog es una buena opción como plataforma de monitoreo en la nube, existen varias razones por las que algunos usuarios buscan soluciones alternativas. Puede que estés buscando una alternativa a Datadog porque…
- Necesitas opciones de precios más asequibles
- Tu equipo requiere una configuración y gestión más sencilla
- Necesitas mejor integración con herramientas específicas
- Tu empresa demanda más opciones de personalización
- Requieres soporte para una región geográfica específica
- Tu equipo necesita mejores controles de privacidad de datos
Si alguna de estas razones te resulta familiar, has llegado al lugar adecuado. Mi lista contiene varias opciones de plataformas de monitoreo en la nube más apropiadas para equipos que afrontan estos retos con Datadog y están en busca de soluciones alternativas.
Características Clave de Datadog
A continuación, algunas de las características clave de Datadog para que puedas contrastar y comparar lo que ofrecen las soluciones alternativas:
- Monitoreo de infraestructura: Supervisa métricas, contenedores y redes para asegurar que tus sistemas funcionen sin problemas.
- Monitoreo del rendimiento de aplicaciones: Ofrece información sobre el rendimiento de aplicaciones y la gestión de bases de datos para optimizar la experiencia del usuario.
- Gestión de registros: Administra logs con funciones como el escaneo de datos sensibles para ayudarte a mantener la seguridad y el cumplimiento.
- Monitoreo de usuarios reales: Rastrea recorridos de los usuarios y el rendimiento del frontend para mejorar la experiencia digital.
- Monitoreo sintético: Simula interacciones de usuarios para asegurar la disponibilidad y el tiempo en línea.
- Monitoreo de seguridad: Proporciona detección de amenazas en tiempo real y gestión de cumplimiento para mantener tus datos seguros.
- Gestión de servicios: Simplifica los flujos de trabajo de respuesta ante incidentes y la gestión de casos para mejorar la eficiencia operativa.
- Capacidades de inteligencia artificial: Utiliza herramientas de IA para la detección de anomalías y el monitoreo del rendimiento de modelos para ofrecer análisis más profundos.
- Monitoreo de aplicaciones sin servidor: Proporciona visibilidad sobre aplicaciones serverless para asegurar un rendimiento óptimo.
¿Qué sigue?
Si estás en el proceso de investigar una plataforma de monitoreo en la nube, conéctate con un asesor de SoftwareSelect para obtener recomendaciones gratuitas.
Rellenas un formulario y tienes una conversación rápida en la que profundizan en los detalles de tus necesidades. Luego recibirás una lista corta de software para revisar. Incluso te acompañarán durante todo el proceso de compra, incluidas las negociaciones de precios.