10 beste Dynatrace-Alternativen im Test 2026

Beste Dynatrace Alternativen Kurzliste
Hier ist meine Kurzliste der besten Alternativen zu Dynatrace:


Als erfahrener Profi im Umgang mit APIs, Microservices und einer Vielzahl von Full-Stack-Technologien weiß ich um die entscheidende Rolle eines effektiven Performance-Monitorings. Im Laufe der Jahre habe ich selbst die Vorzüge umfassender AIOps-Plattformen kennengelernt – also dieser Dynatrace-Alternativen – die eine zügige Fehlerbehebung und Ursachenanalyse ermöglichen.
Diese Alternativen zu Dynatrace punkten nicht nur mit einer anwenderfreundlichen Oberfläche, sondern überzeugen auch durch umfassende Monitoring-Funktionen. Die nahtlose Integration mit bekannten Plattformen wie Slack verbessert die Teamkommunikation in kritischen Situationen. Dank umfangreicher Profiling- und modularer Lösungen steht Ihnen eine leistungsstarke Monitoring-Plattform zur Verfügung, die Ihren Tech-Stack und Ihre Produktivität auf ein neues Niveau hebt.
Was ist Dynatrace?
Dynatrace ist eine Plattform für Application Performance Monitoring (APM), mit der Sie nachverfolgen, analysieren und optimieren können, wie Ihre Anwendungen und Ihre Infrastruktur laufen. Sie wird von DevOps-Teams, SREs und IT-Führungskräften genutzt, die Probleme frühzeitig erkennen und das Nutzererlebnis verbessern möchten. Echtzeitmonitoring, KI-gestützte Warnmeldungen und End-to-End-Tracing helfen dabei, Verlangsamungen zu erkennen, Ursachen zu identifizieren und Systeme reibungslos am Laufen zu halten. Insgesamt unterstützt Dynatrace Ihr Team dabei, Performance-Probleme zu erkennen, bevor sie die Nutzer beeinträchtigen.
Warum Sie unseren Software-Reviews vertrauen können
Seit 2023 testen und bewerten wir SaaS-Entwicklungssoftware. Als Technik-Experten wissen wir, wie entscheidend und schwierig es ist, die richtige Softwareentscheidung zu treffen. Wir investieren viel Zeit in gründliche Recherchen, um unserer Leserschaft bessere Kaufentscheidungen zu ermöglichen.
Wir haben mehr als 2.000 Tools für verschiedene SaaS-Entwicklungs-Anwendungsfälle getestet und über 1.000 ausführliche Software-Reviews geschrieben. Erfahren Sie wie wir transparent bleiben und sehen Sie sich unsere Review-Methodik für Software an.
Zusammenfassung: Die besten Dynatrace Alternativen
Diese Vergleichstabelle fasst die Preisinformationen meiner wichtigsten Dynatrace-Alternativen zusammen und hilft Ihnen, die passende Lösung für Ihr Budget und Ihre Geschäftsanforderungen zu finden.
| Tool | Best For | Trial Info | Price | ||
|---|---|---|---|---|---|
| 1 | Best for real-time error resolution | Free plan + free demo available | From $26/month (billed annually) | Website | |
| 2 | Best for extensive technology support | 30-day free trial + free demo + free plan availabl | From $199/year | Website | |
| 3 | Best for diverse application environments | Free demo + 30-day free trial available | From $9/month (billed annually) | Website | |
| 4 | Best for comprehensive IT infrastructure monitoring | Free plan and free demo available | From $2,595 (perpetual license for 100 nodes) | Website | |
| 5 | Best for unified cloud service tracking | 14-day free trial + free plan available | From $15/host/month (billed annually) | Website | |
| 6 | Best for enterprise-level open-source monitoring | Free download available | Pricing upon request | Website | |
| 7 | Best for comprehensive application performance monitoring | Free trial + free demo available | Pricing upon request | Website | |
| 8 | Best for real-time business performance visibility | Free trial available | Pricing upon request | Website | |
| 9 | Best for log management and security analytics | 30-day free trial | Pricing upon request | Website | |
| 10 | Best for robust monitoring in Kubernetes environments | Free-forever plan available | Free to use | Website |
-

Site24x7
Visit WebsiteThis is an aggregated rating for this tool including ratings from Crozdesk users and ratings from other sites.4.6 -
GitHub Actions
Visit WebsiteThis is an aggregated rating for this tool including ratings from Crozdesk users and ratings from other sites.4.8 -
Docker
Visit WebsiteThis is an aggregated rating for this tool including ratings from Crozdesk users and ratings from other sites.4.6


Bewertungen der besten Dynatrace Alternativen
Nachfolgend finden Sie meine ausführlichen Übersichten zu den besten Dynatrace-Alternativen, die es auf meine Kurzliste geschafft haben. Meine Bewertungen bieten Ihnen einen detaillierten Einblick in Schlüsselfunktionen, Stärken & Schwächen, Integrationen sowie ideale Anwendungsfälle jedes Tools, um Ihnen die beste Auswahl zu ermöglichen.
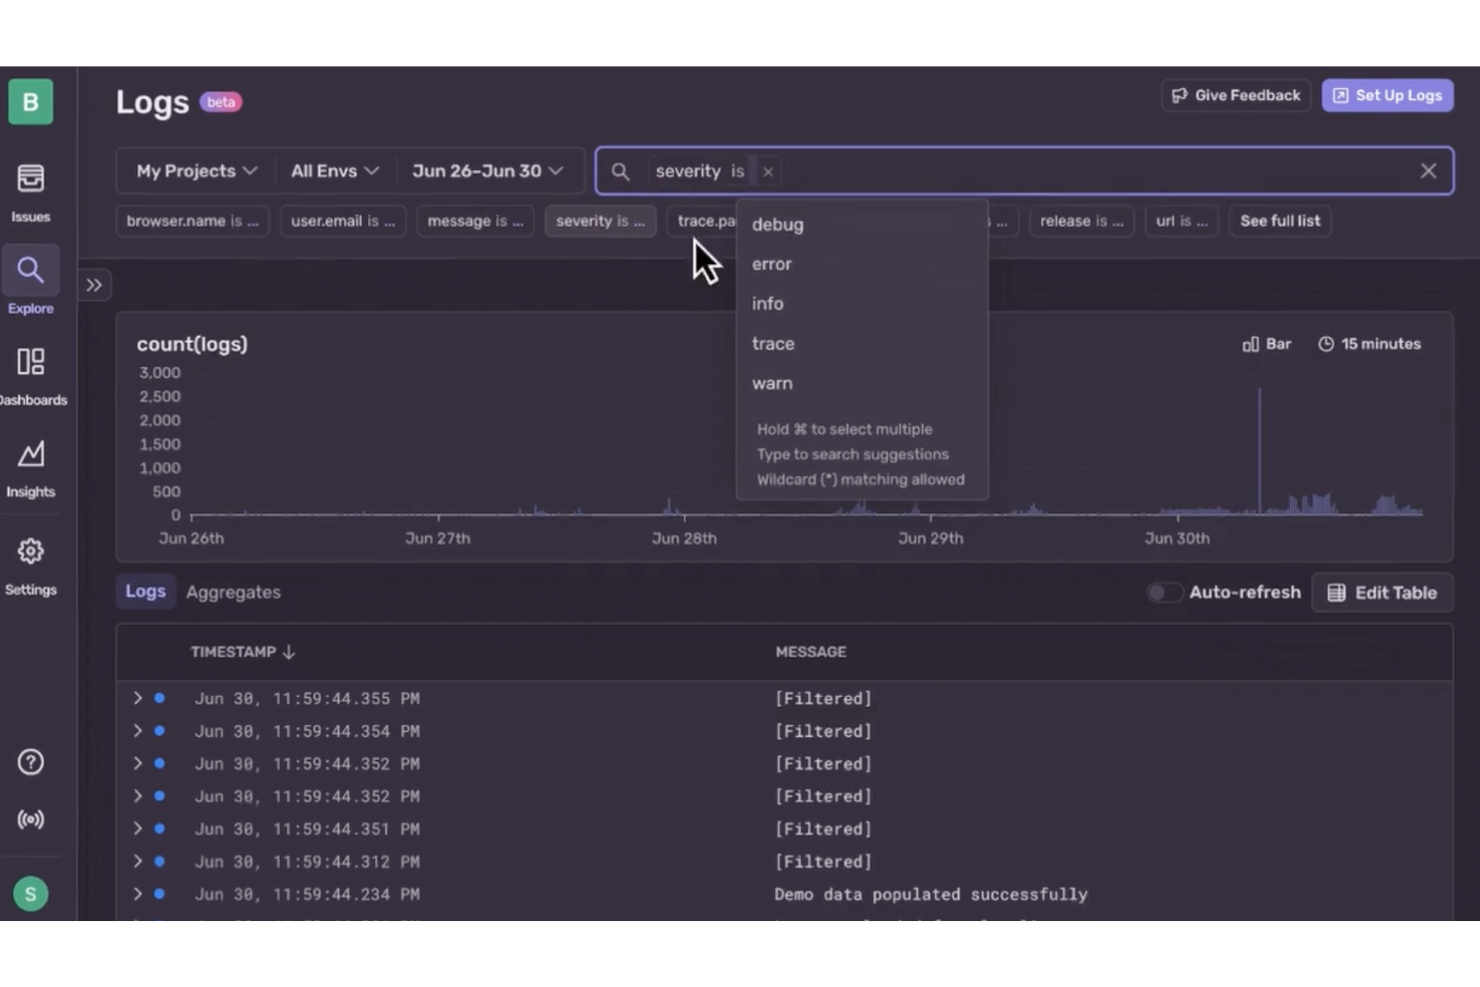
If you're seeking a reliable alternative to Dynatrace, Sentry might just be the solution your development team needs. Designed primarily for developers, Sentry offers an intuitive platform for application performance monitoring and error tracking. It appeals especially to software engineers, web and mobile developers, and IT operations teams who are keen on identifying and resolving application issues in real time. By integrating seamlessly into existing workflows, Sentry helps teams maintain high-quality service and improve user experience, addressing the challenge of efficiently managing and resolving application errors.
Why I Picked Sentry
I picked Sentry as a compelling Dynatrace alternative for its focus on real-time error resolution and detailed error context. Its error-monitoring feature lets your team capture and group unhandled exceptions, providing immediate insights into issues affecting your applications. Additionally, Sentry's session replay functionality provides a deep dive into user interactions, helping you trace errors back to specific code lines. These capabilities enable your team to quickly identify and address performance bottlenecks, making Sentry an ideal choice for developers focused on maintaining seamless application performance.
Sentry Key Features
In addition to real-time error resolution, Sentry offers:
- Distributed Tracing: Gain visibility into interactions between frontend and backend systems to diagnose performance issues.
- Release Health Monitoring: Monitor the impact of software releases on application performance, ensuring that updates do not introduce errors.
- Recurring Job Monitoring: Keep an eye on scheduled jobs to ensure they run as expected and identify potential issues quickly.
Sentry Integrations
Integrations include GitHub, Bitbucket, GitLab, Azure DevOps, Heroku, Split, GitHub Actions, Vercel, Netlify, and Expo.
Pros and Cons
Pros:
- Effective frontend observability with session replay features
- Comprehensive monitoring, including performance and crash reporting
- Strong error tracking with per-user exception tracking
Cons:
- Less coverage for infrastructure-level monitoring
- Complex implementation especially for diverse platform stacks
New Product Updates from Sentry

Sentry Enhances Alerting Across Uptime and Metrics
Sentry introduces expanded alert configuration for Uptime Monitors and adds alerting support to its Metrics open beta. These updates improve issue detection by enabling more flexible monitoring conditions and proactive alerts. For more information, visit Sentry’s official site.
 .
.Best for extensive technology support
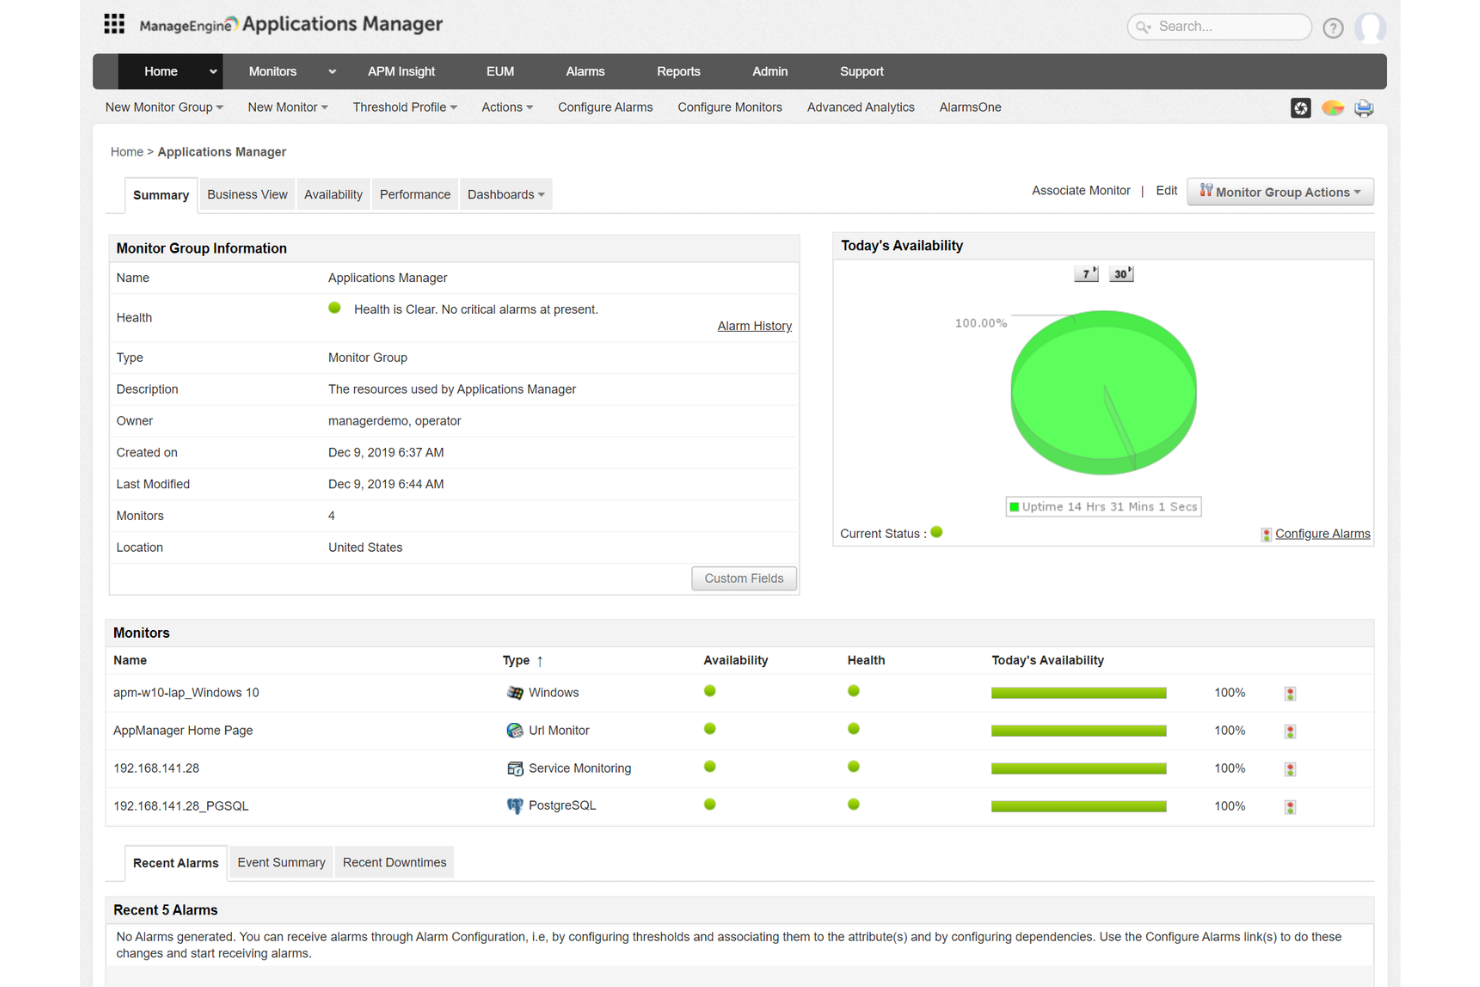
ManageEngine Applications Manager is an application performance monitoring (APM) solution that helps you oversee the health and performance of your business-critical applications and infrastructure components.
Why I Picked ManageEngine Applications Manager:
One reason I like ManageEngine Applications Manager as a Dynatrace alternative is its extensive support for over 150 technologies. This means you can monitor a wide array of applications and infrastructure components, ensuring comprehensive oversight of your IT environment. The tool's ability to provide detailed insights into various systems allows your team to maintain optimal performance across the board.
Standout Features & Integrations:
Other features include synthetic transaction monitoring, which lets you simulate user interactions to identify potential issues before they affect actual users. Additionally, real user monitoring captures the experiences of real users, providing insights into how your applications perform under various conditions. Some integrations include ADManager Plus, M365 Manager Plus, OpManager, Site24x7, Log360, EventLog Analyzer, Endpoint Central, ServiceDesk Plus, CloudDNS, CloudSpend, and Zoho Creator.
Pricing:
Pricing for ManageEngine Applications Manager is available upon request.
Pros and Cons
Pros:
- The platform offers customizable dashboards
- Real-time monitoring and alerting to promptly address issues
- Comprehensive monitoring capabilities across various applications and servers
Cons:
- Can be resource-intensive on larger scales
- Initial setup can be complex, requiring careful configuration
New Product Updates from ManageEngine Applications Manager

ManageEngine Adds Amazon VPC Monitoring Support
ManageEngine Applications Manager now supports Amazon VPC monitoring, allowing users to track network health and activity efficiently. For more information, visit ManageEngine Applications Manager's official site.
 .
.
Site24x7 is a cloud-based, AI-powered IT monitoring solution that provides comprehensive visibility into your organization's IT environment. It offers monitoring capabilities across websites, servers, networks, applications, and cloud platforms, ensuring optimal performance and availability.
Why I Picked Site24x7:
One reason I like Site24x7 as an alternative to Dynatrace is its application performance monitoring (APM) capabilities. Site24x7 supports various programming languages, including Java, .NET, Ruby, PHP, and Node.js, allowing you to monitor application performance across diverse environments. This feature helps identify application servers and components generating errors, enabling your team to address issues proactively and maintain seamless user experiences.
Standout Features & Integrations:
Other features include network monitoring that provides deep visibility into critical network devices like routers, switches, and firewalls, helping ensure reliability and performance. Additionally, Site24x7 offers log management from the cloud, allowing you to collect, consolidate, index, and search application logs across servers and data centers. Some integrations include Amazon EventBridge, Zoho Analytics, Jira, Microsoft Teams, Slack, AWS, and Microsoft Azure.
Pricing:
Pricing for Site24x7 begins at $35/month (billed annually), with a 30-day free trial available.
Pros and Cons
Pros:
- Comprehensive monitoring capabilities across various IT infrastructure components
- Reliable real-time alerts that enable prompt issue resolution
- Flexible customization options for dashboards and reports
Cons:
- Configuration complexity can be challenging for new users
- Limited integration options with certain third-party tools
New Product Updates from Site24x7

Site24x7 Enhances Network Monitoring With Device and Visibility Updates
Site24x7 introduces proactive hardware health monitoring, expanded device support, centralized network controls, and enhanced SD-WAN visualization to improve network monitoring and management. For more information, visit Site24x7’s official site.
 .
.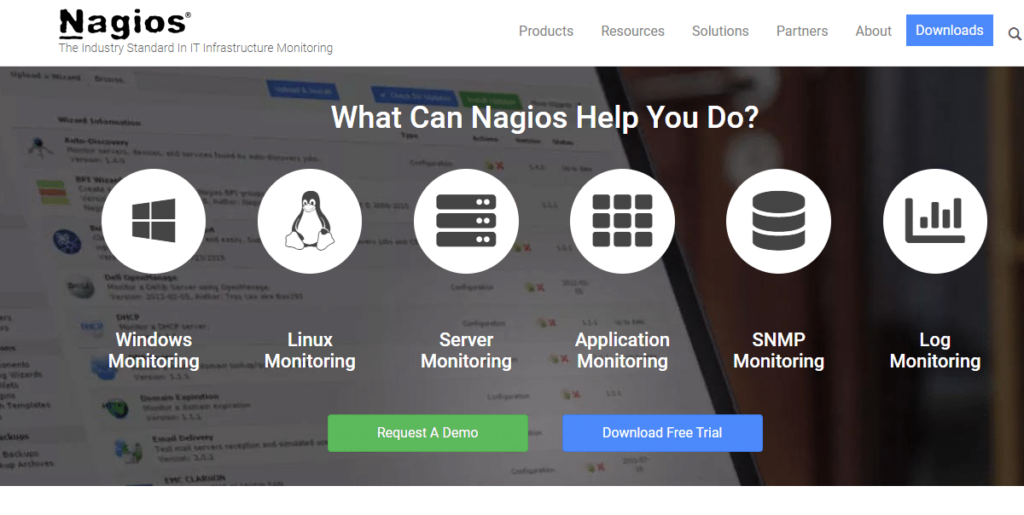
Nagios is a powerful monitoring system that enables organizations to identify and resolve IT infrastructure problems before they affect critical business processes. Given its comprehensive coverage of IT infrastructure monitoring, Nagios is particularly adept at ensuring systems, networks, and applications are operating optimally.
Pros and Cons
Pros:
- Wide range of integrations
- Advanced alerting system
- Comprehensive IT infrastructure monitoring
Cons:
- No official support for the open-source version
- Advanced features require paid plan
- Might be complex for beginners
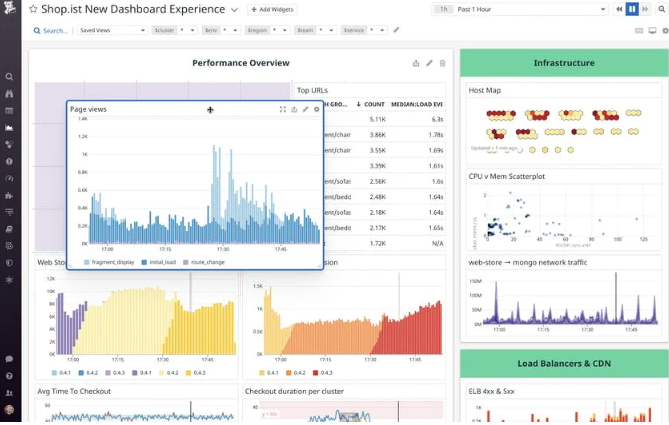
Datadog provides a comprehensive monitoring service for cloud-scale applications. It is a go-to solution for businesses that operate within a cloud environment, making it the best choice for unified cloud service tracking.
Pros and Cons
Pros:
- Real-time dashboards offer immediate insights
- Extensive integration possibilities
- Comprehensive tracking for cloud services
Cons:
- Customization options can be overwhelming
- Setup can be complex for beginners
- Pricing may be high for small organizations
Zabbix is an enterprise-grade, open-source monitoring solution tailored for tracking, recording, alerting, and visualizing data from a diverse array of IT components. The reason it excels at enterprise-level open-source monitoring is due to its scalability, feature-rich platform, and ability to integrate with various systems and applications.
Pros and Cons
Pros:
- Strong community and professional support
- Comprehensive set of features
- Excellent scalability
Cons:
- Advanced support requires additional cost
- Configuration may require a substantial amount of time
- The learning curve can be steep
New Relic is a platform that provides an extensive range of solutions for monitoring and optimizing application performance. The software offers an impressive blend of tools, enabling users to track every aspect of their application lifecycle, justifying its position as best for comprehensive application performance monitoring.
Pros and Cons
Pros:
- Features customizable dashboards for unique user experience
- Provides robust set of integrations
- Offers comprehensive application performance monitoring
Cons:
- Smaller teams might not utilize all features
- Pricing can be complex
- Higher learning curve due to broad feature set
AppDynamics offers a suite of monitoring tools designed to provide deep insights into your business performance. This platform excels at giving a real-time view of your business metrics, making it ideal for those needing immediate visibility into their performance.
Pros and Cons
Pros:
- Comprehensive application and infrastructure monitoring
- Robust integrations with popular platforms
- Provides real-time business performance visibility
Cons:
- Interface may seem cluttered due to the amount of data presented
- May be complex for beginners
- Can be expensive for smaller teams
Sumo Logic is a cloud-based platform that excels in aggregating, analyzing, and visualizing log data to aid in IT operations, application monitoring, and security analytics. Its potent capacity for log management, coupled with advanced security analytics, makes it a standout choice for teams focusing on these areas.
Pros and Cons
Pros:
- Predictive insights through machine learning
- Effective integrations with various platforms and services
- Robust log management and security analytics
Cons:
- Heavy dependency on internet connectivity due to its cloud-based nature
- The interface may be complex for some users
- High cost can be a barrier for small to medium-sized organizations
Prometheus is an open-source service monitoring system and time series database. It collects metrics from monitored targets by scraping metrics HTTP endpoints on these targets, which complements its position as the best for robust monitoring in Kubernetes environments.
Pros and Cons
Pros:
- Powerful query language, PromQL
- Robust monitoring capabilities in Kubernetes environments
- Open-source and highly flexible
Cons:
- Visualization features are not as extensive as some other tools
- Lacks native long-term storage capabilities
- Can be complex to set up and use
Weitere Dynatrace Alternativen
Hier sind einige weitere Alternativen zu Dynatrace, die es zwar nicht in meine Kurzliste geschafft haben, aber dennoch einen Blick wert sind:
- Splunk
For large-scale data analysis and insights
- Grafana Cloud
For open-source visualization and analytics
- SolarWinds Observability SaaS
For AI-driven alert prioritization
- Elastic
For real-time search and data analytics
- Sysdig
For container and Kubernetes security
- Dotcom Monitor
For real-browser simulations
- Honeycomb
Good for observability and debugging in production systems
- LogicMonitor
Good for SaaS-based, agentless monitoring
- Pingdom
Good for uptime, performance, and user experience monitoring
- Auvik
Good for comprehensive network infrastructure management
- Sensu
Good for robust event filtering in monitoring workflows
- ThousandEyes
Good for network intelligence and visualizing network paths
- Icinga
Good for comprehensive monitoring with strong community support
- Instana
Good for real-time performance monitoring with automatic APM
- Stackify Retrace
Good for deep code-level insights for developers
- Scout APM
Good for developers wanting detailed performance insights
- Opsview
Good for businesses seeking customizable dashboards and reporting
- Wavefront by VMware
Good for scalable, high-granularity observability and analytics
- Riverbed
Good for network performance monitoring with digital experience focus


Weitere Software-Reviews
Dynatrace Alternativen Auswahlkriterien
Durch meine umfassende Erfahrung mit IT-Monitoring-Software habe ich unzählige Tools ausprobiert, getestet und recherchiert. Für diese Review habe ich mehr als 30 Tools bewertet und dabei besonders auf die Grundfunktionen, wichtige Merkmale sowie Benutzerfreundlichkeit geachtet, um die spezifischen Anforderungen von Unternehmen auf der Suche nach den besten Netzwerküberwachungs-Lösungen zu erfüllen. Das war mir dabei am wichtigsten.
Kernfunktionen
- Überwachungsfunktionen: Das Tool sollte einen ganzheitlichen Überblick über den Zustand des Netzwerks bieten, einschließlich Servern, Geräten und Anwendungen.
- Alarmierungsmechanismus: Sofortige Benachrichtigungen bei auftretenden Problemen sind unerlässlich, um Ausfallzeiten zu vermeiden.
- Berichterstattung: Die Möglichkeit, detaillierte Berichte für Analysen und datengestützte Entscheidungen zu erstellen.
Wesentliche Funktionen
- Anpassbare Dashboards: Dashboards sollten leicht anpassbar sein, um relevante Kennzahlen nach den Präferenzen des Nutzers anzuzeigen.
- Skalierbarkeit: Die Software sollte in der Lage sein, mit dem Wachstum mitzuhalten und eine steigende Arbeitslast in der Netzwerkinfrastruktur zu bewältigen.
- Integration: Das Tool sollte nahtlos mit anderen Plattformen oder in der Organisation genutzten Programmen zusammenarbeiten, um die Abläufe zu optimieren.
Benutzerfreundlichkeit
- Benutzeroberfläche: Die Benutzeroberfläche sollte intuitiv und nicht übermäßig kompliziert sein, damit Nutzer schnell verschiedene Funktionen verstehen und navigieren können.
- Einfache Einrichtung: Die Erstinstallation und der Onboarding-Prozess sollten unkompliziert sein und keinen großen Zeitaufwand erfordern.
- Kundensupport: Es ist entscheidend, einen reaktionsschnellen und kompetenten Kundenservice zu haben, der bei Problemen oder Fragen schnell hilft.
- Schulungsressourcen: Angesichts der Komplexität von Netzwerküberwachungstools ist eine gut strukturierte Lernbibliothek oder Schulungsressource für das Onboarding von Anwendern sehr vorteilhaft.
Warum nach einer Dynatrace-Alternative suchen?
Obwohl Dynatrace eine gute Wahl als Plattform für Application Performance Monitoring (APM) ist, gibt es verschiedene Gründe, warum einige Anwender nach Alternativen suchen. Vielleicht suchen Sie nach einer Dynatrace-Alternative, weil…
- Die Preisgestaltung für kleinere Teams zu hoch werden kann
- Die Lernkurve für neue Nutzer zu steil erscheint
- Sie einfachere Dashboards und Berichte wünschen
- Sie flexiblere Optionen für Alarmierung und Benachrichtigungen benötigen
- Sie eine hybride Infrastruktur betreiben und breitere Integrationen benötigen
- Sie Tools bevorzugen, bei denen die Abrechnung transparenter gestaltet ist
Wenn Ihnen einer dieser Punkte bekannt vorkommt, sind Sie hier genau richtig. Meine Liste enthält mehrere Plattformoptionen für Application Performance Monitoring (APM), die für Teams, die vor diesen Herausforderungen mit Dynatrace stehen, besser geeignet sind und alternative Lösungen bieten.
Dynatrace: Wichtige Funktionen
Hier sind einige der wichtigsten Funktionen von Dynatrace, damit Sie vergleichen und abwägen können, was Alternativen bieten:
- Vollständige Überwachung des gesamten Stacks: Ermöglicht Ihnen die Überwachung der Anwendungsleistung, Infrastruktur und Nutzererfahrung an einem Ort.
- Davis KI-Engine: Erkennt automatisch Probleme und erklärt die Ursachen, sodass Ihr Team Zeit spart.
- Real-User-Monitoring: Zeigt, wie reale Nutzer mit Ihrer Anwendung interagieren, damit Sie relevante Probleme beheben können.
- Applikationssicherheit: Meldet Schwachstellen in Echtzeit, während Ihr Code in der Produktion läuft.
- Cloud-native Unterstützung: Funktioniert gut mit Kubernetes, AWS, Azure und anderen Cloud-Umgebungen.
- Intelligentes Alarmieren: Sendet nur bei Bedarf Alarme, sodass Ihr Team keine Alarmüberflutung erlebt.
- Individuelle Dashboards: Erlaubt es Ihnen, Ansichten nach den Bedürfnissen und Kennzahlen Ihres Teams zu erstellen.
- Code-Einblick auf Zeilenebene: Hilft Ihnen, Leistungsprobleme bis auf einzelne Codezeilen nachzuvollziehen.
- Log-Management: Ermöglicht das Suchen, Filtern und Analysieren von Logs, um Probleme schneller zu beheben.
- Synthetisches Monitoring: Simuliert Benutzeraktionen, damit Sie die Anwendungsleistung aus verschiedenen Standorten testen können.
Fazit
In diesem Kaufratgeber haben wir uns intensiv mit Dynatrace-Alternativen beschäftigt und verschiedene Optionen für spezifische Anwendungsfälle vorgestellt. Egal, ob Sie ein Tool für unternehmensweites Open-Source-Monitoring, Log-Management und Sicherheitsanalysen oder Container- und Kubernetes-Sicherheit suchen, es gibt viele robuste Möglichkeiten zur Auswahl.
Hier sind drei wichtige Erkenntnisse aus diesem Ratgeber:
- Bewerten Sie Ihren Bedarf: Verschiedene Tools sind für unterschiedliche Anwendungsfälle konzipiert. Einige eignen sich besonders für umfangreiches Log-Management, andere für Open-Source-Umgebungen und wiederum andere für Container- und Kubernetes-Sicherheit. Wenn Sie die spezifischen Anforderungen Ihrer Organisation kennen, finden Sie das passende Tool.
- Schauen Sie sich die Funktionen an: Viele Tools bieten ähnliche Kernfunktionen, aber die Unterschiede liegen oft im Detail. Die besonderen Funktionen jedes Tools, deren Benutzerfreundlichkeit und die Integration mit anderen von Ihnen verwendeten Tools können Ihr Monitoring-Erlebnis maßgeblich beeinflussen.
- Berücksichtigen Sie die Preisgestaltung: Natürlich spielt der Preis oft eine große Rolle, aber Sie sollten immer darauf achten, was Sie für Ihr Geld bekommen. Ein teureres Tool kann genau die umfassenden Funktionen oder den benötigten Support bieten, während in einigen Fällen ein günstigeres oder sogar kostenloses Tool ausreichend sein kann.
Denken Sie daran, dass das „beste“ Tool immer von den individuellen Anforderungen und Gegebenheiten Ihrer Organisation abhängt. Mit den Informationen aus diesem Leitfaden sind Sie bestens gerüstet, eine fundierte Entscheidung zu treffen.
Was meinen Sie?
Natürlich kann keine Liste alle großartigen Dynatrace-Alternativen abdecken. Es gibt womöglich weitere empfehlenswerte Dynatrace- oder New Relic Alternativen, die ich in diesem Leitfaden nicht behandelt habe. Wenn Sie ein Tool kennen oder nutzen, das Ihrer Meinung nach einen Platz auf dieser Liste verdient hätte, teilen Sie gern Ihre Meinung mit uns.
Ihre Erfahrungen und Einschätzungen können anderen, die nach passenden Optionen suchen, sehr weiterhelfen. Ich freue mich auf Ihr Feedback.