Die 10 besten Tools zur Überwachung von Cloud-Infrastrukturen 2026

10 Beste Cloud-Infrastruktur-Monitoring-Tools Auswahl


Die reibungslose Funktion der Cloud-Infrastruktur hängt nicht nur von der Betriebszeit ab – entscheidend ist, Leistungsprobleme frühzeitig zu erkennen, Skalierbarkeit ohne Verschwendung sicherzustellen und Transparenz in komplexen Umgebungen zu gewährleisten. Wer schon einmal mit unerklärlichen Verlangsamungen, unerwarteten Ausfällen oder fehlender Echtzeiteinsicht zu kämpfen hatte, weiß, wie schwer es ohne die richtigen Monitoring-Tools ist, Problemen zuvorzukommen.
Cloud-Infrastruktur-Monitoring-Tools ermöglichen eine zentrale Überwachung von Anwendungsleistung, Netzwerkaktivität und Ressourcennutzung in Cloud-Umgebungen. Im Laufe der Jahre habe ich eine Vielzahl dieser Tools getestet und bewertet, wie gut sie Probleme erkennen, Reaktionszeiten verkürzen und sich in bestehende Workflows integrieren lassen. In diesem Leitfaden stelle ich Ihnen die besten verfügbaren Optionen vor, damit Sie eine Lösung finden, die zu Ihren Anforderungen im Cloud-Monitoring passt.
Table of Contents
- Beste Software-Auswahl
- Warum Sie Uns Vertrauen Können
- Spezifikationen vergleichen
- Rezensionen
- Weitere Tools zur Überwachung von Cloud-Infrastrukturen
- Verwandte Software-Bewertungen
- Auswahlkriterien
- So Wählen Sie Aus
- Trends bei Tools zur Überwachung von Cloud-Infrastrukturen
- Was sind Tools zur Überwachung von Cloud-Infrastrukturen
- Funktionen
- Vorteile
- Kosten und Preise
- FAQs
Warum Sie unseren Software-Bewertungen vertrauen können
Wir testen und bewerten seit 2023 Software. Als Technologie-Führungskräfte wissen wir, wie kritisch und herausfordernd es ist, die richtige Entscheidung bei der Softwareauswahl zu treffen.
Wir investieren viel in gründliche Recherche, um unserer Zielgruppe zu helfen, bessere Kaufentscheidungen zu treffen. Wir haben über 2.000 Tools für verschiedene Technikanwendungsfälle getestet und mehr als 1.000 umfassende Softwarebewertungen geschrieben. Erfahren Sie wie wir transparent bleiben und unsere Methodik der Softwarebewertung.
Zusammenfassung der besten Cloud-Infrastruktur-Monitoring-Tools
| Tool | Best For | Trial Info | Price | ||
|---|---|---|---|---|---|
| 1 | Am besten geeignet für synthetische Transaktionstests | Nein | Preis auf Anfrage | Website | |
| 2 | Am besten für Application Performance Monitoring | Nein | $945 jährlich für bis zu 25 Server oder Anwendungen | Website | |
| 3 | Am besten geeignet zur Überwachung hybrider IT-Infrastrukturen | Nein | Preise auf Anfrage | Website | |
| 4 | Am besten für detaillierte Health-Metriken | Ja | $99/Monat | Website | |
| 5 | Am besten geeignet für den Infrastructure as Code (IaC)-Ansatz | Ja | $20/user/month | Website | |
| 6 | Am besten für die IBM Cloud-Umgebung | Nein | $10 pro Million erfasster Metriken/Monat | Website | |
| 7 | Geeignet für vereinheitlichte Anwendungs- und Infrastrukturdaten | 30-tägige kostenlose Testversion | $5/GB/Monat | Website | |
| 8 | Beste Lösung für Open-Source-Cloud-Monitoring | Not available | Kostenlos, kostenpflichtiger Support ab $1000/Monat | Website | |
| 9 | Am besten für Echtzeit-Transparenz | Nein | $60 pro Host und Monat | Website | |
| 10 | Am besten geeignet für Transparenz in allen Netzwerkpfaden | Nein | Individuelle Preisgestaltung | Website |
-

TestDevLab
Visit Website -
Site24x7
Visit WebsiteThis is an aggregated rating for this tool including ratings from Crozdesk users and ratings from other sites.4.7 -
GitHub Actions
Visit WebsiteThis is an aggregated rating for this tool including ratings from Crozdesk users and ratings from other sites.4.8


Cloud-Infrastruktur-Monitoring-Tools im Test
Im Folgenden finden Sie meine ausführlichen Zusammenfassungen der besten Cloud-Infrastruktur-Monitoring-Tools, die es auf meine Shortlist geschafft haben. Die Bewertungen bieten einen detaillierten Überblick über die wichtigsten Funktionen, Vor- & Nachteile, Integrationen sowie ideale Einsatzbereiche, damit Sie das passende Tool für sich finden.
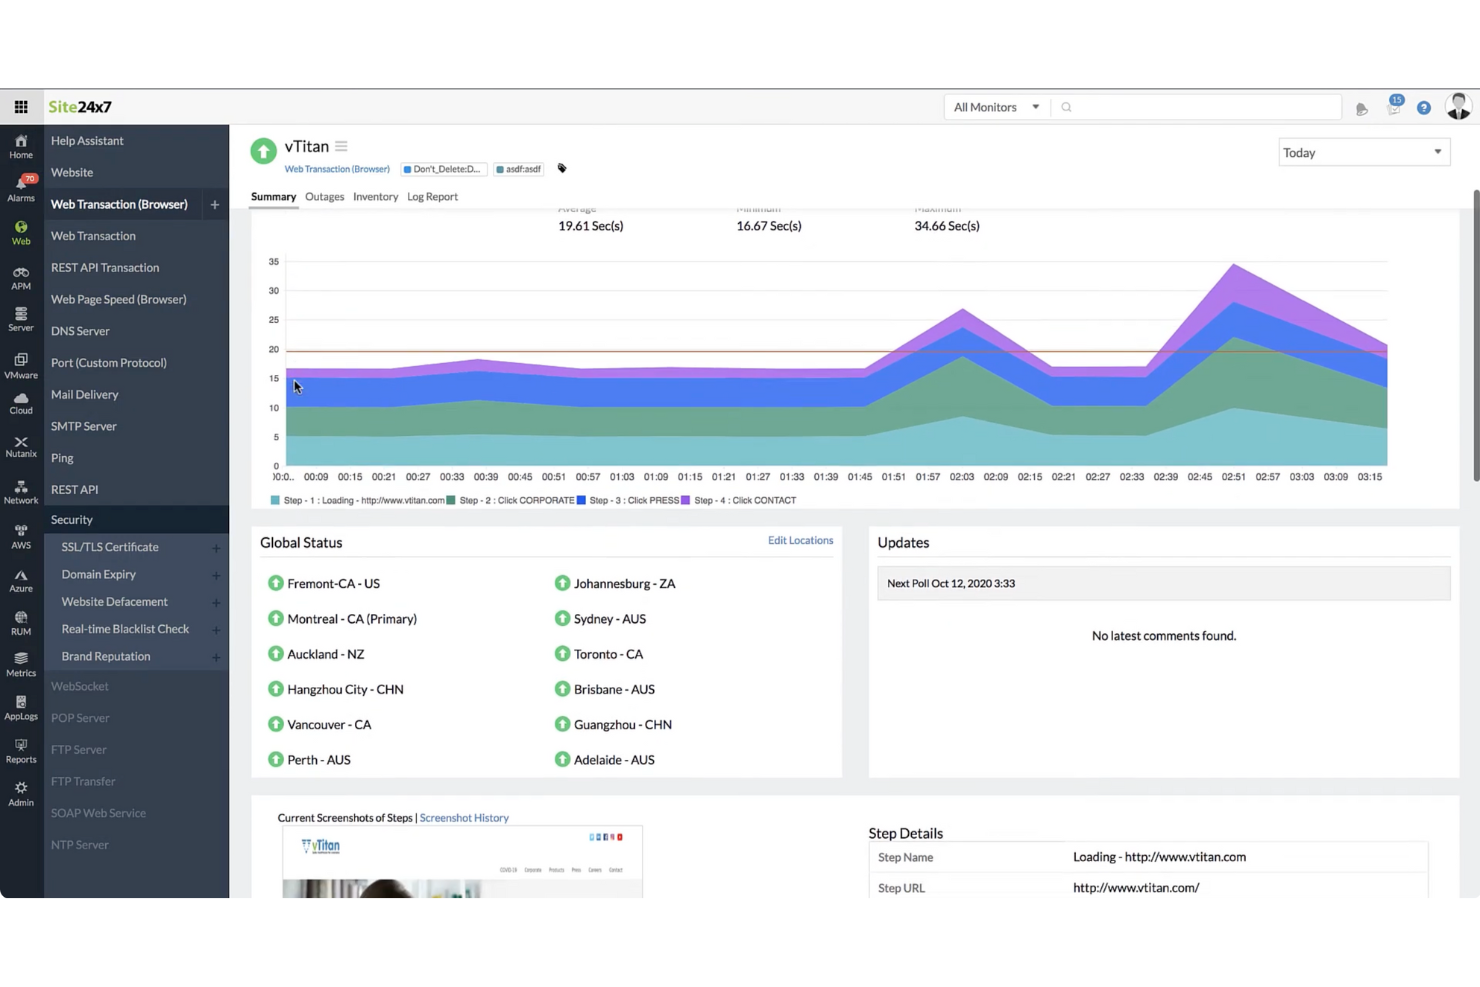
Für Unternehmen, die komplexe Cloud-Infrastrukturen verwalten, bietet Site24x7 eine Überwachungslösung, die synthetische Transaktionstests umfasst, um die Serviceverfügbarkeit und -leistung nachzuverfolgen. Sie richtet sich an IT-Teams und Organisationen, die eine klare Sicht auf ihre Cloud-Umgebungen benötigen und dabei Probleme wie Leistungsverlangsamungen, Ressourcennutzung und Incident Response angehen müssen. Mit Abdeckung der wichtigsten Cloud-Plattformen und einer Vielzahl an Überwachungsfunktionen unterstützt Site24x7 Teams dabei, stabile Betriebsabläufe und eine konsistente Nutzererfahrung aufrechtzuerhalten.
Warum ich Site24x7 ausgewählt habe
Ich habe mich für Site24x7 aufgrund seiner synthetischen Transaktionstests entschieden, die helfen, die Serviceverfügbarkeit zu überwachen, indem sie Benutzer- und Systemabläufe simulieren. Die Plattform unterstützt außerdem die wichtigsten Cloud-Umgebungen und beinhaltet Application Performance Monitoring, um das Verhalten von Anwendungen nachzuverfolgen und Probleme zu erkennen. Ihre Automatisierungsfunktionen unterstützen das Incident Management, sodass Teams schneller reagieren und Ressourcen effizienter verwalten können.
Site24x7 Hauptfunktionen
Neben synthetischen Transaktionstests bietet Site24x7:
- Real User Monitoring (RUM): Dieses Feature liefert Einblicke in die tatsächliche Nutzererfahrung, indem Interaktionen von Benutzern mit Ihren Anwendungen verfolgt und analysiert werden.
- Log-Management: Mit dieser Funktion können Sie Protokolle aus verschiedenen Quellen aggregieren und analysieren, um einen umfassenden Überblick über den Zustand Ihres Systems zu erhalten.
- Netzwerküberwachung: Sie ermöglicht Einblicke in die Netzwerkleistung, unterstützt bei der Fehlerbehebung von Verbindungsproblemen und bei der Optimierung Ihrer Netzwerkinfrastruktur.
Site24x7 Integrationen
Integrationen umfassen Slack, ServiceNow, Moogsoft, Jira, PagerDuty, Freshservice, Microsoft Teams, Amazon EventBridge, Zapier und ManageEngine Analytics Plus.
Pros and Cons
Pros:
- Flexibles Monitoring lässt sich einfach mit mehreren Infrastrukturkomponenten integrieren
- Umfassende Überwachung verschiedener Systeme
- KI-gestütztes Full-Stack-Monitoring unterstützt das Management von Multicloud-Infrastrukturen
Cons:
- Komplexe Konfiguration verlangsamt die initiale Einrichtung und das Verständnis der Plattform
- Alarmierungsfehler verursachen Probleme beim Hinzufügen neuer Überwachungskonfigurationen
New Product Updates from Site24x7

Site24x7 Adds Discovery Issues for AWS Monitoring
Site24x7 added Discovery Issues for AWS monitoring, helping teams identify why resources are not being discovered across services and regions. The feature surfaces permission gaps, policy restrictions, and blocked API actions to support faster troubleshooting. For more information, visit Site24x7’s official site.
 .
.Am besten für Application Performance Monitoring

ManageEngine Applications Manager ist ein leistungsstarkes Tool, das eine umfassende End-to-End-Überwachung für eine breite Palette von Anwendungen, Datenbanken, Servern und Systemen bietet. Besonders herausragend ist es durch seine detaillierten Einblicke in die Anwendungsleistung, was es zur optimalen Lösung für das Application Performance Monitoring macht.
Warum ich ManageEngine Applications Manager ausgewählt habe:
Bei der Aufnahme von ManageEngine Applications Manager in diese Liste berücksichtigte ich seine umfassenden Fähigkeiten zur Überwachung und Verwaltung von Anwendungen in unterschiedlichen Umgebungen. Es hebt sich durch detaillierte Einblicke in die Anwendungsleistung hervor und unterstützt eine schnelle Problemfindung und -lösung.
Daher habe ich es als 'am besten für Application Performance Monitoring' eingestuft, da es in diesem Bereich besonders leistungsfähig ist.
Hervorstechende Funktionen und Integrationen:
Zu den herausragenden Funktionen von ManageEngine Applications Manager gehören die automatische Anwendungserkennung, das tiefgehende Komponenten-Monitoring und intelligente Automatisierung. Diese Funktionen ermöglichen eine robuste Überwachung und automatisierte Problemlösung, sodass die Anwendungsleistung stets optimal bleibt.
In Bezug auf Integrationen kann ManageEngine Applications Manager mit verschiedenen Anwendungen, Servern und Datenbanken wie Oracle, MySQL, Microsoft SQL Server, SAP und vielen anderen integriert werden.
Pros and Cons
Pros:
- Detaillierte Überwachung der Anwendungsleistung
- Breite Kompatibilität mit verschiedenen Anwendungen, Servern und Datenbanken
- Intelligente Automatisierung für Problemlösung
Cons:
- Kann komplex in der Einrichtung und Konfiguration sein
- Hohe Einstiegskosten könnten für kleinere Unternehmen ein Hindernis darstellen
- Benutzeroberfläche möglicherweise nicht so benutzerfreundlich wie einige Alternativen
New Product Updates from ManageEngine Applications Manager
Oracle Cloud Application Monitoring Now Available in ManageEngine Applications Manager
ManageEngine Applications Manager introduces Oracle Cloud Application Monitoring, Oracle Cloud Function Monitoring, and Oracle Cloud NAT Gateway Monitoring. These new capabilities help teams monitor Oracle Cloud applications, serverless workloads, and network resources from a single platform. For more information, visit ManageEngine Applications Manager's official site.
 .
.Am besten geeignet zur Überwachung hybrider IT-Infrastrukturen

LogicMonitor ist eine SaaS-basierte, automatisierte IT-Performance-Überwachungsplattform, die umfassende Transparenz für komplexe IT-Infrastrukturen bietet. Aufgrund seiner Fähigkeit, sowohl lokale als auch Cloud-Umgebungen zu unterstützen, ist es eine erstklassige Wahl zur Überwachung von hybriden IT-Infrastrukturen.
Warum ich LogicMonitor gewählt habe:
Als es darum ging, ein Tool auszuwählen, das sich in der Überwachung von hybriden IT-Infrastrukturen hervorhebt, fiel meine Wahl auf LogicMonitor. Die Vielseitigkeit bei der Unterstützung einer breiten Palette von Infrastrukturen, einschließlich Cloud, On-Premises und hybriden Systemen, hebt es besonders hervor. Ich habe LogicMonitor als das beste Tool für die Überwachung hybrider IT-Infrastrukturen bestimmt, vor allem aufgrund der automatisierten Geräteerkennung und der Fähigkeit, unterschiedliche Systeme zu verwalten.
Herausragende Funktionen und Integrationen:
Die automatisierte Geräteerkennung von LogicMonitor ist besonders bemerkenswert, da sie den Prozess der Hinzufügung neuer Geräte zum System vereinfacht. Ebenso bietet es anpassbare Dashboards, die den Nutzern die Flexibilität geben, ihre Infrastruktur nach ihren individuellen Anforderungen zu überwachen.
Im Bereich der Integrationen unterstützt LogicMonitor verschiedene Cloud-Plattformen wie AWS, Google Cloud und Azure. Darüber hinaus lässt es sich mit wichtigen Business-Tools wie ServiceNow, Slack und Jira verbinden, was den reibungslosen Ablauf der Geschäftsprozesse fördert.
Pros and Cons
Pros:
- Automatisierte Geräteerkennung für einfache Einrichtung
- Anpassbare Dashboards für individuelles Monitoring
- Unterstützt verschiedene Cloud-Plattformen und Geschäftstools
Cons:
- Preise sind nicht transparent
- Einige Nutzer finden die Benutzeroberfläche weniger intuitiv
- Die Einrichtung individueller Dashboards erfordert möglicherweise technisches Know-how

New Relic ist eine cloudbasierte Software-Analyseplattform, die Echtzeit-Dateneinblicke bietet, um Unternehmen dabei zu unterstützen, die Leistung ihrer Softwareanwendungen zu bewerten. Mit seinen detaillierten Health-Metriken eignet sich New Relic besonders für ausführliche Einblicke in den Zustand und die Effizienz dieser Systeme.
Warum ich New Relic ausgewählt habe:
New Relic hat mich durch seine leistungsstarken Analysefähigkeiten überzeugt, weshalb ich es in diese Liste aufgenommen habe. Die Fähigkeit, detaillierte, Echtzeit-Health-Metriken bereitzustellen, hebt es von anderen Tools ab. Meiner Meinung nach ist New Relic das Beste für detaillierte Health-Metriken, da seine umfassenden Datenanalyse- und Visualisierungsmöglichkeiten tiefere Einblicke in die Anwendungsleistung bieten.
Herausragende Funktionen und Integrationen:
Eine der herausragenden Funktionen von New Relic ist das Application Performance Monitoring (APM), das umfassende Einblicke in den Zustand Ihrer Anwendungen bietet. Darüber hinaus verfügt es über ein Real User Monitoring, das Daten darüber liefert, wie Nutzer mit Ihren Anwendungen interagieren.
New Relic lässt sich nahtlos in verschiedene Plattformen wie AWS, Azure, Google Cloud Platform und Kubernetes integrieren. Diese Integrationen ermöglichen einen ganzheitlicheren Blick auf Ihre Infrastruktur und Anwendungen.
Pros and Cons
Pros:
- Detaillierte Health-Metriken für tiefgehende Einblicke
- Große Auswahl an Integrationen mit Cloud-Plattformen
- Umfassende Überwachung der Anwendungsleistung
Cons:
- Hoher Preis für kleine Unternehmen
- Komplexe Benutzeroberfläche, die für Einsteiger schwierig sein kann
- Umfangreiche Funktionen können zu Informationsüberflutung führen
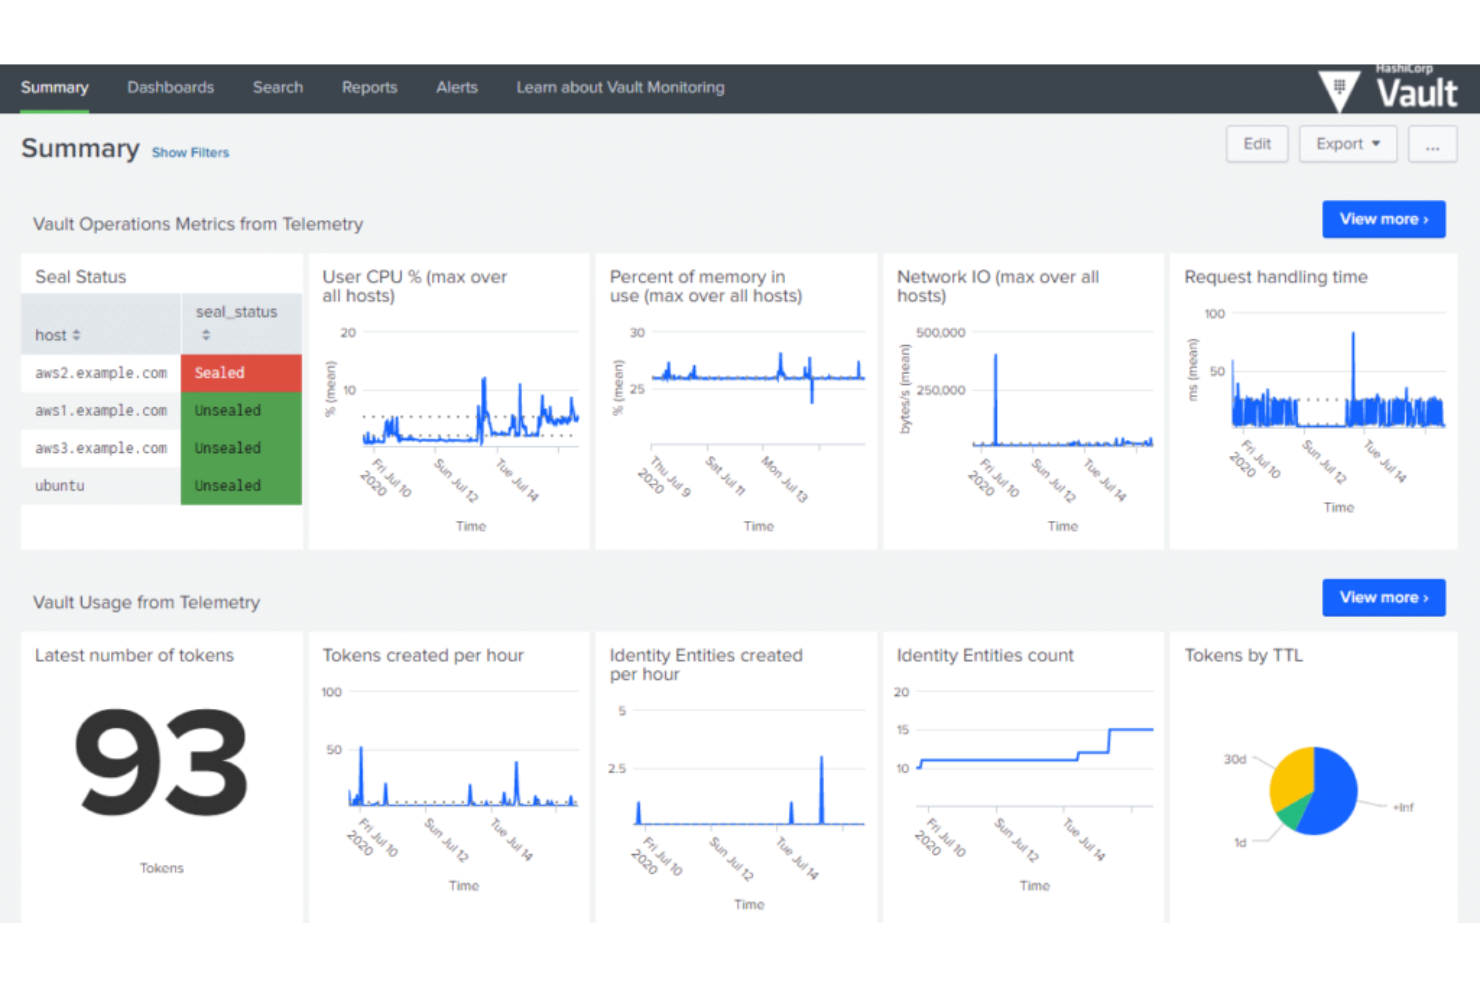
HashiCorp bietet eine Suite von Open-Source-Tools, mit denen Unternehmen Rechenzentrumsinfrastrukturen deklarativ als Code definieren, bereitstellen und verwalten können. Es eignet sich am besten für Unternehmen, die die Methodik Infrastructure as Code (IaC) übernehmen möchten, um die Effizienz zu steigern und Konsistenz im Infrastrukturmanagement zu gewährleisten.
Warum ich HashiCorp ausgewählt habe:
HashiCorp wurde in meine Auswahl aufgenommen, weil es über leistungsstarke IaC-Funktionen verfügt und sich dadurch deutlich im Bereich Infrastrukturmanagement abhebt. Dieser IaC-Ansatz fördert Effizienz, Wiederholbarkeit und Sicherheit bei der Bereitstellung und Verwaltung von Infrastruktur.
Aus diesen Gründen halte ich HashiCorp für 'Am besten geeignet für' Organisationen, die auf den IaC-Ansatz setzen möchten.
Hervorstechende Funktionen und Integrationen:
HashiCorps Tools wie Terraform, Vault und Consul bieten eine breite Palette an Funktionen, die auf Infrastruktur-Bereitstellung, Sicherheit und Service-Netzwerke ausgerichtet sind. Die Möglichkeit von Terraform, Infrastruktur als Code abzubilden, macht es äußerst wertvoll für das Bereitstellen und Verwalten von Infrastrukturen jeglicher Größe.
Wichtige Integrationen umfassen jene mit AWS, GCP und Azure, wodurch die IaC-Fähigkeiten effektiv auf mehrere Cloud-Umgebungen erweitert werden.
Pros and Cons
Pros:
- Hervorragende Infrastructure as Code-Fähigkeiten
- Integriert sich mit großen Cloud-Plattformen
- Bietet eine Vielzahl von Tools für verschiedene Aspekte des Infrastrukturmanagements
Cons:
- Kann komplex in der Einrichtung und Nutzung sein
- Unternehmensversionen können für kleinere Teams teuer sein
- Der Support für kostenlose Nutzer kann eingeschränkt sein
IBM Cloud Monitoring ist ein Überwachungsdienst, der Echtzeit-Einblicke in die Leistungsfähigkeit Ihrer Anwendungen und Infrastruktur bietet, die in der IBM Cloud gehostet werden. Dieses Tool ist speziell darauf ausgelegt, nahtlos mit der IBM Cloud-Umgebung zu funktionieren, was es zur besten Wahl für diejenigen macht, die in diesem Ökosystem investiert sind.
Warum ich mich für IBM Cloud Monitoring entschieden habe:
Die Entscheidung, IBM Cloud Monitoring in die Liste aufzunehmen, war eindeutig, angesichts seiner überlegenen Integration und nativen Kompatibilität mit der IBM Cloud-Umgebung. Es fällt durch seine reibungslose Interoperabilität mit den verschiedenen Diensten der IBM Cloud auf.
Ich habe es als 'am besten für die IBM Cloud-Umgebung' bewertet, da es die Möglichkeit bietet, detaillierte Metriken, Dashboards und Benachrichtigungen speziell für die IBM Cloud bereitzustellen.
Herausragende Funktionen und Integrationen:
Die detaillierten Metriken von IBM Cloud Monitoring liefern eine Fülle von Daten zur Leistung Ihrer Infrastruktur. Besonders bemerkenswert ist die Fähigkeit, Echtzeit-Überwachungsdaten bereitzustellen und eine schnelle Erkennung von Anomalien zu ermöglichen.
Was die Integrationen angeht, lässt es sich reibungslos mit verschiedenen IBM Cloud-Diensten integrieren, darunter IBM Cloud Databases, IBM Kubernetes Service und IBM Cloud Functions, um nur einige zu nennen.
Pros and Cons
Pros:
- Nahtlose Integration mit IBM Cloud-Diensten
- Detaillierte Metriken bieten umfassende Einblicke
- Echtzeit-Überwachung und Anomalieerkennung
Cons:
- Preisgestaltung kann komplex sein und vom Verbrauch abhängen
- Eventuell keine gute Integration mit Nicht-IBM-Diensten
- Benutzeroberfläche erfordert möglicherweise eine gewisse Einarbeitung für neue Nutzer
Geeignet für vereinheitlichte Anwendungs- und Infrastrukturdaten
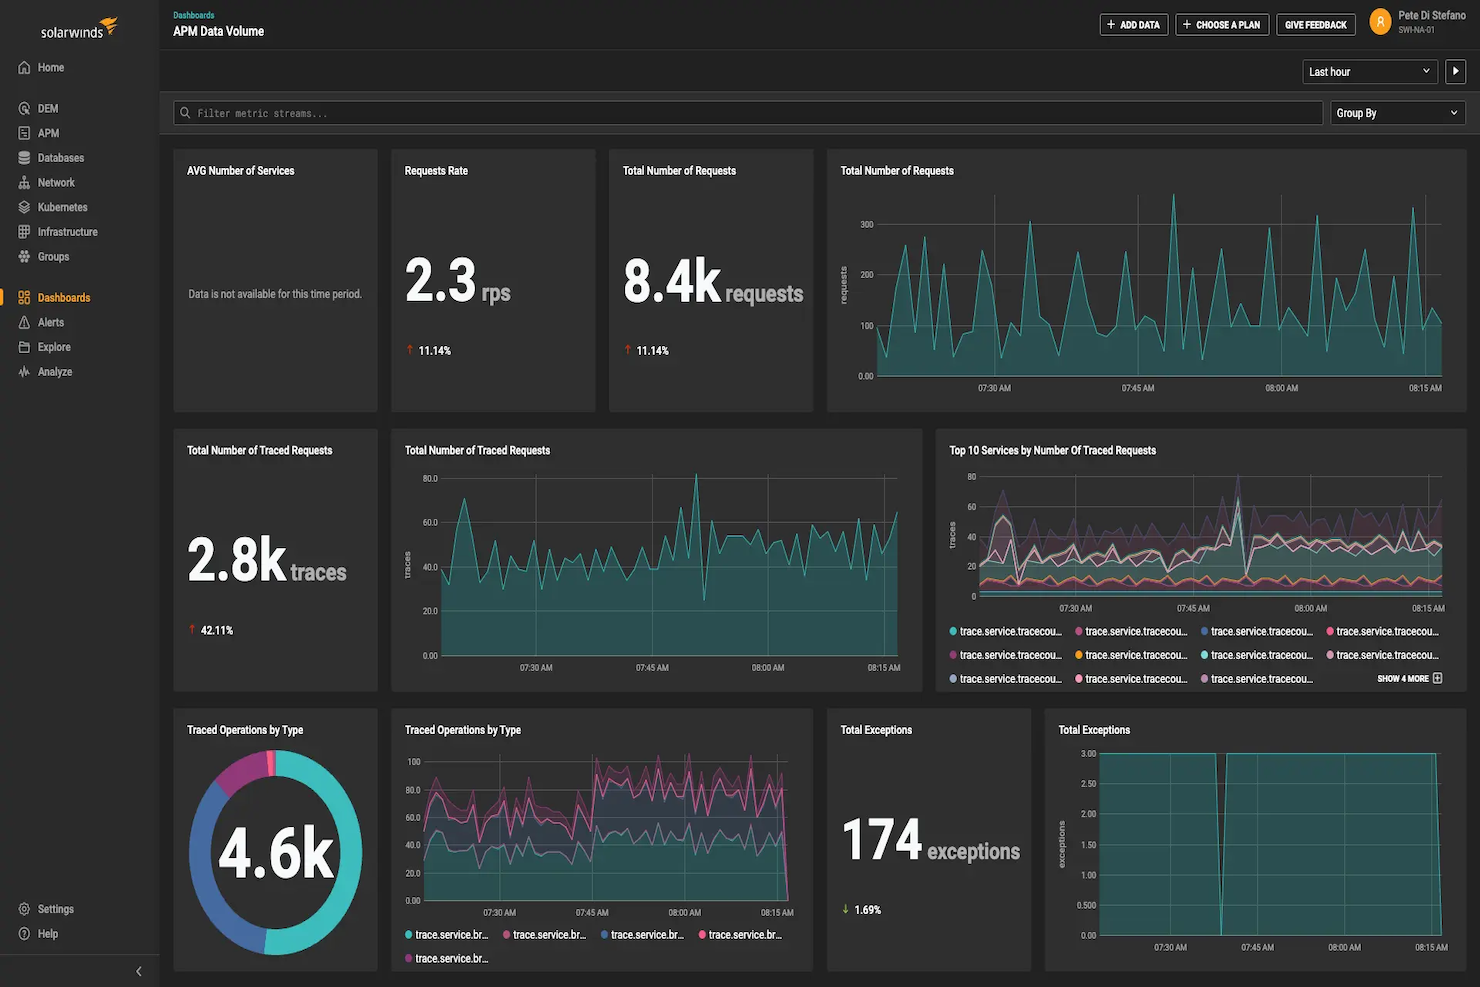
SolarWinds Observability SaaS ist eine Cloud-Infrastrukturüberwachungsplattform für IT- und DevOps-Teams. Sie bietet Einblick in Cloud-Anwendungen, Infrastruktur, Protokolle, Datenbanken, Netzwerke und Nutzungsdaten. Die Plattform geht auf die Komplexität der Verwaltung vielfältiger IT-Umgebungen ein und stellt Werkzeuge zur Verfügung, um Überwachungsprozesse zu optimieren, die Problemlösung zu verbessern und umsetzbare Einblicke zu liefern – ideal für Teams, die ihre IT-Abläufe optimieren und die Systemleistung steigern möchten.
Warum ich SolarWinds Observability SaaS ausgewählt habe
Ich habe SolarWinds Observability SaaS wegen seiner Fähigkeit gewählt, umfassende Transparenz durch vereinheitlichte Anwendungs- und Infrastrukturdaten bereitzustellen. Diese Funktion ist entscheidend, um das gesamte Spektrum der IT-Umgebungen zu verstehen und umfasst die Unterstützung von Open-Source-Frameworks sowie von Integrationen mit Drittanbietern. Außerdem können die AIOps-Fähigkeiten, verstärkt durch maschinelles Lernen, dazu beitragen, die Alarmmüdigkeit zu reduzieren, indem echte Probleme priorisiert werden – somit ist es ein wertvolles Werkzeug für Teams, die durch ständige Benachrichtigungen überfordert sind.
Wichtige Funktionen von SolarWinds Observability SaaS
Hier sind einige Funktionen, die für Sie nützlich sein könnten:
- Automatisierte Instrumentierung und Abhängigkeitszuordnung: Diese Funktion ermöglicht Ihrem Team die effiziente Überwachung und Zuordnung von Abhängigkeiten ohne manuellen Aufwand.
- Echtzeit-Anomalieerkennung und KI-gestützte Ursachenanalyse: Damit können Sie Probleme schnell identifizieren und beheben, noch bevor sie die Systemleistung beeinträchtigen.
- Schnelle Bereitstellung und benutzerfreundliche Oberfläche: Ihr Team kann mit einer intuitiven Oberfläche, die Einrichtung und Verwaltung vereinfacht, zügig einen Mehrwert realisieren.
- Unterstützung von Open-Source-Frameworks: Dies gewährleistet eine einfache Integration mit bestehenden Werkzeugen und sorgt für Flexibilität im IT-Infrastrukturmanagement.
SolarWinds Observability SaaS Integrationen
Zu den Integrationen gehören AWS, Azure, Google Cloud Platform, Kubernetes, ServiceNow, Slack, Microsoft Teams, Jira, Splunk und PagerDuty.
Pros and Cons
Pros:
- Effektiv für Fehlerbehebung und operative Einblicke
- Umfassende Datenarchivierung mit AWS S3-Unterstützung
- AIOps-Funktionen reduzieren Alarmmüdigkeit
Cons:
- Begrenzte Anpassungsmöglichkeiten für Dashboards und Berichte
- Hohe Lernkurve bei komplexen Konfigurationen
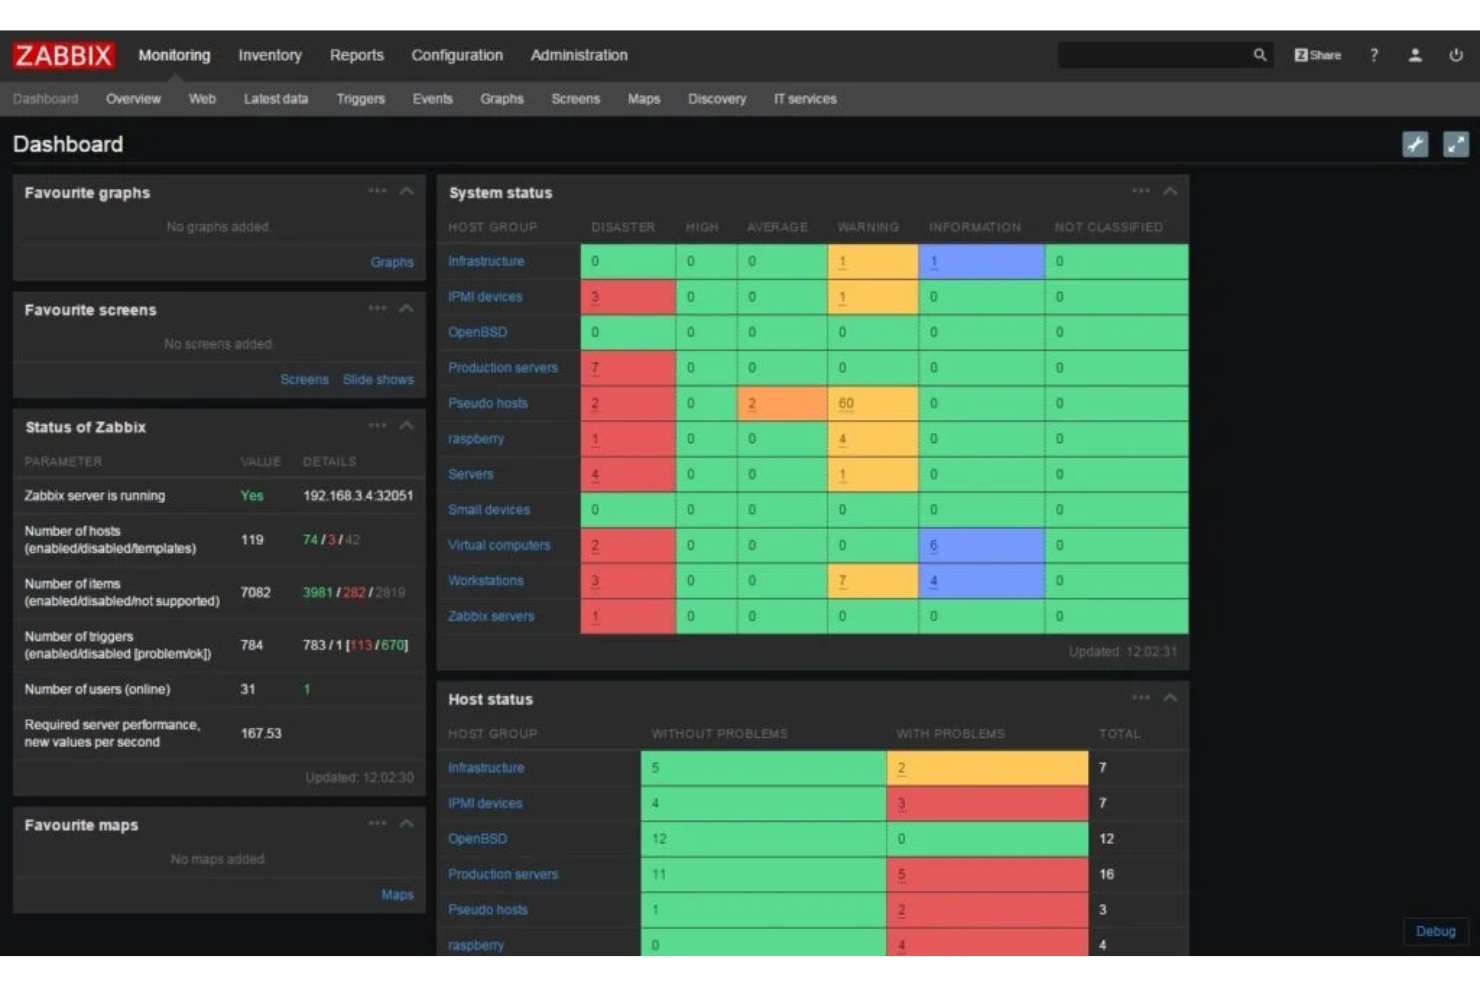
Zabbix Cloud Monitoring ist ein leistungsstarkes Tool, das eine Echtzeit-Überwachung von Servern, virtuellen Maschinen und Cloud-Diensten bietet. Bekannt für seinen Open-Source-Charakter, zeichnet es sich als die beste Lösung für Organisationen aus, die Wert auf Anpassbarkeit und Kostenersparnis legen.
Warum ich Zabbix Cloud Monitoring gewählt habe:
Ich habe Zabbix wegen seines Open-Source-Charakters gewählt, der vielfältige Anpassungsmöglichkeiten bietet, sowie wegen seines umfassenden Überwachungsumfangs, zu dem Server, virtuelle Maschinen und Cloud-Dienste gehören. Es überzeugt durch seine flexible Natur, die es ermöglicht, das System an spezifische Anforderungen anzupassen.
Deshalb erhält es das Prädikat 'Beste Lösung für' Open-Source-Cloud-Monitoring und richtet sich an alle, die Flexibilität und einen praxisorientierten Ansatz schätzen.
Herausragende Funktionen und Integrationen:
Zabbix glänzt bei der Netzwerkerkennung und bietet automatisierte Erkennung von Netzwerkgeräten und Konfigurationen. Es stellt umfangreiche Datenvisualisierungswerkzeuge bereit, mit denen Sie Überwachungsstatistiken auf einen Blick verstehen können. Als Open-Source-Tool lässt sich Zabbix mit einer Vielzahl anderer Systeme integrieren, darunter MySQL, PostgreSQL und IBM DB2.
Pros and Cons
Pros:
- Open-Source, bietet individuelle Anpassungen
- Breite Auswahl an Integrationen
- Umfassende Überwachungsfunktionen
Cons:
- Hohe Lernkurve für nicht-technische Nutzer
- Konfiguration kann komplex sein
- Kostenpflichtiger Support ist relativ teuer

Splunk Infrastructure Monitoring ist ein Tool, das Echtzeit-Transparenz und Analysen für Cloud-Infrastrukturen und Microservices bietet. Als Plattform, die für Geschwindigkeit und Effizienz bekannt ist, ist es die bevorzugte Wahl für Unternehmen, die sofortige Einblicke in ihre Cloud-Leistung benötigen.
Warum ich Splunk Infrastructure Monitoring gewählt habe:
Ich habe Splunk Infrastructure Monitoring wegen seiner starken Fähigkeit zur Bereitstellung von Einblicken in Echtzeit ausgewählt; dadurch hebt es sich besonders im Bereich Observability hervor.
Die vielfältigen Analysefunktionen haben mich überzeugt, dass es die beste Lösung für Echtzeit-Transparenz ist – besonders vorteilhaft für Unternehmen, die sofortige Aufschlüsse über ihre Cloud-Betriebe benötigen.
Herausragende Funktionen und Integrationen:
Splunk Infrastructure Monitoring verfügt über eine Echtzeit-Streaming-Architektur, die umgehend Einblicke bereitstellt. Es beinhaltet zudem Funktionen wie sofortige dynamische Basislinien-Erkennung und Anomalieerkennung, wodurch eine proaktive Problemerkennung möglich wird.
Zentrale Integrationen bestehen unter anderem mit AWS, Google Cloud und Azure, was eine nahtlose Überwachung von Multi-Cloud-Umgebungen ermöglicht.
Pros and Cons
Pros:
- Bietet Echtzeit-Transparenz
- Beinhaltet Funktionen zur proaktiven Problemerkennung
- Integriert sich gut mit führenden Cloud-Plattformen
Cons:
- Für kleine Unternehmen möglicherweise zu teuer
- Komplexe Benutzeroberfläche kann Einarbeitung erfordern
- Begrenzte Speicherung von historischen Daten

ThousandEyes ist ein umfassendes Tool, das tiefgehende Einblicke in Netzwerkrouten bietet. Es überzeugt durch die Kartierung von Netzwerkpfaden, das Aufdecken von Leistungsengpässen und die ständige Überwachung des Zustands aller Netzwerkverbindungen, wodurch es die beste Wahl für umfassende Transparenz in jedem Netzwerkpfad ist.
Warum ich ThousandEyes gewählt habe:
ThousandEyes hat es in meine Auswahl geschafft, weil es auf vollständige Netzwerktransparenz setzt. Es unterscheidet sich durch seinen Ansatz in der Überwachung, da es End-to-End-Einblicke in sämtliche Netzwerkelemente – nicht nur einzelne Komponenten – liefert.
Ich halte es für die 'beste Lösung für' vollständige Sichtbarkeit jedes Netzwerkpfades, weil es das gesamte Netzwerk lückenlos beleuchtet, potenzielle Probleme offenlegt und schnelle Lösungen ermöglicht.
Hervorstechende Funktionen und Integrationen:
ThousandEyes hebt sich durch Features wie Pfadvisualisierung hervor, die einen klaren Überblick über das gesamte Netzwerk bietet, sowie durch die Überwachung der Performance von ISPs, CDN, DNS und weiteren Diensten. Es lässt sich nahtlos mit verschiedenen Plattformen verbinden, etwa für den Datenaustausch mit Tools wie Slack, PagerDuty und ServiceNow, sowie mittels Import-/Exportfunktionen für weiterführende Analysen.
Pros and Cons
Pros:
- Bietet tiefgehende Einblicke in alle Netzwerkpfade
- Pfadvisualisierung für eine klare Netzwerkkartierung
- Umfangreiche und nützliche Integrationen
Cons:
- Die Benutzeroberfläche kann für Einsteiger etwas komplex sein
- Individuelles Preismodell passt eventuell nicht zu jedem Budget
- Es fehlen einige fortgeschrittene KI-basierte Funktionen zur Anomalieerkennung
Weitere Cloud-Infrastruktur-Monitoring-Tools
Nachfolgend finden Sie eine Liste zusätzlicher Cloud-Infrastruktur-Monitoring-Tools, die ich in meine Vorauswahl aufgenommen habe, die aber nicht den Sprung in die Top 10 geschafft haben.
- meshIQ
Am besten geeignet für Middleware-Monitoring und -Management
- Dynatrace
Am besten für KI-unterstütztes Monitoring
- Checkmk
Am besten geeignet für umfassende IT-Infrastrukturüberwachung
- Datadog
Am besten für vollständige Observierbarkeit
- Dotcom Monitor
Am besten geeignet für agentenbasierte & agentenlose Überwachung


Weitere Software-Empfehlungen
Falls Sie hier noch nicht fündig geworden sind, empfehlen wir Ihnen diese alternativen Tools, die wir getestet und bewertet haben.
- Netzwerk-Monitoring-Software
- Server-Monitoring-Software
- SD-Wan-Lösungen
- Infrastruktur-Monitoring-Tools
- Packet Sniffer
- Application-Monitoring-Tools
So bewerte ich Cloud-Infrastruktur-Überwachungstools
Bei der Bewertung dieser Tools denke ich in zwei Ebenen – grundlegende Anforderungen und die Unterscheidungsmerkmale, die gute von großartigen Anbietern abheben.
Kernfunktionen (Grundvoraussetzung für diese Liste)
Diese Kernfunktionen dienen als Akzeptanzkriterien für die Aufnahme in meine Liste:
- Multi-Cloud-Ressourcenüberwachung: Ich prüfe, ob ein Tool über native Integrationen für AWS, Azure und GCP verfügt und wie viele Dienste pro Anbieter ab Werk abgedeckt werden.
- Echtzeit-Metriken & Dashboards: Die Granularität ist hier entscheidend. Ich achte auf Polling unter einer Minute und anpassbare Dashboards, die Teams für bestimmte Cluster oder Regionen individualisieren können.
- Alarmierung & Anomalie-Erkennung: Ich bewerte, wie Alarme konfiguriert werden, welche Benachrichtigungskanäle unterstützt werden und ob das Tool dynamische Schwellenwerte über statische Regeln hinaus bietet.
- Log- & Ereigniskorrelation: Die Verbindung eines CPU-Spikes mit einer fehlgeschlagenen Bereitstellung ist der eigentliche Test. Ich suche nach einheitlichen Ansichten, die Logs und Ereignisse mit Metrik-Zeitachsen verknüpfen.
- Container- & Orchestrierungs-Transparenz: Ich achte auf Metriken auf Cluster-, Knoten-, Pod- und Workload-Ebene über verschiedene Orchestrierungsplattformen hinweg.
- Auto-Discovery & Topologie-Mapping: Neue Instanzen werden ständig erzeugt – ich bewerte, ob das Tool diese automatisch erkennt und Abhängigkeiten ohne manuelle Eingabe abbildet.
Ich bewerte jeden Anbieter auf einer Skala von 0 (bietet die Funktionalität nicht) bis 5 (hervorragend in diesem Bereich) für jedes Kriterium.
Die Anbieter müssen einen bestimmten durchschnittlichen Mindestwert erfüllen, um auf meiner Liste berücksichtigt zu werden. Anschließend betrachte ich, was jede Plattform besonders macht.
Unterscheidungsmerkmale (Was Anbieter voneinander abhebt)
Nachdem ich meine Liste zusammengestellt habe, vergleiche ich die verschiedenen Anbieter in diesem Bereich folgendermaßen:
Herausragende Funktionen
Ich suche nach KI-gestützter Root Cause Analysis, die Teams hilft, während der Störungsbehebung das Wesentliche zu erkennen, indem sie handlungsrelevante Alarme priorisiert. Tools mit ausgeprägter Kosten-Transparenz ermöglichen es DevOps und SREs, Infrastrukturperformance mit Cloud-Ausgaben zu verknüpfen – ein entscheidender Aspekt für Unternehmen mit Fokus auf FinOps. Verteiltes Tracing und End-to-End-APM sind besonders wertvoll, wenn tiefgehende Infrastruktur-Daten mit Anwendungserlebnissen verbunden werden sollen – ideal für schnelle Fehlerbehebung in Microservices-Umgebungen.
Mehr als nur Funktionen
Preistransparenz ist ein entscheidendes Unterscheidungsmerkmal in diesem Bereich. Ich prüfe, ob Anbieter nach Hosts, Datenvolumen oder benutzerdefinierten Metriken abrechnen – und wie vorhersehbar die Kosten bei zunehmendem Umfang bleiben. Auch die Breite des Integrations-Ökosystems ist wichtig: Ich prüfe, ob OpenTelemetry unterstützt wird und native Anbindungen an ITSM- und CI/CD-Tools wie ServiceNow und Jenkins bestehen, da Monitoring selten isoliert läuft. Für regulierte Branchen betrachte ich Zertifizierungen wie SOC 2 Typ II, HIPAA und FedRAMP sowie RBAC- und Audit-Logging-Funktionen.
So wählen Sie Cloud-Infrastruktur-Monitoring-Tools aus
Es ist leicht, sich in langen Funktionslisten und komplexen Preisstrukturen zu verlieren. Damit Sie beim Auswahlprozess Ihrer Software fokussiert bleiben, finden Sie hier eine Checkliste mit wichtigen Kriterien, die Sie im Hinterkopf behalten sollten:
| Faktor | Worauf zu achten ist |
|---|---|
| Skalierbarkeit | Stellen Sie sicher, dass das Tool wachsenden Infrastruktur-Anforderungen gewachsen ist. Ihre Monitoring-Lösung sollte gemeinsam mit Ihrer Cloud-Umgebung skalieren und neue Instanzen sowie Services ohne Performance-Probleme integrieren können. |
| Integrationen | Suchen Sie nach einem Tool, das sich mit Ihren bestehenden Cloud-Anbietern (AWS, Azure, GCP) und Drittanbieterdiensten (z. B. Slack, Jira) verknüpfen lässt. Damit können Monitoring-Daten zentralisiert und Benachrichtigungen automatisiert werden. |
| Anpassbarkeit | Wählen Sie eine Lösung, mit der Sie benutzerdefinierte Dashboards, Berichte und Alarme entsprechend den speziellen Anforderungen und Workflows Ihres Teams erstellen können. Flexibilität bei der Datenvisualisierung ist hierbei entscheidend. |
| Benutzerfreundlichkeit | Eine leicht verständliche Oberfläche verringert die Einarbeitungszeit und beschleunigt die Problemlösung. Achten Sie darauf, dass das Tool für Entwickler sowie Nicht-Techniker intuitiv bedienbar ist. |
| Budget | Überprüfen Sie die Preisstruktur auf versteckte Kosten wie Datenaufbewahrung, Premium-Support oder zusätzliche Integrationen. Vergleichen Sie verschiedene Preismodelle, um Überzahlungen zu vermeiden. |
| Sicherheitsmaßnahmen | Stellen Sie sicher, dass das Tool Verschlüsselung, rollenbasierte Zugriffskontrolle und sichere API-Verbindungen bietet, um sensible Infrastrukturdaten zu schützen. Die Einhaltung von Branchenstandards (z. B. SOC 2) ist ein Pluspunkt. |
| Automatisierung | Suchen Sie nach Automatisierungsfunktionen wie Anomalie-Erkennung, automatische Fehlerbehebung und Performance-Optimierung, um manuelle Arbeit zu reduzieren und die Effizienz zu steigern. |
| Echtzeit-Benachrichtigungen | Stellen Sie sicher, dass das Tool Echtzeit-Alarme und Benachrichtigungen über verschiedene Kanäle (E-Mail, Slack etc.) bietet, damit Sie auf Probleme schnell reagieren können. |
Trends bei Cloud-Infrastruktur-Monitoring-Tools
Für meine Recherche habe ich zahlreiche Produktaktualisierungen, Pressemitteilungen und Release-Logs verschiedener Anbieter von Cloud-Infrastruktur-Monitoring-Tools ausgewertet. Hier sind einige aufkommende Trends, die ich beobachte:
- KI-gesteuerte Erkenntnisse: Immer mehr Tools setzen künstliche Intelligenz und maschinelles Lernen ein, um Ausfälle vorherzusagen, Anomalien zu erkennen und Lösungen vorzuschlagen, bevor Probleme eskalieren. Das hilft Teams, proaktiv und nicht nur reaktiv zu handeln.
- Detailliertes Kosten-Tracking: Monitoring-Tools liefern inzwischen tiefere Einblicke in die Cloud-Ausgaben, wodurch Teams Verschwendung identifizieren und Ressourcen besser zuweisen können. Einige Tools bieten sogar automatisierte Kosteneinsparungsvorschläge.
- Vereinheitlichte Observability: Anbieter kombinieren Infrastruktur-, Anwendungs- und Netzwerk-Monitoring in einer einzigen Plattform. Das verschafft Teams einen vollständigen Überblick über ihre Umgebung, ohne ständig zwischen Tools wechseln zu müssen.
- Edge-Monitoring: Da immer mehr Workloads am Rand (Edge) laufen, werden Tools erweitert, um Edge-Geräte und Microservices zu überwachen. So kann die Leistung und Verfügbarkeit in verteilten Umgebungen sichergestellt werden.
- Verbessertes Sicherheitsmonitoring: Tools bieten immer mehr Funktionen für Echtzeit-Bedrohungserkennung und Sicherheitsprotokollierung. Manche Tools ermöglichen inzwischen auch Integrationen mit SIEM-Plattformen (Security Information and Event Management) für eine schnellere Reaktion auf Sicherheitsvorfälle.
Was sind Cloud-Infrastruktur-Monitoring-Tools?
Cloud-Infrastruktur-Monitoring-Tools bieten eine automatisierte Möglichkeit, die Betriebsprozesse innerhalb einer Cloud-basierten IT-Infrastruktur zu überwachen. Sie werden hauptsächlich von IT-Fachkräften, Netzwerkingenieuren und Systemadministratoren genutzt und sind unverzichtbar zur Überwachung von Status, Leistung und Gesundheit von Servern, Datenbanken, Netzwerken und Anwendungsdiensten, die sich in der Cloud befinden.
Sie erfüllen eine entscheidende Funktion, indem sie Probleme schnell erkennen, potenziellen Ausfällen vorbeugen und für einen reibungslosen Geschäftsbetrieb sorgen. Diese Tools liefern Einblicke und Analysen, die bei der Ressourcenoptimierung helfen und somit eine wichtige Rolle bei strategischen Entscheidungen sowie der Steigerung der Systemleistung spielen.
Funktionen von Cloud-Infrastruktur-Monitoring-Tools
Beim Auswählen von Cloud-Infrastruktur-Monitoring-Tools sollten Sie besonders auf folgende wichtige Funktionen achten:
- Echtzeitüberwachung: Bietet sofortige Sichtbarkeit der Infrastrukturleistung, sodass Probleme schnell erkannt und gelöst werden können.
- Individuelle Dashboards: Ermöglicht die Erstellung personalisierter Ansichten wichtiger Kennzahlen, damit Ihr Team die relevanten Werte leichter verfolgen kann.
- Anomalieerkennung: Nutzt maschinelles Lernen und Protokollüberwachungssoftware, um ungewöhnliche Muster zu identifizieren und potenzielle Probleme zu erkennen, bevor sie die Leistung beeinträchtigen.
- Warnungen und Benachrichtigungen: Sendet Warnmeldungen über mehrere Kanäle (E-Mail, Slack usw.), um Ihr Team in Echtzeit über Probleme zu informieren.
- Protokollaggregation: Sammelt und organisiert Protokolle aus verschiedenen Systemen, was die Fehlersuche und Ursachenanalyse erleichtert.
- Kostenerfassung: Analysiert die Cloud-Ausgaben nach Dienst, Region oder Projekt, um Verschwendung zu erkennen und Kosten zu optimieren.
- Rollenbasierte Zugriffskontrolle: Ermöglicht die Definition von Benutzerrechten, sodass Teammitglieder nur auf die Daten zugreifen, die sie benötigen.
- Analyse historischer Daten: Speichert Leistungsdaten aus der Vergangenheit, wodurch Trends erkannt und fundierte Entscheidungen getroffen werden können.
- Multi-Cloud-Lösungen: Überwacht Infrastrukturen verschiedener Cloud-Anbieter wie AWS, Azure und Google Cloud auf einer einzigen Plattform.
- APIs und Integrationen: Verbindet sich mit anderen Tools und Plattformen, um Arbeitsabläufe zu automatisieren und Daten zu zentralisieren.
Vorteile von Cloud-Infrastrukturüberwachungstools
Die Implementierung von Cloud-Infrastrukturüberwachungstools bringt mehrere Vorteile für Ihr Team und Ihr Unternehmen. Hier sind einige, auf die Sie sich freuen können:
- Verbesserte Verfügbarkeit: Überwachungstools helfen, Leistungsprobleme frühzeitig zu erkennen, was Ausfallzeiten reduziert und Dienste für Nutzer verfügbar hält.
- Schnellere Problemlösung: Echtzeitbenachrichtigungen und detaillierte Protokolle erleichtern es Ihrem Team, Probleme schnell zu identifizieren und zu beheben.
- Bessere Kostenkontrolle: Funktionen zur Kostenerfassung und Ressourcenoptimierung helfen dabei, Überbereitstellung zu vermeiden und Verschwendung zu verringern.
- Erhöhte Sicherheit: Integrierte Bedrohungserkennung und Sicherheitsprotokollierung ermöglichen es, Schwachstellen zu erkennen und schneller auf Angriffe zu reagieren.
- Fundiertere Entscheidungen: Historische Daten und Trendanalysen liefern Einblicke in Leistungsentwicklungen und Ressourcenbedarf.
- Vereinfachtes Multi-Cloud-Management: Einheitliche Dashboards und Multi-Cloud-Unterstützung ermöglichen die Überwachung verschiedener Cloud-Umgebungen von einem Ort aus.
- Bessere Teamzusammenarbeit: Rollenbasierter Zugriff und gemeinsame Dashboards stellen sicher, dass alle Teammitglieder die benötigten Daten für Entscheidungen erhalten.
Kosten und Preise von Cloud-Infrastrukturüberwachungstools
Die Auswahl von Cloud-Infrastrukturüberwachungstools erfordert ein Verständnis der verschiedenen verfügbaren Preismodelle und Pläne. Die Kosten variieren je nach Funktionen, Teamgröße, Zusatzoptionen und mehr. Die folgende Tabelle fasst gängige Pläne, deren Durchschnittspreise und typische Funktionen von Cloud-Infrastrukturüberwachungstools zusammen:
Vergleichstabelle für Cloud-Infrastrukturüberwachungstools
| Plan-Typ | Durchschnittlicher Preis | Typische Funktionen |
|---|---|---|
| Gratis-Plan | $0 | Grundlegende Leistungsüberwachungstools, begrenzte Warnungen, Community-Support und Integration in eine einzelne Cloud. |
| Personal-Plan | $10–$30/user/month | Leistungsüberwachung, Echtzeitbenachrichtigungen, grundlegende Protokollanalyse und Einzelbenutzerzugang. |
| Business-Plan | $40–$100/user/month | Multi-Cloud-Unterstützung, erweiterte Anomalieerkennung, individuelle Dashboards und teambasierte Berechtigungen. |
| Enterprise-Plan | $150–$500/user/month | KI-gestützte Erkenntnisse, automatisierte Problemlösung, Sicherheitsüberwachung, dedizierter Accountmanager und Compliance-Überwachung. |
Cloud-Infrastruktur-Überwachungstools – Häufig gestellte Fragen
Hier finden Sie Antworten auf häufig gestellte Fragen zu Tools zur Überwachung der Cloud-Infrastruktur:
Wie überwachen diese Tools Multi-Cloud-Umgebungen?
Viele Überwachungstools für Cloud-Infrastrukturen unterstützen Multi-Cloud-Umgebungen. Dadurch können Sie Ressourcen verschiedener Cloud-Anbieter wie AWS, Azure und Google Cloud über eine einzige Plattform überwachen. Dieser einheitliche Ansatz ermöglicht es Ihrem Team, den Überblick zu behalten und vereinfacht das Management.
Können diese Tools in bestehende DevOps-Workflows integriert werden?
Ja, die meisten Überwachungstools bieten Integrationen mit beliebten DevOps-Überwachungstools wie Jenkins, GitHub und Slack. Diese Integrationen ermöglichen es Ihrem Team, Überwachungsdaten in die bestehenden Arbeitsabläufe einzubinden, die Zusammenarbeit zu stärken und Prozesse effizienter zu gestalten.
Wie helfen diese Tools dabei, Cloud-Kosten zu optimieren?
Viele Überwachungstools bieten Funktionen, mit denen die Ressourcennutzung überwacht und nicht ausgelastete Ressourcen erkannt werden. Durch die Analyse dieser Daten können Sie fundierte Entscheidungen zur Optimierung Ihrer Cloud-Ausgaben treffen und Ressourcen effizienter zuweisen.
Welche Sicherheitsfunktionen sind in diesen Tools üblicherweise enthalten?
Sicherheitsfunktionen umfassen häufig die Erkennung von Bedrohungen in Echtzeit, Schwachstellenanalysen und die Überwachung der Compliance. Mit diesen Möglichkeiten kann Ihr Team potenzielle Sicherheitsprobleme schnell erkennen und beheben, was die Integrität Ihrer Infrastruktur bewahrt.
Wie individuell anpassbar sind Dashboards und Berichte in diesen Tools?
Die meisten Tools bieten individuell anpassbare Dashboards und Berichte, sodass Sie die Anzeige von Kennzahlen und Analysen auf die speziellen Anforderungen Ihres Teams zuschneiden können. Diese Flexibilität stellt sicher, dass Sie sich auf die für Ihren Betrieb wichtigsten Daten konzentrieren können.
Unterstützen diese Tools automatisierte Reaktionen auf festgestellte Probleme?
Ja, viele Überwachungstools bieten Automatisierungsfunktionen, die im Falle bestimmter Warnmeldungen oder Unregelmäßigkeiten vordefinierte Aktionen auslösen können. Diese Automatisierung hilft Ihrem Team, Probleme zeitnah zu beheben, Ausfallzeiten zu verringern und die Systemzuverlässigkeit zu verbessern.
Wie geht es weiter?
Wenn Sie gerade nach Tools zur Überwachung Ihrer Cloud-Infrastruktur suchen, vereinbaren Sie ein kostenloses Beratungsgespräch mit einem SoftwareSelect-Experten für passende Empfehlungen.
Sie füllen ein Formular aus und führen ein kurzes Gespräch, in dem die Berater auf Ihre spezifischen Anforderungen eingehen. Anschließend erhalten Sie eine Auswahl an Softwarelösungen zur Prüfung. Die Experten begleiten Sie zudem durch den gesamten Beschaffungsprozess – inklusive Preisverhandlungen.