Datadog vs. LogicMonitor: Comparison and Expert Reviews for 2026


Choosing between Datadog and LogicMonitor for your next cloud monitoring tool means weighing Datadog’s deep analytics and integrations against LogicMonitor’s unified infrastructure visibility, two cloud monitoring tools built for teams who can’t afford blind spots or downtime. If you’re struggling to decide which platform will help you catch issues faster, automate more, and keep your systems humming, you’re not alone.
This guide breaks down how each tool handles monitoring, alerting, and scaling, so you can confidently pick the right fit for your environment and business goals.
Datadog vs. LogicMonitor: An Overview
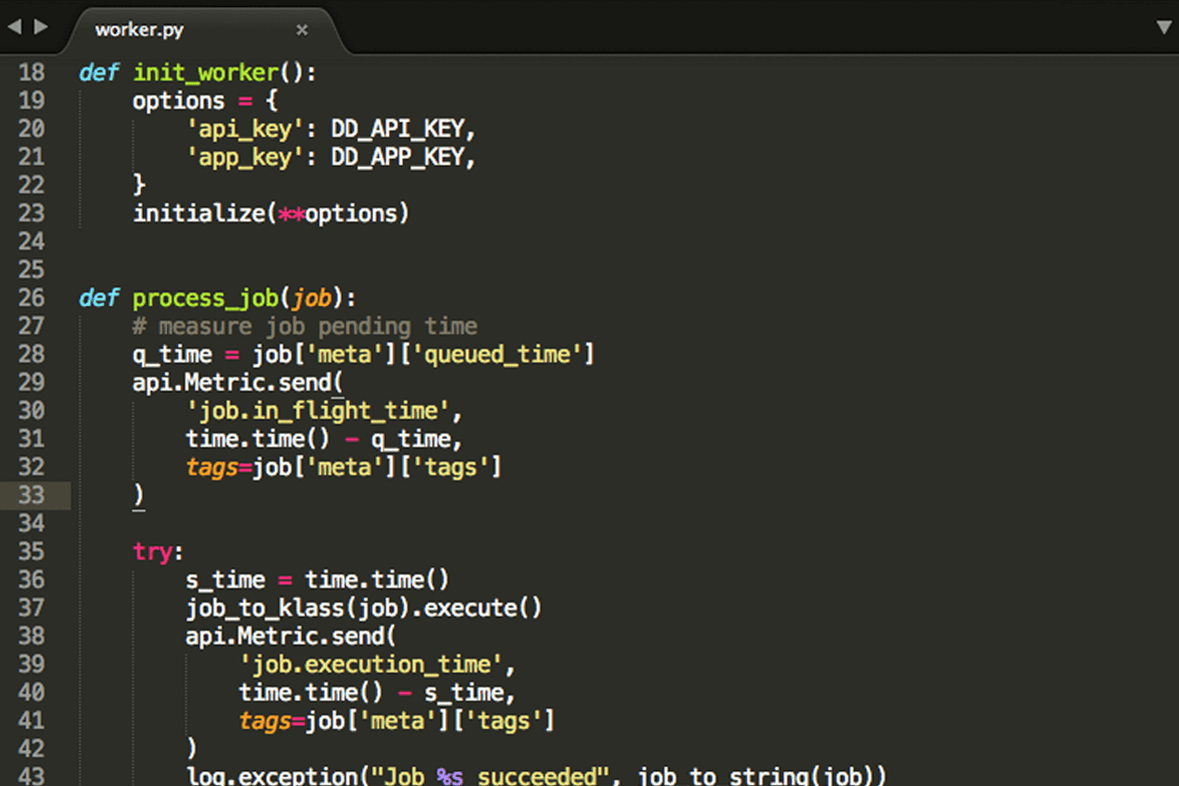
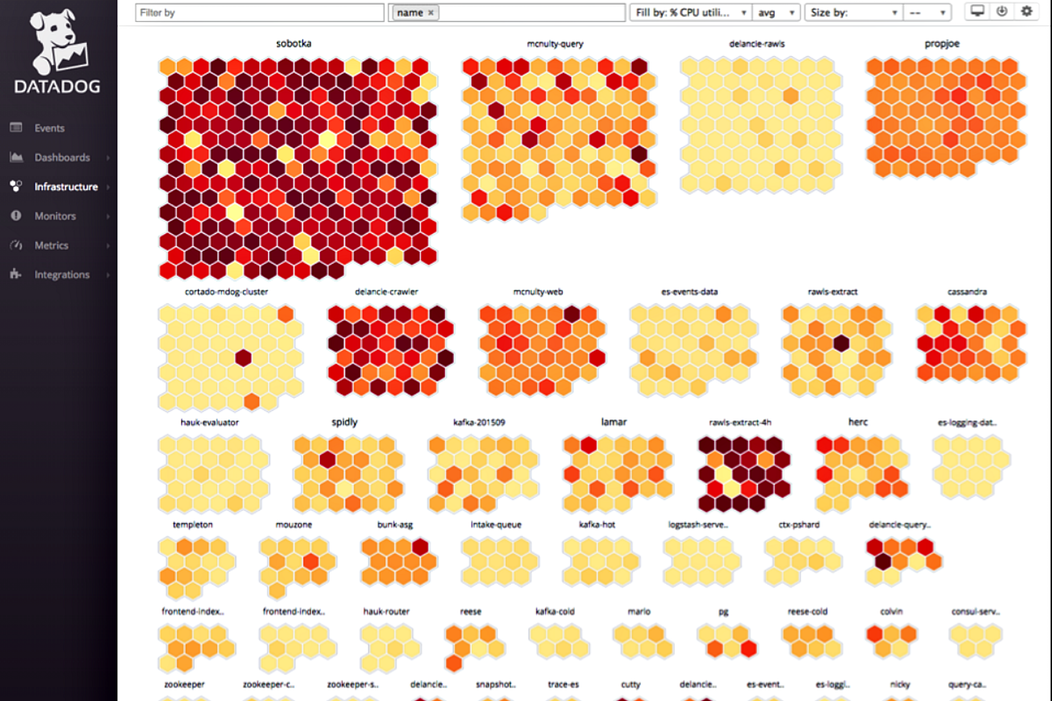
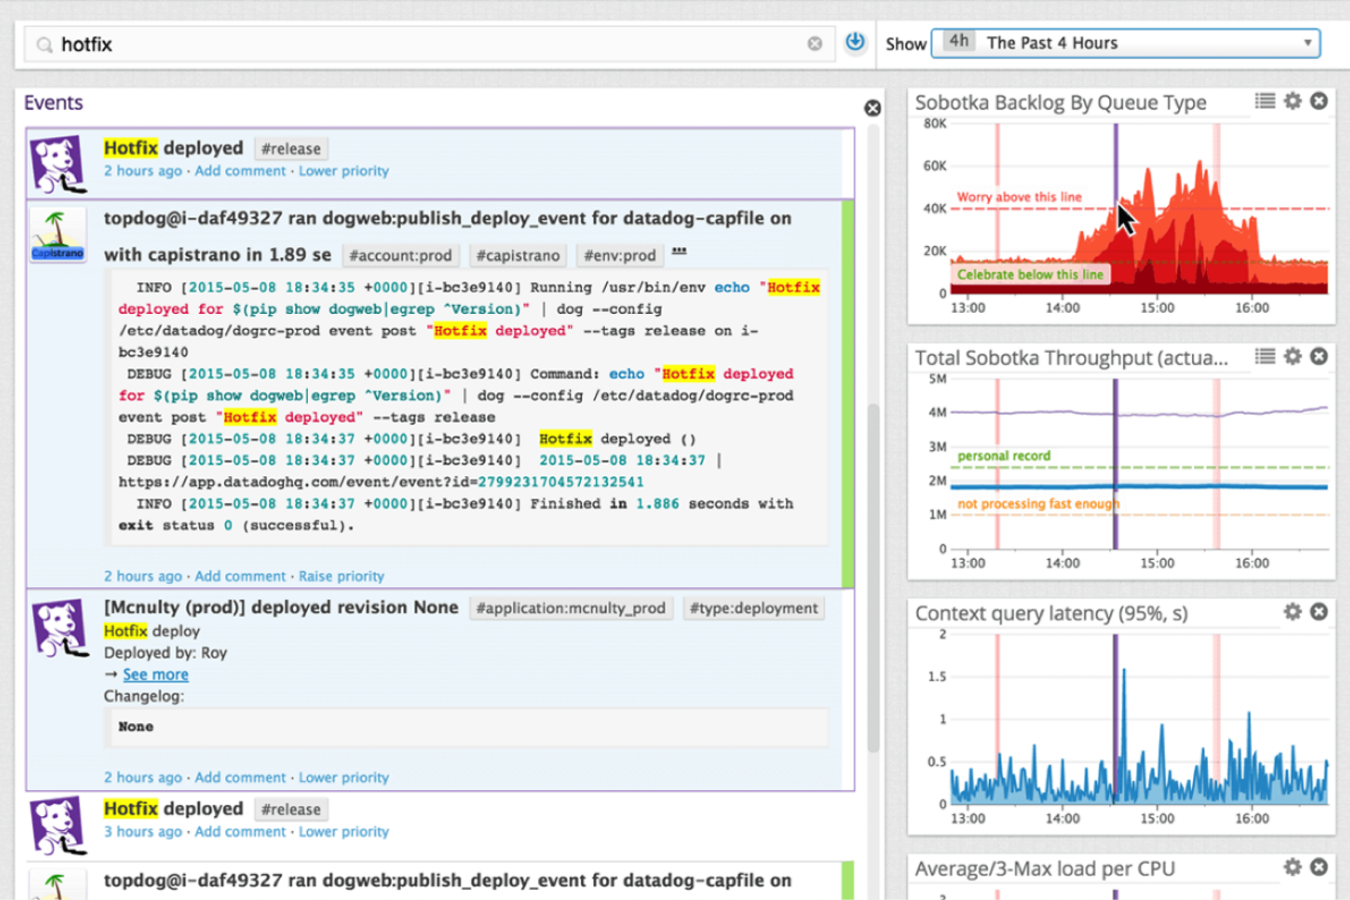
Datadog
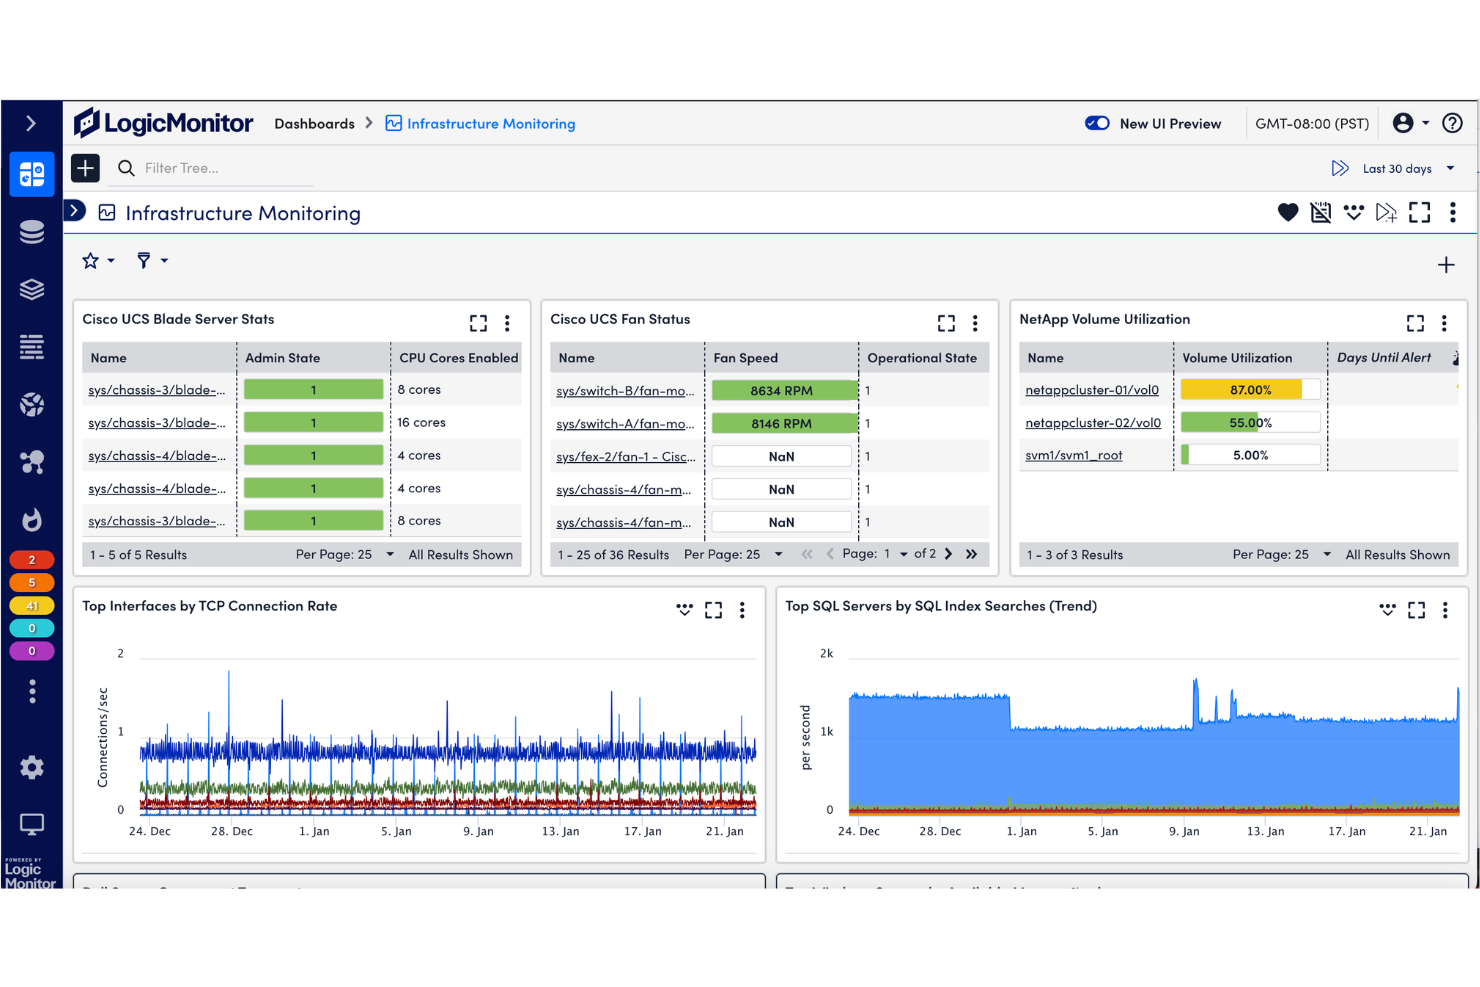
LogicMonitor
Why Trust Our Software Reviews
We’ve been testing and reviewing software since 2023. As tech leaders ourselves, we know how critical and difficult it is to make the right decision when selecting software.
We invest in deep research to help our audience make better software purchasing decisions. We’ve tested more than 2,000 tools for different tech use cases and written over 1,000 comprehensive software reviews. Learn how we stay transparent & our software review methodology.
Datadog vs. LogicMonitor Pricing Comparison
| Datadog | LogicMonitor | |
|---|---|---|
| Free Trial | Free demo + 14-day free trial available | Free 15-day trial |
| Pricing | From $15/host/month (billed annually) | From $16/hybrid unit/month |
Datadog vs. LogicMonitor Pricing & Hidden Costs
Datadog uses a modular pricing model, where you pay separately for each product or capability you add, such as infrastructure monitoring, APM, and log management. While entry-level pricing can start low (for example, per-host pricing for infrastructure), costs can scale quickly as you enable more features, increase data volumes, or exceed included usage limits like custom metrics and containers.
LogicMonitor, by contrast, offers tiered platform packages priced per “hybrid unit,” with most core observability features bundled into each plan. This makes pricing more predictable, though add-ons like AI capabilities or advanced modules can still increase your total cost.
To choose the right vendor, map out your current and future monitoring requirements in detail. List the features and integrations you’ll need now and in the next year, then ask each vendor for a transparent quote based on your real-world usage. Don’t forget to factor in scalability, including variables like host counts, data ingestion, and add-ons, as well as any onboarding, training, or support costs that could impact your total investment over time.
Datadog vs. LogicMonitor Feature Comparison
Datadog and LogicMonitor overlap heavily in core monitoring solution capabilities. Both are SaaS-based platforms that provide full-stack visibility for IT infrastructure, application cloud environment, and network monitoring, with features like metrics collection, log management, dashboards, alerting, and integrations to unify monitoring in one place. They’re designed to help teams detect issues, analyze performance, and maintain system reliability across complex, hybrid environments.
Where they diverge is in how they approach that observability. Datadog stands out for its deep, developer-centric tooling—especially advanced APM, distributed tracing, and real-time analytics across highly dynamic, cloud-native systems. LogicMonitor, on the other hand, differentiates with its unified platform approach and strong automation functionality, including agentless monitoring and AI-driven features like predictive insights and automated anomaly detection that reduce manual effort.
| Datadog | LogicMonitor | |
|---|---|---|
| API | ||
| Bug Tracking | ||
| Data Export | ||
| Data Import | ||
| External Integrations | ||
| Malware Protection | ||
| Multi-User | ||
| Notifications |
Datadog vs. LogicMonitor Integrations
| Integration | Datadog | LogicMonitor |
| AWS | ✅ | ✅ |
| Microsoft Azure | ✅ | ✅ |
| Google Cloud | ✅ | ✅ |
| Kubernetes | ✅ | ✅ |
| Slack | ✅ | ✅ |
| ServiceNow | ✅ | ✅ |
| PagerDuty | ✅ | ✅ |
| Salesforce | ✅ | ❌ |
| VMware vSphere | ✅ | ✅ |
| Cisco Meraki | ❌ | ✅ |
| API | ✅ | ✅ |
| Zapier | ✅ | ❌ |
Both Datadog and LogicMonitor cover the major cloud, infrastructure, and incident management integrations, but Datadog stands out with broader SaaS and automation options like Salesforce and Zapier. If you rely on niche or SaaS integrations, Datadog’s wider marketplace may give you more flexibility, while LogicMonitor’s strengths lie in deep infrastructure and network device coverage.
Datadog vs. LogicMonitor Security, Compliance & Reliability
| Factor | Datadog | LogicMonitor |
| Data Encryption | Encrypts data in transit and at rest using industry standards. | Uses TLS for data in transit and AES-256 for data at rest. |
| Regulatory Compliance | Offers SOC 2 Type II, GDPR, HIPAA, and ISO 27001 certifications. | Provides SOC 2 Type II, GDPR, and ISO 27001 compliance. |
| Access Controls | Supports SSO, RBAC, and granular API key management. | Includes SSO, RBAC, and detailed user permission settings. |
| Uptime & Redundancy | Guarantees high availability with multi-region redundancy and SLAs. | Delivers high uptime with global data centers and built-in failover. |
| Audit Logging | Provides detailed audit trails for all user and system activity. | Maintains comprehensive audit logs for user actions and system events. |
Both Datadog and LogicMonitor deliver strong security and compliance, but Datadog’s broader certification coverage and detailed audit trails give it an edge for regulated industries. LogicMonitor shines with its straightforward controls and reliable uptime, making it a solid choice for teams prioritizing operational stability.
Datadog vs. LogicMonitor Ease of Use
| Factor | Datadog | LogicMonitor |
| User Interface | Offers customizable dashboards with a modern, data-rich layout. | Features a clean, intuitive interface focused on quick navigation. |
| Onboarding | Provides guided setup, but can feel overwhelming due to feature depth. | Streamlined onboarding with automated device discovery and setup. |
| Setup Complexity | Requires manual configuration for advanced integrations and alerts. | Automates most setup tasks, reducing manual effort for new users. |
| Documentation | Extensive documentation and tutorials, though some areas are dense. | Clear, concise guides and in-app tips for common tasks. |
| Support | 24/7 support with live chat and a large user community. | Responsive support team and proactive onboarding assistance. |
LogicMonitor is easier to get up and running, while Datadog’s flexibility comes with a steeper learning curve. Datadog excels for teams who want deep customization and analytics, while LogicMonitor is ideal if you want fast setup and a straightforward user experience.
Datadog vs LogicMonitor: Pros & Cons
Datadog
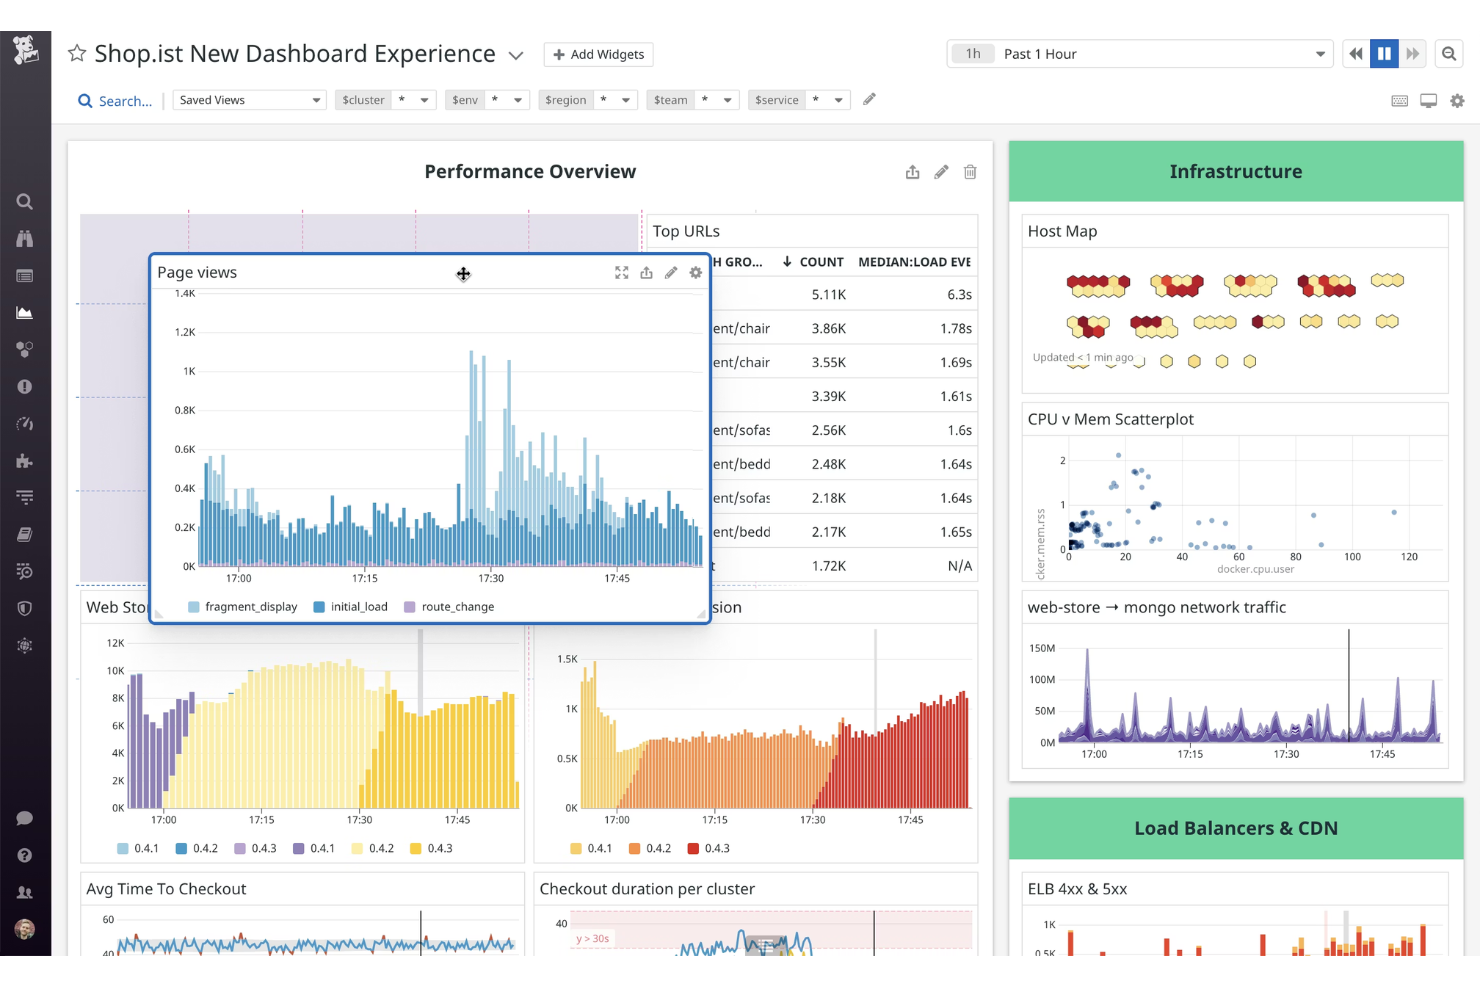
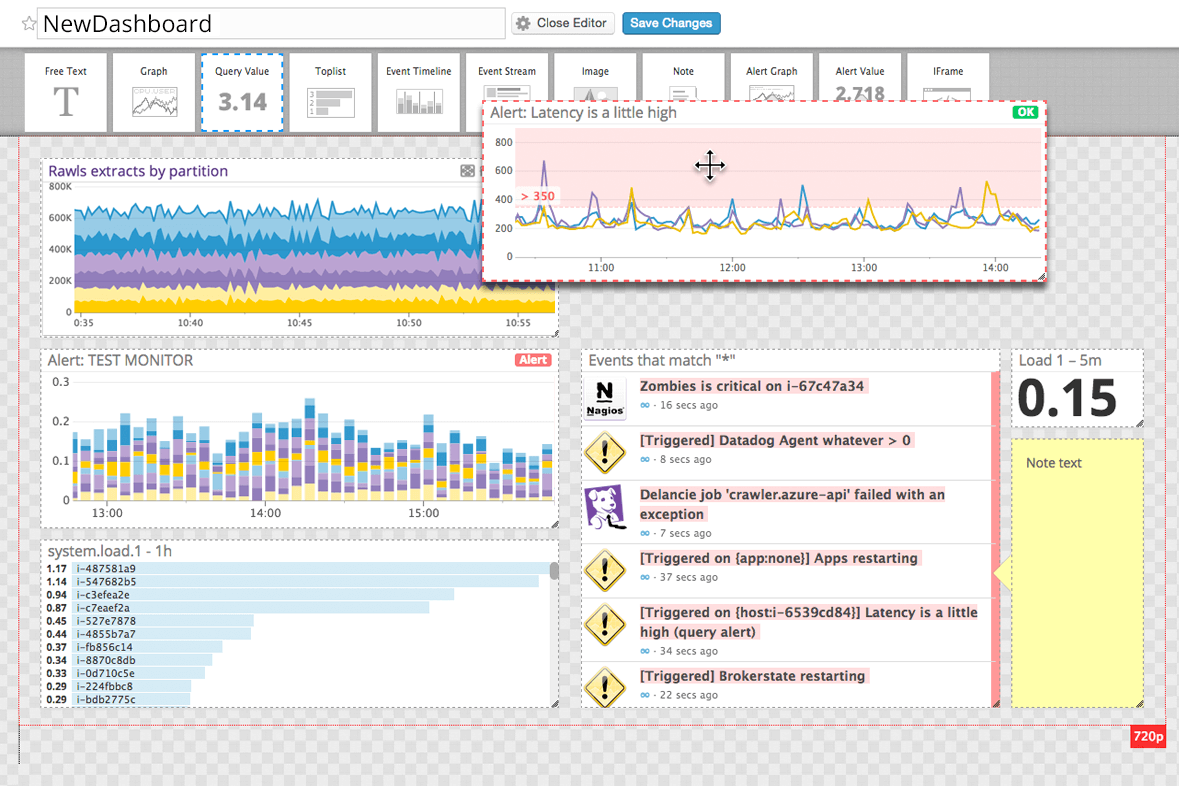
- Highly customizable dashboards for visualizing key metrics
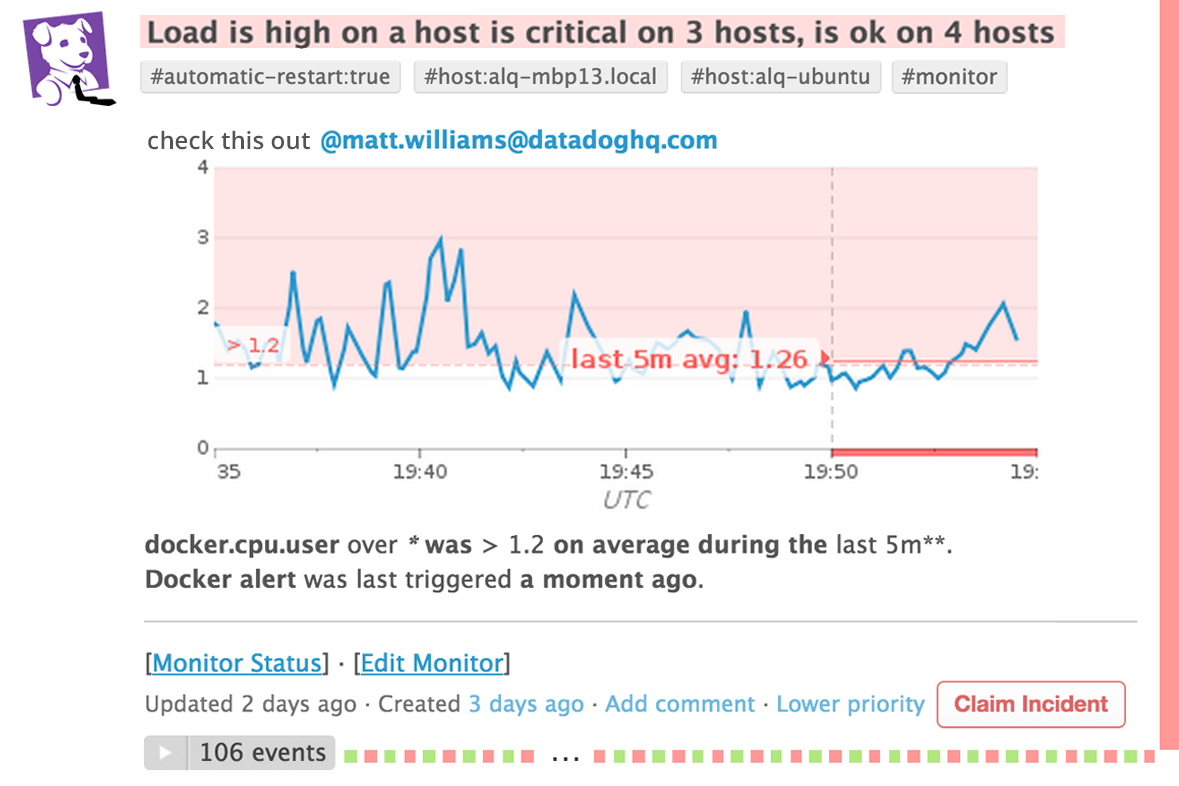
- Advanced alerting and anomaly detection features
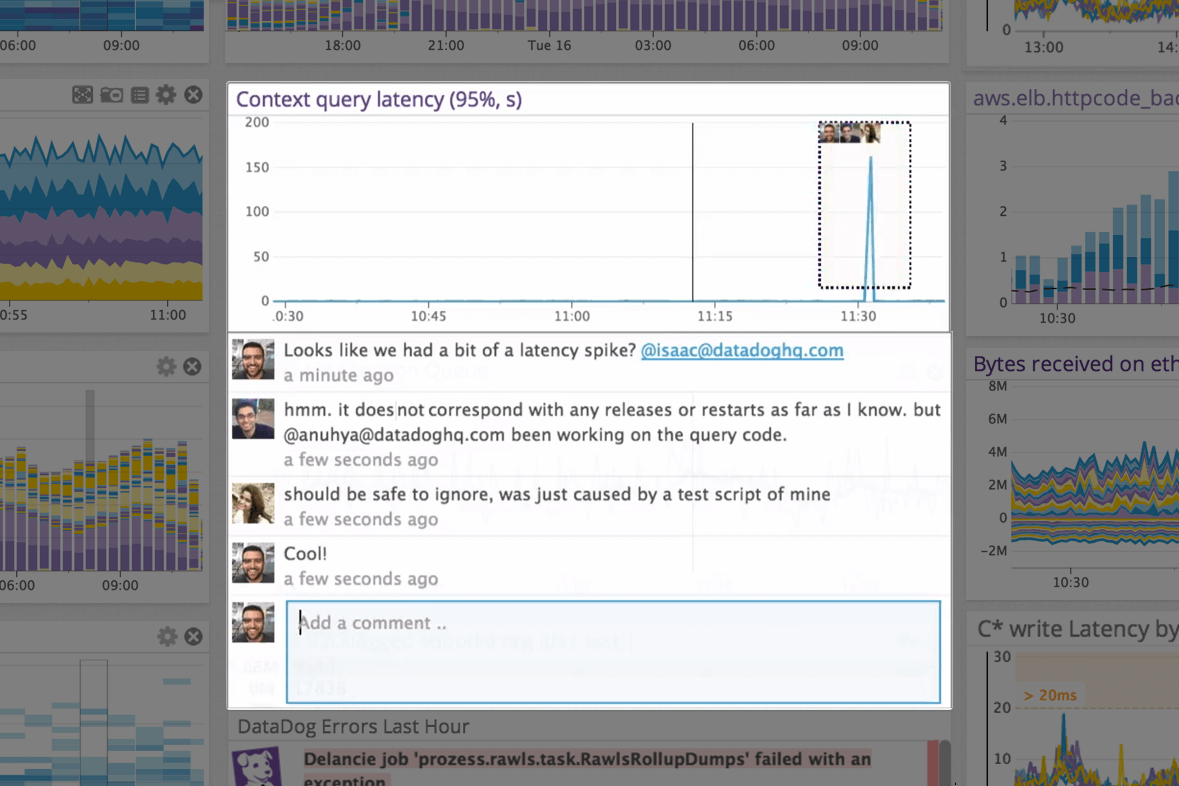
- Real-time monitoring across infrastructure, applications, and logs
- Setup complexity grows in large or hybrid environments
- Data retention limits can restrict historical analysis
- Pricing increases quickly with data volume and features
LogicMonitor
- Automated device discovery speeds up initial setup.
- AI-driven alert noise reduction improves incident response.
- Unified dashboards provide clear hybrid and multi-cloud visibility.
- Pricing can be high for smaller organizations.
- Advanced configuration requires technical expertise.
- Occasional delays in customer support response.
Best Use Cases for Datadog and LogicMonitor
Datadog
- Hybrid IT Departments Unified dashboards simplify monitoring across on-premises and cloud resources.
- Ecommerce Platforms Transaction tracing and anomaly detection support high-traffic reliability.
- SaaS Providers End-to-end application monitoring ensures uptime and user experience.
- DevOps Teams Automated alerting and integrations streamline incident response and troubleshooting.
- Large Enterprises Centralized observability and advanced analytics help manage sprawling infrastructure.
- Cloud-Native Startups Datadog’s real-time monitoring and automation support rapid scaling and deployment.
LogicMonitor
- Large Enterprises LogicMonitor handles thousands of devices and complex, multi-site environments with ease.
- Managed Service Providers Multi-tenant support and automated onboarding streamline client infrastructure monitoring.
- Financial Services Granular monitoring and compliance reporting support strict regulatory requirements.
- Healthcare IT Unified dashboards and alerting help maintain uptime for critical systems.
- DevOps Teams API access and automation features fit continuous deployment workflows.
- Data Center Operations Dynamic topology mapping and capacity planning tools aid infrastructure management.
Who Should Use Datadog, And Who Should Use LogicMonitor?
Datadog is best suited for cloud-native teams, DevOps engineers, and organizations building and scaling modern applications. Its strength lies in deep application performance monitoring, distributed tracing, and tight integrations with cloud platforms and developer workflows. If your team needs granular visibility into microservices and real-time data across dynamic environments, Datadog is typically the better fit.
LogicMonitor is a strong choice for IT operations teams managing hybrid infrastructure across on-prem, cloud, and network environments. It’s designed for ease of deployment and ongoing management, with agentless monitoring and built-in automation that reduce operational overhead. Organizations that prioritize centralized visibility, predictable pricing, and lower maintenance complexity will often find LogicMonitor more practical.
Differences Between Datadog and LogicMonitor
| Datadog | LogicMonitor | |
|---|---|---|
| Automation & AI | Advanced analytics, anomaly detection, and workflow automation (e.g., Watchdog, Bits AI). | Strong automation in discovery, alert tuning, and AI-driven insights (e.g., Edwin AI), with less emphasis on custom workflows. |
| Customization | Highly flexible dashboards, queries, and custom metrics for deep, granular analysis. | More standardized dashboards and workflows, optimized for faster deployment and consistency. |
| Deployment Model | Agent-based with strong support for containers, Kubernetes, and serverless environments. | Primarily agentless (with optional collectors), ideal for legacy systems and network devices. |
| Integration Breadth | 600+ integrations across cloud services, developer tools, and SaaS platforms. | 3,000+ integrations, with strong emphasis on infrastructure, network devices, and enterprise systems. |
| Primary Focus | Built for cloud-native, DevOps-driven observability across modern applications and microservices. | Built for hybrid IT operations, with strong coverage of on-premises, network, and infrastructure monitoring. |
| Read Datadog ReviewOpens new window | Read LogicMonitor ReviewOpens new window |
Similarities Between Datadog and LogicMonitor
| API Access | Each monitoring platform offers robust APIs for custom integrations and automation, supporting advanced workflows. |
|---|---|
| Alerting & Notifications | Each observability platform offers customizable alerting and notification workflows, including integrations with Slack and PagerDuty. |
| Cloud Monitoring | Both provide real-time monitoring for cloud infrastructure, supporting AWS, Azure, and Google Cloud. |
| Infrastructure Monitoring | Both deliver deep visibility into servers, virtual machines, containers, and network performance from a single platform. |
| Log Management | Both support centralized log collection, search, and analysis to help troubleshoot issues and investigate incidents. |
| Read Datadog ReviewOpens new window Read LogicMonitor ReviewOpens new window | |