10 Best Debugging Tools Reviewed in 2026

Best Debugging Tools Shortlist


The best debugging tools help teams identify defects quickly, trace performance issues, reduce application downtime, and validate complex code behavior before it reaches production. These tools give developers the visibility they need to pinpoint faults and confirm that systems behave as expected under different conditions.
Teams often seek debugging tools when manual troubleshooting slows releases, misconfigurations cause recurring failures, or hidden errors slip through testing environments. Problems like inconsistent logs, unclear stack traces, and fragmented monitoring lead to delays, inefficient collaboration, and unstable applications.
With over 20 years in the industry as a Chief Technology Officer, I’ve tested and reviewed dozens of debugging tools across real-world environments to evaluate their accuracy, integration depth, and usability. This guide highlights the top debugging tools that help teams maintain reliable applications. Each review covers features, pros and cons, and best-fit use cases to help you choose the right tool.
Why Trust Our Software Reviews
We’ve been testing and reviewing software since 2023. As tech leaders ourselves, we know how critical and difficult it is to make the right decision when selecting software.
We invest in deep research to help our audience make better software purchasing decisions. We’ve tested more than 2,000 tools for different tech use cases and written over 1,000 comprehensive software reviews. Learn how we stay transparent & our software review methodology.
Best Debugging Tools Summary
This comparison chart summarizes pricing details for my top debugging tools selections to help you find the best one for your budget and business needs.
| Tool | Best For | Trial Info | Price | ||
|---|---|---|---|---|---|
| 1 | Best for automated error root cause tracking | Free plan + free trial + free demo available | From $26/month (billed annually) | Website | |
| 2 | Best for mobile app feedback | 14-day free trial + free demo available | From $249/month (billed annually) | Website | |
| 3 | Best for real-time monitoring | Free trial + free demo available | Pricing upon request | Website | |
| 4 | Best for Apple platform development | Free-forever plan available | Free to use | Website | |
| 5 | Best for remote web debugging | Not available | Free to use | Website | |
| 6 | Best for runtime debugging | Not available | Free to use | Website | |
| 7 | Best for Android integration | Not available | Free to use | Website | |
| 8 | Best for browser-based inspection | Not available | Free to use | Website | |
| 9 | Best for cross-platform development | Free trial available | From $1060/year | Website | |
| 10 | Best for Android emulation | Free trial + free plan available | From $49/student and workstation/year | Website |
-

Site24x7
Visit WebsiteThis is an aggregated rating for this tool including ratings from Crozdesk users and ratings from other sites.4.7 -
GitHub Actions
Visit WebsiteThis is an aggregated rating for this tool including ratings from Crozdesk users and ratings from other sites.4.8 -
Docker
Visit WebsiteThis is an aggregated rating for this tool including ratings from Crozdesk users and ratings from other sites.4.6


Best Debugging Tool Reviews
Below are my detailed summaries of the best debugging tools that made it onto my shortlist. My reviews offer a detailed look at the key features, pros & cons, integrations, and ideal use cases of each tool to help you find the best one for you.

Sentry is a vital tool for developers looking to improve their debugging. It offers application performance monitoring and error tracking capabilities, making it suitable for web and mobile development, gaming, and enterprise environments. By integrating with platforms like GitHub and Slack, Sentry helps your team maintain high-quality service and improve the overall user experience.
Why I Picked Sentry
I picked Sentry for its ability to automate root cause analysis, which is a significant advantage for debugging. Its AI debugger, Seer, analyzes logs and traces to pinpoint issues, reducing the time you spend on manual error tracking. The GitHub integration automatically maps incidents to releases and pull requests, improving your workflow. These features make Sentry valuable for quickly identifying and resolving errors in your applications.
Sentry Key Features
In addition to automated error root cause tracking, Sentry offers:
- Session Replay: This feature lets you replay user sessions to better understand error context.
- Tracing: Sentry provides end-to-end tracing to monitor application performance in real time.
- AI Code Review: This tool helps prevent errors before they reach production by analyzing your codebase for potential issues.
- Automatic Incident Mapping: Sentry automatically maps incidents to releases and pull requests, aiding in faster issue resolution.
Sentry Integrations
Integrations include GitHub, Slack, Jira, Bitbucket, GitLab, Trello, Azure DevOps, PagerDuty, Asana, and AWS Lambda.
Pros and Cons
Pros:
- Session replay helps teams understand issues from the user’s perspective
- Alerts help teams respond quickly to critical issues
- Comprehensive monitoring, including performance and crash reporting
Cons:
- Less coverage for infrastructure-level monitoring
- Complex implementation especially for diverse platform stacks
New Product Updates from Sentry

Sentry Adds AI-Detected Issues for Application Monitoring
Sentry’s AI issue detection is now generally available, analyzing traces and logs to automatically surface issues across categories like HTTP, database, runtime performance, security, and code health. For more information, visit Sentry's official site.
 .
.
Instabug is an AI-powered mobile observability platform targeting mobile development teams. It focuses on bug detection, user feedback, and app performance optimization.
Why I picked Instabug: Instabug excels in collecting real-time user feedback, crucial for mobile app developers. Its proactive bug and crash detection features help your team identify and fix issues efficiently. The Business Impact Dashboard and Prioritized Issues tools make sure you focus on what matters most. Frustration-Free Sessions enhance the user experience, aligning with its USP of being the best for mobile app feedback.
Standout features & integrations:
Features include proactive bug and crash detection, user feedback collection, and tools for optimizing app stability. Your team can leverage the Business Impact Dashboard and Prioritized Issues to prioritize tasks effectively.
Integrations include Jira, GitHub, Slack, Trello, Asana, Microsoft Teams, Zendesk, Bitbucket, PagerDuty, and Azure DevOps.
Pros and Cons
Pros:
- Supports multiple platforms
- Real-time user feedback
- Effective bug detection
Cons:
- Steep learning curve
- Limited customization options

New Relic is an observability platform tailored for developers, focusing on monitoring applications and infrastructure. It's ideal for tech teams needing comprehensive insights into their systems.
Why I picked New Relic: Its real-time monitoring capabilities set it apart. With features like end-to-end monitoring and over 780 integrations, it provides quick setup and extensive data insights. Tools like CodeStream and Error Tracking help manage errors efficiently, aligning with its USP of real-time monitoring. The platform's scalable nature and support for OpenTelemetry make it a versatile choice for developers.
Standout features & integrations:
Features include end-to-end monitoring for tech stacks, cross-platform observability tools, and secure data management supporting OpenTelemetry. Your team can monitor applications and infrastructure within minutes, gaining actionable insights.
Integrations include AWS, Azure, Google Cloud, Kubernetes, Slack, PagerDuty, GitHub, Jenkins, ServiceNow, and Jira.
Pros and Cons
Pros:
- Transparent pay-per-use pricing
- Extensive integration options
- Real-time data analytics
Cons:
- Potential data overload
- Complex dashboard navigation
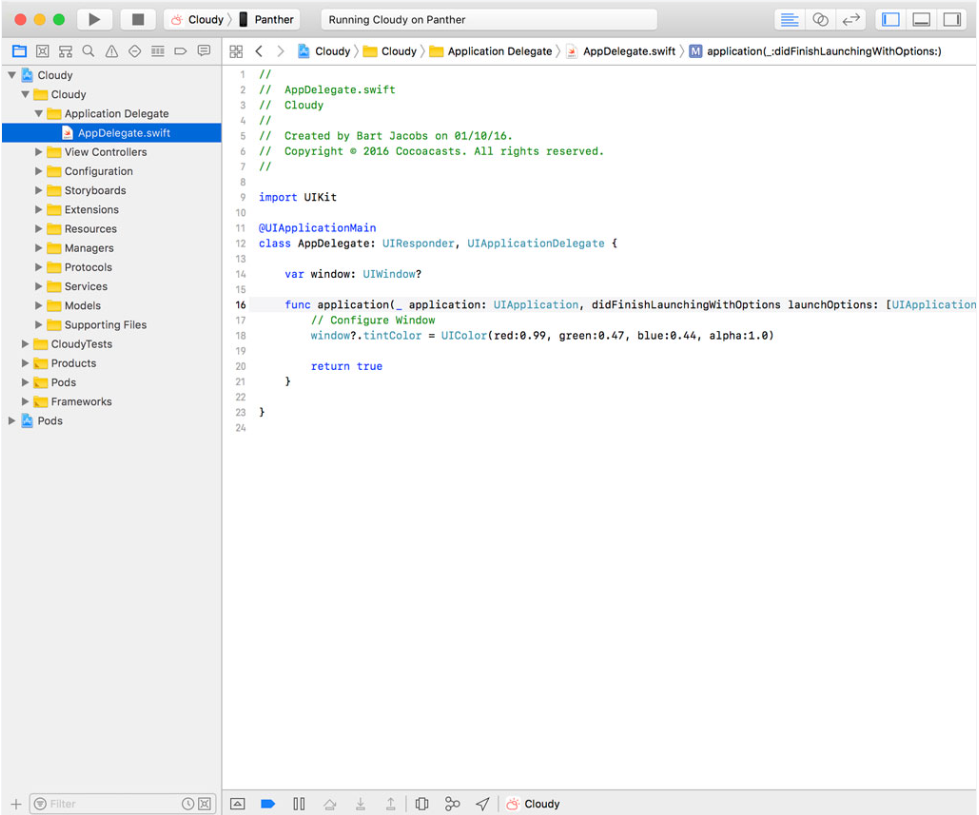
Xcode is an integrated development environment (IDE) tailored for developers working on Apple platforms, including macOS, iOS, watchOS, and tvOS. It provides a suite of tools for building, testing, and debugging applications specifically for Apple's ecosystem.
Why I picked Xcode: It offers a comprehensive suite of tools ideal for Apple platform development, allowing developers to create apps across multiple Apple devices. Your team can use features like Interface Builder for designing user interfaces and Swift Playgrounds for interactive coding. The tool's integrated simulator lets you test applications in a virtual environment. These features make it a top choice for teams focused on developing within Apple's ecosystem.
Standout features & integrations:
Features include a built-in code editor, Interface Builder for creating user interfaces, and Swift Playgrounds for interactive coding. You can also use the integrated simulator to test apps on various Apple devices. The tool supports version control and offers debugging tools to streamline the development process.
Integrations include GitHub, Bitbucket, CocoaPods, Carthage, and Apple Developer Program.
Pros and Cons
Pros:
- Interactive coding with Swift Playgrounds
- Integrated testing environment
- Comprehensive Apple device support
Cons:
- Can be resource-intensive
- Requires macOS to run
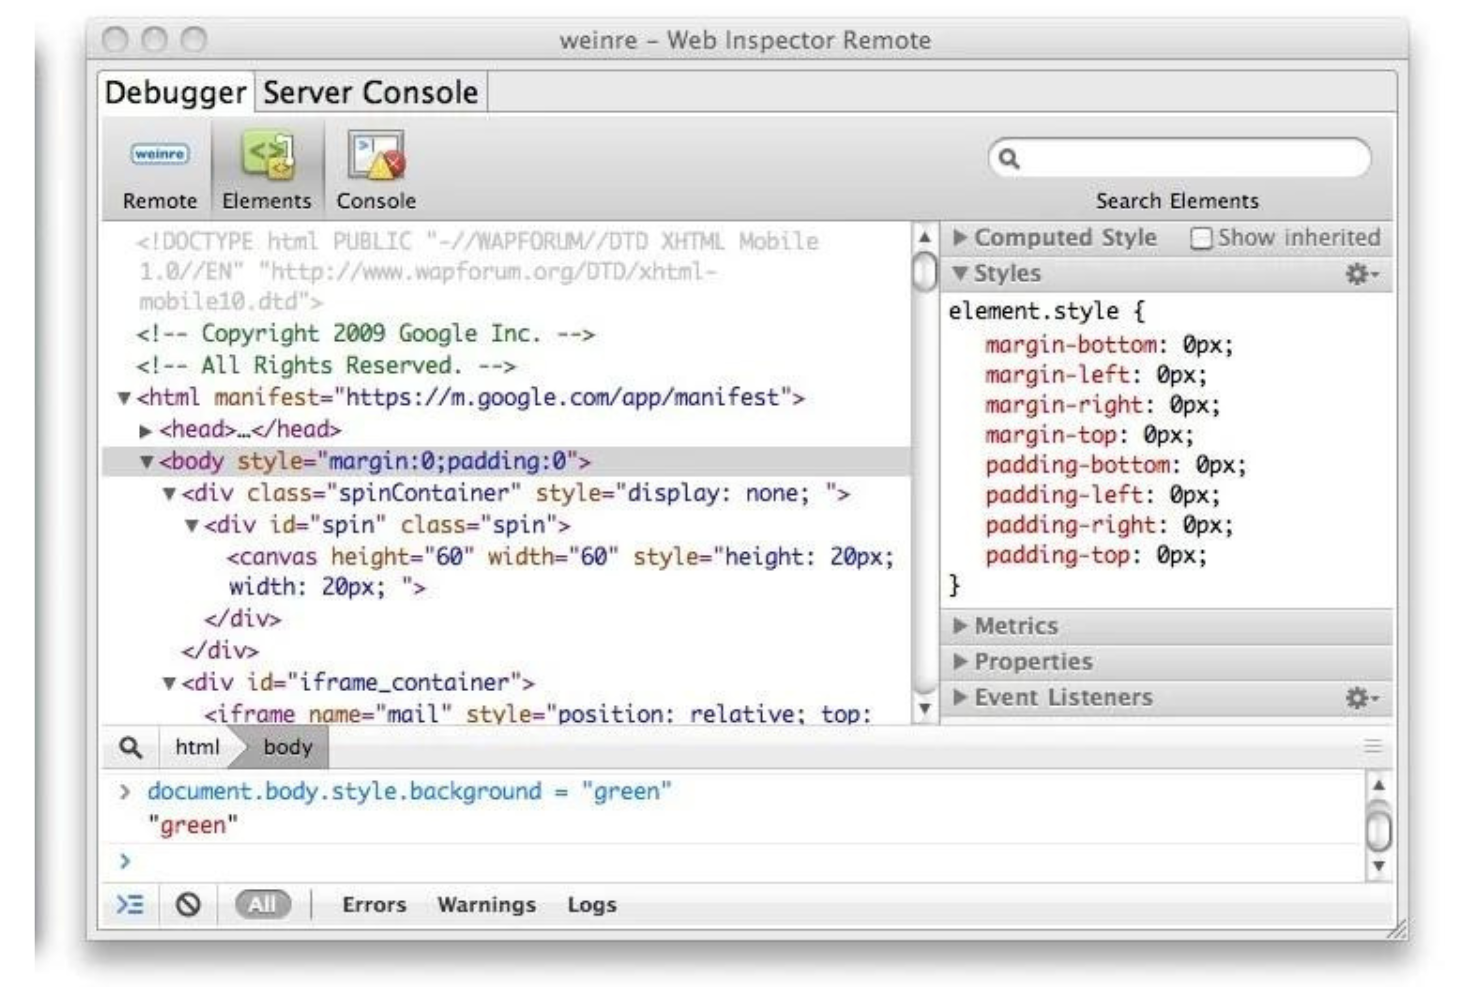
Apache Weinre is a software tool designed to assist in debugging web pages on many browsers, including those running on mobile devices. It allows developers to execute real-time changes and observe the effects instantly, reinforcing its status as best for real-time website debugging across different browsers.
Why I Picked Apache Weinre:
In my search for the best debugging tools, Apache Weinre caught my attention due to its ability to deliver practical, real-time debugging solutions across numerous browser environments. I was impressed by its capability to modify web pages on the fly and immediately saw the impact, making it a standout in a crowded market of debugging tools. This powerful functionality underscores my belief in its suitability as the best choice for real-time website debugging across a range of browsers.
Standout Features & Integrations:
Features include its Remote Web Inspector, which mirrors the functionality of WebKit's Web Inspector. It also boasts target-specific debugging, which lets you debug multiple pages simultaneously. Moreover,
Integrations include popular web technologies like HTML, CSS, and JavaScript, enhancing its usability for various web development projects.
Pros and Cons
Pros:
- Open-source and free to use
- Provides remote inspection capabilities
- Supports real-time debugging across multiple browsers
Cons:
- The user interface might seem outdated compared to newer tools
- Lacks advanced features found in some commercial tools
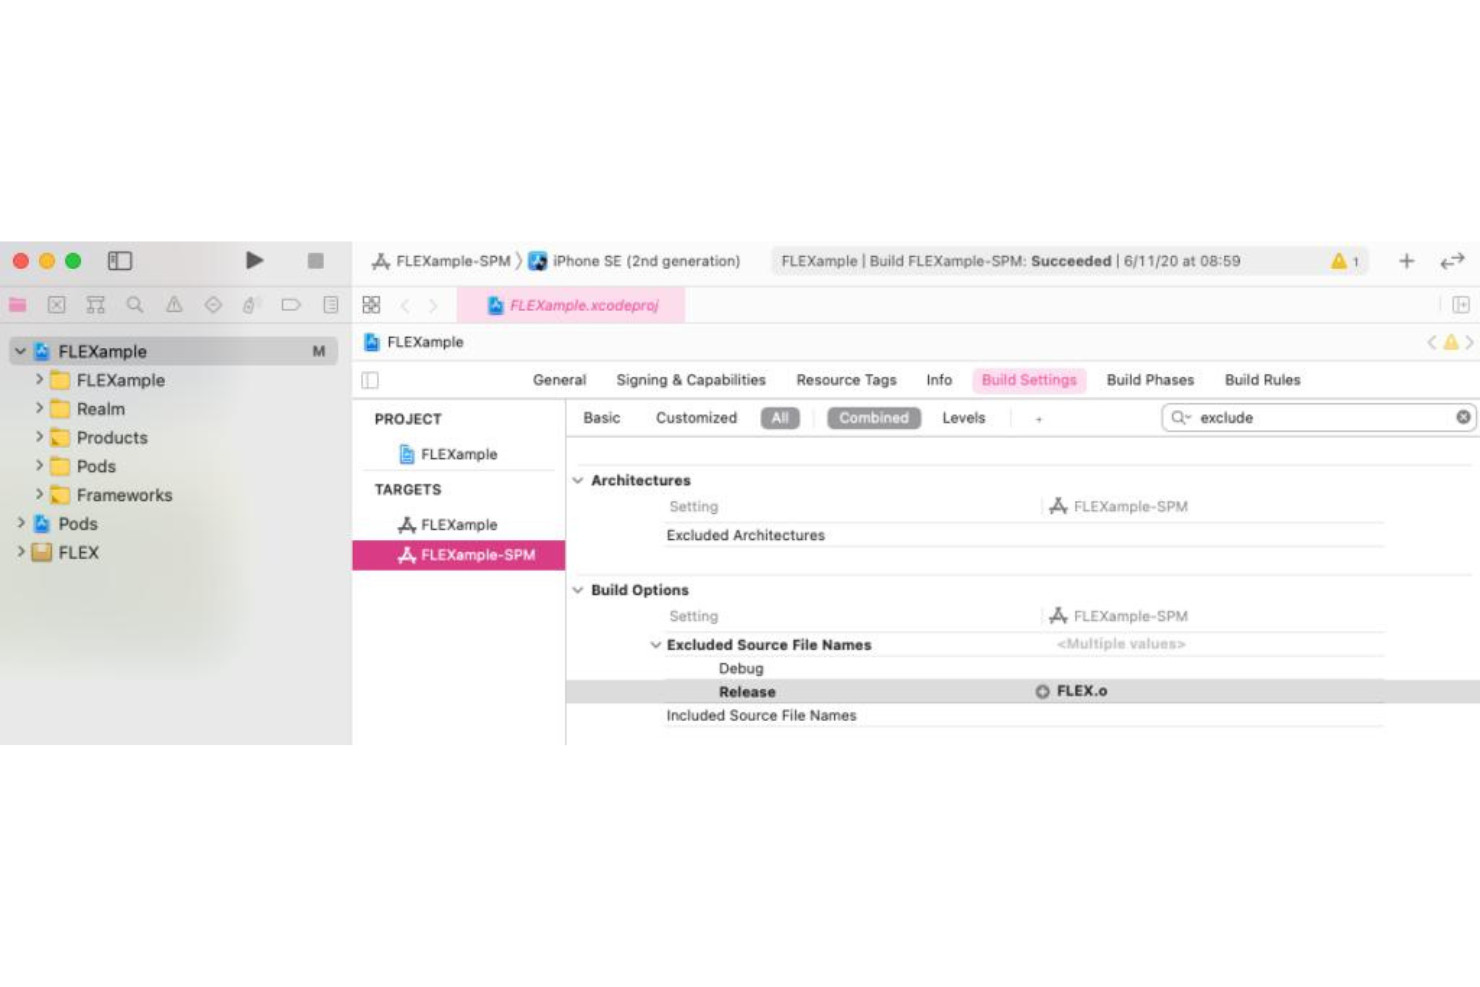
FLEX is an in-app debugging tool designed for iOS applications, allowing developers to inspect and modify their app's state directly within the app interface. It enables real-time exploration and adjustment of various components, enhancing the development and debugging process.
Why I picked FLEX: It provides an interactive view hierarchy inspection, file system browsing, and the ability to modify NSUserDefaults values on the fly. Additionally, you can search for any live object on the heap, inspect and change its properties, and even invoke methods to observe their outcomes. This in-app approach streamlines your workflow, making runtime debugging more efficient and intuitive.
Standout features & integrations:
Features include an interactive view hierarchy browser that lets you examine and tweak your app's UI components directly. The file system explorer grants access to your app's sandboxed files, facilitating on-device file management. Moreover, FLEX allows dynamic modification of NSUserDefaults, enabling you to test different configurations without redeploying your app.
Integrations include seamless compatibility with iOS development environments, enhancing your existing toolset without additional setup.
Pros and Cons
Pros:
- Direct file system access within the app
- In-app debugging without external tools
- Real-time view hierarchy inspection
Cons:
- Limited to iOS applications
- Requires manual integration into projects

Stetho is a debugging platform designed primarily for Android applications. It caters to Android developers by providing an easy way to debug applications with a built-in Chrome Developer Tools interface.
Why I picked Stetho: Stetho offers a unique integration with Chrome Developer Tools, making it highly effective for Android app debugging. Your team can inspect databases, view network activity, and utilize a JavaScript console directly from the browser. The ability to inspect view hierarchies and network operations offers in-depth insights. This aligns with its USP of being the best for Android integration.
Standout features & integrations:
Features include database inspection, network traffic monitoring, and view hierarchy examination. You can also access a JavaScript console directly through Chrome. These features are designed to simplify the debugging process for Android developers.
Integrations include Chrome Developer Tools, SQLite, JSON, and Android Debug Bridge.
Pros and Cons
Pros:
- Network activity visualization
- Direct Chrome integration
- Easy database inspection
Cons:
- Limited to Android apps
- Requires setup configuration
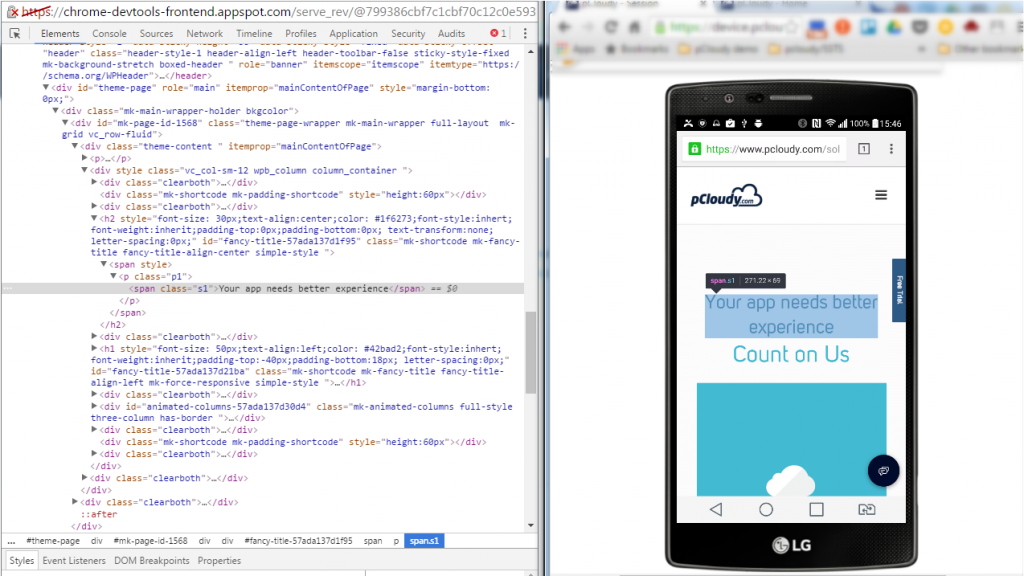
Chrome Mobile DevTools is an extension of Google Chrome's built-in development tools, specifically designed for mobile web app analysis. The tool provides developers with a wide range of debugging and testing features within a familiar Chrome environment. With its ability to offer real-time debugging in a known environment, it becomes an excellent tool for analyzing mobile web apps.
Why I Picked Chrome Mobile DevTools:
I chose Chrome Mobile DevTools because of its smooth integration with the familiar Chrome DevTools. Its ease of access and use makes it stand out, especially for those already using Chrome as their primary browser. This tool is "best for" debugging processes and analyzing mobile web apps as it allows developers to work in a well-known environment, reducing the need for learning new tools or interfaces.
Standout Features & Integrations:
Chrome Mobile DevTools stands out with its live debugging capabilities, remote device access, and network throttling for real-world condition testing. Chrome Mobile DevTools simulate different device capabilities and inputs for testing mobile web apps. It's connected to the entire Google Chrome environment, allowing developers to use a variety of additional Chrome extensions and tools.
Pros and Cons
Pros:
- Free to use
- Includes extensive debugging features
- Provides a familiar environment for users of Google Chrome
Cons:
- Some users may find the user interface less intuitive compared to dedicated mobile debugging tools
- Limited to Google Chrome users
- Lacks traditional integrations with other development tools
Qt is a cross-platform software development framework designed for developers who need to build applications that run on multiple operating systems. It provides tools for creating both desktop and mobile applications, supporting a wide range of industries.
Why I picked Qt: Qt is known for its ability to support cross-platform development, making it ideal for teams working on diverse operating systems. It offers a unified API and helps you write code once and deploy it everywhere. The framework includes a rich set of libraries and tools for developing user interfaces and applications. This allows your team to efficiently manage projects that require compatibility across various platforms.
Standout features & integrations:
Features include a wide range of libraries for UI development, easy deployment across platforms, and a rich set of APIs. Your team can utilize the integrated development environment to streamline the coding process. The framework also supports 2D and 3D graphics, which enhances the visual appeal of applications.
Integrations include Visual Studio, CMake, OpenGL, WebAssembly, Android, iOS, Linux, Windows, and macOS.
Pros and Cons
Pros:
- Supports 2D and 3D graphics
- Rich set of libraries
- Cross-platform compatibility
Cons:
- Complex licensing structure
- High resource consumption

Genymotion is an Android emulator designed for developers and testers who need to run and test applications across different Android devices and versions. It provides a virtual environment that helps in debugging and testing applications efficiently.
Why I picked Genymotion: It's known for its high-performance Android emulation capabilities, making it ideal for developers needing to test apps on various devices. The tool allows you to simulate different scenarios, including battery levels and GPS settings. It supports cloud-based testing, which enhances flexibility for remote teams. This makes it a top choice for Android emulation, offering a reliable platform for testing across multiple environments.
Standout features & integrations:
Features include high-speed emulation, cloud-based testing, and customizable device configurations. You can simulate different network conditions to test app performance under various circumstances. The tool's ability to emulate multiple Android versions helps ensure app compatibility.
Integrations include Android Studio, Jenkins, Selenium, Appium, Eclipse, IntelliJ IDEA, CircleCI, Bitbucket, and Travis CI.
Pros and Cons
Pros:
- Customizable device settings
- High-speed emulation
- Cloud-based testing options
Cons:
- Limited to Android emulation
- Can be resource-intensive
Other Debugging Tools
Here are some additional debugging tools options that didn’t make it onto my shortlist, but are still worth checking out:
- HttpWatch
For HTTP traffic analysis
- Embrace
For mobile performance insights
- Bugsee
For video bug reporting
- Spark Inspector
For iOS app inspection
- Botkube
Good for monitoring and debugging Kubernetes deployments
- Bugfender
Good for remote logging and application debugging
- RubyMotion
Good for building cross-platform native apps using Ruby
- BugBattle
Good for integrating an interactive bug-reporting library
- Appetize.io
Good for streaming iOS and Android apps in the browser


Debugging Tool Selection Criteria
When selecting the best debugging tools to include in this list, I considered common buyer needs and pain points like identifying bugs quickly and ensuring cross-platform compatibility. I also used the following framework to keep my evaluation structured and fair:
Core Functionality (25% of total score)
To be considered for inclusion in this list, each solution had to fulfill these common use cases:
- Identify and report bugs
- Monitor application performance
- Support multiple programming languages
- Provide real-time alerts
- Facilitate team collaboration
Additional Standout Features (25% of total score)
To help further narrow down the competition, I also looked for unique features, such as:
- Advanced error tracking
- Customizable dashboards
- Integration with CI/CD pipelines
- AI-driven bug detection
- Offline debugging capabilities
Usability (10% of total score)
To get a sense of the usability of each system, I considered the following:
- Intuitive interface design
- Easy navigation
- Minimal learning curve
- Clear documentation
- Responsive interface
Onboarding (10% of total score)
To evaluate the onboarding experience for each platform, I considered the following:
- Availability of training videos
- Interactive product tours
- Access to templates
- Webinars and live demos
- Supportive chatbots
Customer Support (10% of total score)
To assess each software provider’s customer support services, I considered the following:
- Availability of 24/7 support
- Multichannel support options
- Quick response times
- Access to a knowledge base
- Personalized assistance
Value For Money (10% of total score)
To evaluate the value for money of each platform, I considered the following:
- Competitive pricing models
- Features offered at each price tier
- Scalability of the solution
- Cost of additional features
- Free trial availability
Customer Reviews (10% of total score)
To get a sense of overall customer satisfaction, I considered the following when reading customer reviews:
- Overall user satisfaction ratings
- Frequency of updates and improvements
- Feedback on feature effectiveness
- Comments on customer support
- Reports on system reliability
How to Choose Debugging Tools
It’s easy to get bogged down in long feature lists and complex pricing structures. To help you stay focused as you work through your unique software selection process, here’s a checklist of factors to keep in mind:
| Factor | What to Consider |
| Scalability | Ensure the tool can grow with your team and handle increased workloads. Look for solutions that support multiple projects and users without slowing down. |
| Integrations | Check if the tool integrates with your existing tech stack, like CI/CD pipelines, profiling tools, and communication platforms, to enhance productivity. |
| Customizability | Look for tools that allow you to tailor dashboards and reports to suit your specific needs, ensuring the data is relevant to your team’s workflow. |
| Ease of Use | Choose a tool with an intuitive interface that your team can easily navigate. This reduces training time and lets you focus on debugging. |
| Budget | Consider the total cost, including any hidden fees or charges for additional features. Ensure the tool fits within your financial constraints. |
| Security Safeguards | Prioritize tools that offer robust security features to protect your data, such as encryption and compliance with industry standards. |
| Support Services | Evaluate the availability and quality of customer support, including response times and access to resources like documentation and tutorials. |
| Performance Metrics | Ensure the tool provides comprehensive performance metrics to help you identify and resolve bottlenecks quickly. |
Trends in Debugging Tools
In my research, I sourced countless product updates, press releases, and release logs from different debugging tools vendors. Here are some of the emerging trends I’m keeping an eye on:
- AI-Driven Insights: Many debugging tools now use AI to provide insights into error patterns and suggest fixes. This helps developers identify issues faster and reduces manual effort. Vendors like Embrace and Bugfender are incorporating AI to enhance their error analysis capabilities.
- Real-Time Collaboration: Debugging tools are increasingly offering features that allow teams to collaborate in real-time. This trend supports remote work environments where team members need to solve issues together. Tools like New Relic are adding features for instant collaboration.
- Cross-Platform Debugging: As businesses develop apps for multiple platforms, there's a growing demand for tools that support cross-platform debugging. Qt and Genymotion are examples of tools that cater to this need, allowing developers to debug across different environments.
- Enhanced Visualization: Tools are improving data visualization to help developers understand complex data more easily. Features like interactive graphs and detailed reports are becoming common. Spark Inspector offers enhanced visualization to make app structure and performance data more accessible.
- Privacy and Compliance: With increasing data regulations, debugging tools are focusing on privacy and compliance features. This ensures that user data is handled securely and in accordance with laws like GDPR. HttpWatch provides features that help businesses stay compliant with data protection regulations.
What Are Debugging Tools?
Debugging tools help developers identify and fix errors or bugs in their code. These tools are generally used by software developers, QA engineers, and IT professionals to ensure applications run smoothly and efficiently.
Real-time collaboration, AI-driven insights, and cross-platform debugging capabilities help with error identification, teamwork efficiency, and broad compatibility. For mobile applications specifically, having robust mobile crash reporting tools becomes essential for maintaining app stability. Overall, these tools save time, reduce frustration, and improve the quality of software products.
Features of Debugging Tools
When selecting debugging tools, keep an eye out for the following key features:
- Real-time monitoring: Provides immediate insights into application performance, helping detect issues as they occur.
- Cross-platform support: Allows developers to debug applications across multiple operating systems, ensuring broad compatibility.
- AI-driven insights: Uses machine learning to identify error patterns and suggest fixes, reducing manual workload.
- Interactive visualization: Offers detailed graphs and reports that make complex data easier to understand and analyze.
- Collaboration tools: Enables team members to work together in real-time to solve issues, improving efficiency and communication.
- Error tracking and alerts: Continuously monitors for errors and sends alerts to keep developers informed of issues promptly.
- Session recording: Captures user sessions to provide context for bugs, aiding in quicker diagnosis and resolution.
- Security compliance: Ensures that the tools meet data protection standards, safeguarding user information.
- Customizable dashboards: Allows users to tailor the interface to their specific needs, improving usability and relevance.
- Network traffic analysis: Examines HTTP and HTTPS traffic to identify performance bottlenecks and security vulnerabilities.
Benefits of Debugging Tools
Implementing debugging tools provides several benefits for your team and your business. Here are a few you can look forward to:
- Improved efficiency: Real-time monitoring and AI-driven insights help your team quickly identify and resolve issues, saving time and effort.
- Better collaboration: Features like real-time collaboration tools allow team members to work together more effectively, enhancing teamwork and communication.
- Increased reliability: Continuous error tracking and alerts ensure that your applications run smoothly, minimizing downtime and disruptions.
- Enhanced understanding: Interactive visualization and session recording provide deeper insights into application behavior, aiding in thorough analysis and diagnosis.
- Cost savings: By reducing the time spent on manual debugging, these tools help lower operational costs and improve resource allocation.
- Compliance assurance: Security compliance features make sure your applications adhere to data protection standards, safeguarding sensitive information.
- Cross-platform compatibility: Support for multiple operating systems allows your team to develop and debug applications more flexibly, broadening your reach.
Costs and Pricing of Debugging Tools
Selecting debugging tools requires an understanding of the various pricing models and plans available. Costs vary based on features, team size, add-ons, and more. The table below summarizes common plans, their average prices, and typical features included in debugging tools solutions:
Plan Comparison Table for Debugging Tools
| Plan Type | Average Price | Common Features |
| Free Plan | $0 | Basic error tracking, limited integrations, and community support. |
| Personal Plan | $5-$25/user/month | Advanced error tracking, real-time alerts, and email support. |
| Business Plan | $30-$75/user/month | Full integrations, collaboration tools, and priority customer support. |
| Enterprise Plan | $100+/user/month | Customizable dashboards, security compliance features, and dedicated account management. |
Debugging Tools FAQs
Here are some answers to common questions about debugging tools:
What are the three components of the debugging process?
The three components of the debugging process are finding, identifying, and fixing. First, you need to find the unexpected behavior in your application. Then, identify the root cause of this behavior. Finally, implement a solution to fix the issue and ensure it doesn’t recur.
What are the four debugging steps?
The four steps in the debugging process are identifying bugs, locating errors, analyzing the cause, and addressing lateral damage. Start by finding defects in your code, locate the specific errors, analyze what caused them, and fix any related issues that may arise.
How do debugging tools help in the development process?
Debugging tools help by identifying coding errors at various stages of development. They allow you to test run applications and see what lines of code were not executed. This helps streamline the process of finding and fixing issues, saving time and effort.
What strategies can be used to debug effectively?
Effective debugging strategies include running a debugger, employing a scientific approach, debugging after each section of new code, using backtracking methods, and performing binary searches. These strategies help you systematically identify and resolve issues in your code.
How can debugging tools improve team collaboration?
Debugging tools enhance team collaboration by providing real-time insights and shared dashboards. This allows team members to work together in identifying and resolving issues, improving communication and efficiency among developers.
What should you consider when choosing a debugging tool?
When choosing a debugging tool, consider factors like scalability, integrations, ease of use, and security safeguards. Ensure the tool fits your team’s specific needs and can handle your application’s complexity while providing necessary support and features.
What's Next?
If you're in the process of researching debugging tools, connect with a SoftwareSelect advisor for free recommendations.
You fill out a form and have a quick chat where they get into the specifics of your needs. Then you'll get a shortlist of software to review. They'll even support you through the entire buying process, including price negotiations.