

O Honeycomb é uma ferramenta concebida para fornecer informações sobre o funcionamento interno do seu sistema, ajudando-o a otimizar o desempenho e a resolver problemas.
Os benefícios são numerosos; permite rastrear eventos individuais, tornando os sistemas complexos observáveis e permitindo-lhe compreender, aprender com e depurar o seu software.
No entanto, pode haver situações em que queira uma alternativa ao Honeycomb. Talvez esteja a utilizar uma linguagem de programação específica, como PHP, ou precise de uma ferramenta que ofereça conformidade com a SOC. Talvez queira acesso ao código-fonte ou procure um conjunto diferente de funcionalidades.
Quaisquer que sejam os seus motivos, compilei uma lista das principais alternativas ao Honeycomb, com informações sobre os produtos e classificações por estrelas, para o ajudar a encontrar a melhor opção para as suas necessidades específicas. Por isso, vamos explorar estas opções em conjunto.
O que é o Honeycomb?
O Honeycomb é uma plataforma de observabilidade que o ajuda a depurar, monitorizar e compreender os seus sistemas de software em tempo real. É utilizada por engenheiros de software, equipas de DevOps e engenheiros de fiabilidade de sites que precisam de identificar rapidamente problemas de desempenho e comportamentos invulgares em produção. As informações ao nível dos eventos, as consultas e os mapas de calor ajudam a analisar o comportamento do sistema, detetar estrangulamentos e melhorar a fiabilidade das aplicações. De forma geral, o Honeycomb proporciona à sua equipa uma visão mais clara do que está a acontecer no seu código, para que possa resolver os problemas mais rapidamente.
Why Trust Our Software Recommendations
6,700+
Reviews
20
Industry experts
16+
Evaluation factors
14
Years
Our team has been testing and reviewing software since 2012. As tech leaders ourselves, we know how difficult—and important—it is to choose the right software.
For this guide, we evaluated tools using hands-on testing and independent research, scoring tools using our selection criteria.
Our reviews reflect our human editorial judgment, not a sales pitch.
Expert reviewers:
- Paulo Gardini MiguelTech Director
 Tim FisherVP of AI
 Gabriel RosasTech Lead & Software Architect
 Christhian GruhnTech Lead & Platform Architect

Tabela de comparação das alternativas ao Honeycomb
Esta tabela de comparação resume os detalhes de preços das minhas principais alternativas ao Honeycomb:
| Tool | Best For | Trial Info | Price | ||
|---|---|---|---|---|---|
| 1 | Best for context-rich distributed tracing | Free plan + 14-day trial + free demo available | From $26/month (billed annually) | Website | |
| 2 | Best for AI-driven full-stack automated monitoring | 15-day free trial | From $7/month | Website | |
| 3 | Best for open-source infrastructure monitoring at scale | 5-day free trial | From $50/month | Website | |
| 4 | Best for unified traces, logs, and metrics in one view | Free plan available | From $15/month (billed annually) | Website | |
| 5 | Best for end-to-end business transaction tracing | 30-day free trial | From $6/vCPU/month (billed annually) | Website | |
| 6 | Best for application performance insights and end-user experience tracking | Free plan available | From $10/user/month | Website | |
| 7 | Best for cloud-native log management and analytics | 14-day free trial | Pricing upon request | Website | |
| 8 | Best for volume-based log monitoring and alerting | 30-day free trial | Pricing upon request | Website | |
| 9 | Best for machine data-driven operational intelligence | 60-day free trial | Pricing upon request | Website | |
| 10 | Best for Kubernetes-native metrics and alerting | Free plan available | Pricing upon request | Website |


Avaliações das melhores alternativas ao Honeycomb
Apresentamos abaixo os meus resumos detalhados das melhores alternativas ao Honeycomb que entraram na minha lista. As minhas avaliações oferecem uma análise detalhada das principais funcionalidades, vantagens & desvantagens, integrações e casos de utilização ideais de cada ferramenta, para o ajudar a encontrar a melhor opção para si.
 Best for context-rich distributed tracing
- Free plan + 14-day trial + free demo available
- From $26/month (billed annually)
Visit WebsiteCustomer Rating:4.5/5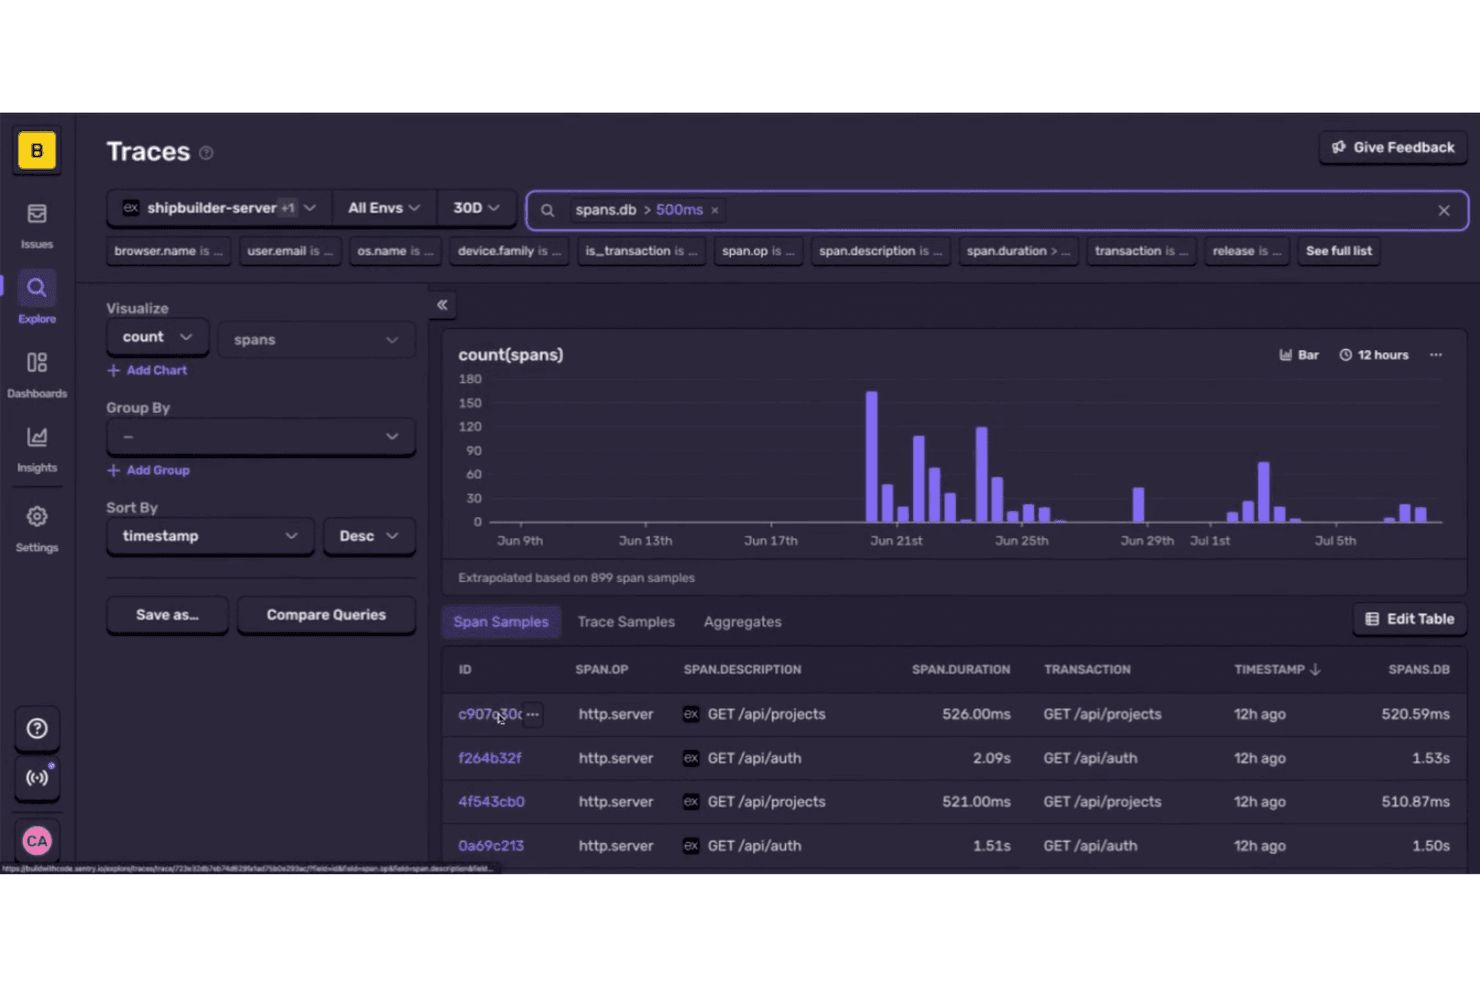
Sentry lets users trace slow database spans across services over time. Sentry is an application monitoring platform for software teams that helps engineers find errors and performance issues across services, diagnose incidents, and reduce their impact on users.
Who Is Sentry Best For?
Engineering teams running distributed applications that need trace context to pinpoint performance issues across services.
Why I Picked Sentry
I picked Sentry as a Honeycomb alternative because it’s Best for context-rich distributed tracing. Its trace view maps spans across services and links errors to the transactions that triggered them. I like how this helps pinpoint where a slow request picks up latency as it moves through an API and its downstream services.
Sentry Key Features
- Error monitoring: Captures exceptions and groups similar events into issues.
- Session Replay: Records user interactions so teams can inspect events around an error.
- Release health: Tracks crash-free sessions and users across software releases.
- Issue alerts: Sends notifications when new issues appear or existing ones change.
Sentry Integrations
Sentry offers native integrations with GitHub, Jira, Slack, GitLab, Microsoft Teams, PagerDuty, Vercel, Bitbucket, Azure DevOps, and Opsgenie. Its integration platform supports custom integrations through webhooks and the REST API.
Pros and Cons
Pros:
- Replay user sessions beside captured errors
- Search spans by attributes and latency percentiles
- Errors link directly to trace context
Cons:
- Dense feature set can clutter the interface
- Primarily targets application errors, not infrastructure
Learn more about Sentry: Best for AI-driven full-stack automated monitoring
- 15-day free trial
- From $7/month
Visit WebsiteCustomer Rating:4.5/5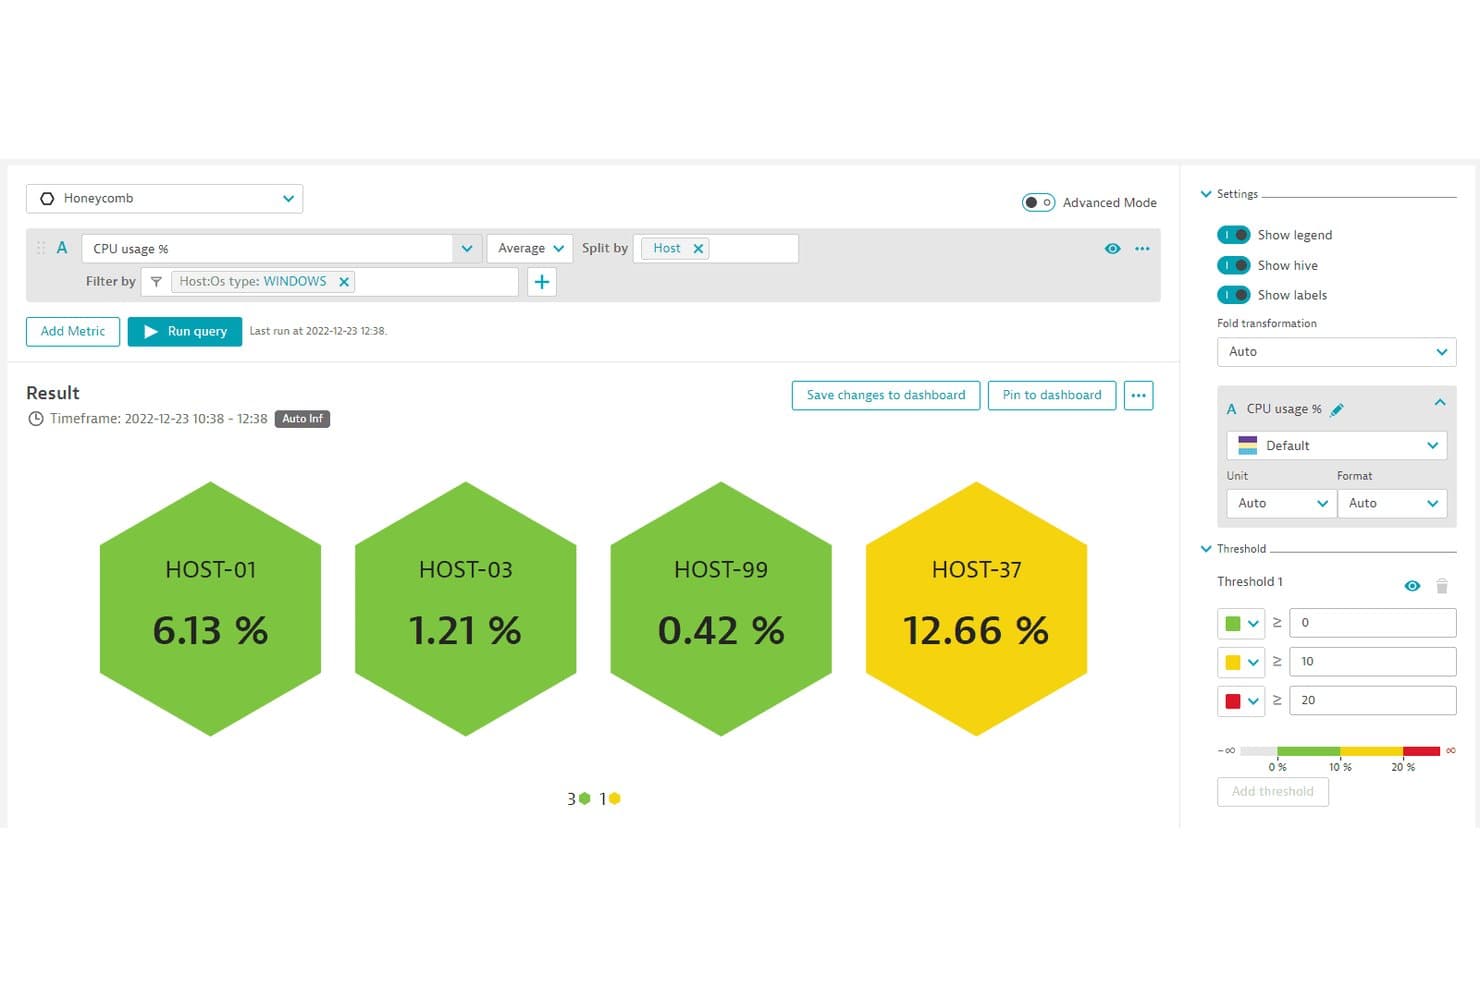
Dynatrace visualizes CPU usage per host using color-coded honeycomb tiles. As a Honeycomb alternative, Dynatrace helps IT and engineering teams connect application, infrastructure, and user-experience data to diagnose service issues across complex environments.
Who Is Dynatrace Best For?
Dynatrace suits IT operations and SRE teams managing complex, distributed environments that need automated monitoring across applications and infrastructure.
Why I Picked Dynatrace
I rate Dynatrace among the best Honeycomb alternatives for its “Best for AI-powered, full-stack automated monitoring solutions” focus. Davis AI analyzes telemetry to identify likely root causes, while OneAgent automatically discovers and instruments services across hosts and cloud workloads. I value its dependency mapping when an API latency spike traces back to a host or downstream service.
Dynatrace Key Features
- Real user monitoring: Tracks user sessions, page loads, and frontend errors.
- Synthetic monitoring: Runs scheduled browser and HTTP checks against endpoints.
- Log monitoring: Collects, searches, and analyzes logs alongside telemetry.
- Cloud infrastructure monitoring: Tracks metrics and health across hosts, containers, and cloud services.
Dynatrace Integrations
Dynatrace Workflows offers officially supported connectors for AWS, Microsoft Azure, GitHub, Jira, Slack, PagerDuty, ServiceNow, Microsoft Teams, GitLab, and Jenkins through Dynatrace Hub. Dynatrace also provides an API for custom integrations.
Pros and Cons
Pros:
- Unified logs, traces, infrastructure, and user monitoring
- OneAgent auto-discovers and instruments services
- Davis AI links anomalies to root causes
Cons:
- Telemetry consumption can make costs unpredictable
- DQL syntax takes time to master
 Best for open-source infrastructure monitoring at scale
- 5-day free trial
- From $50/month
Visit WebsiteCustomer Rating:4.5/5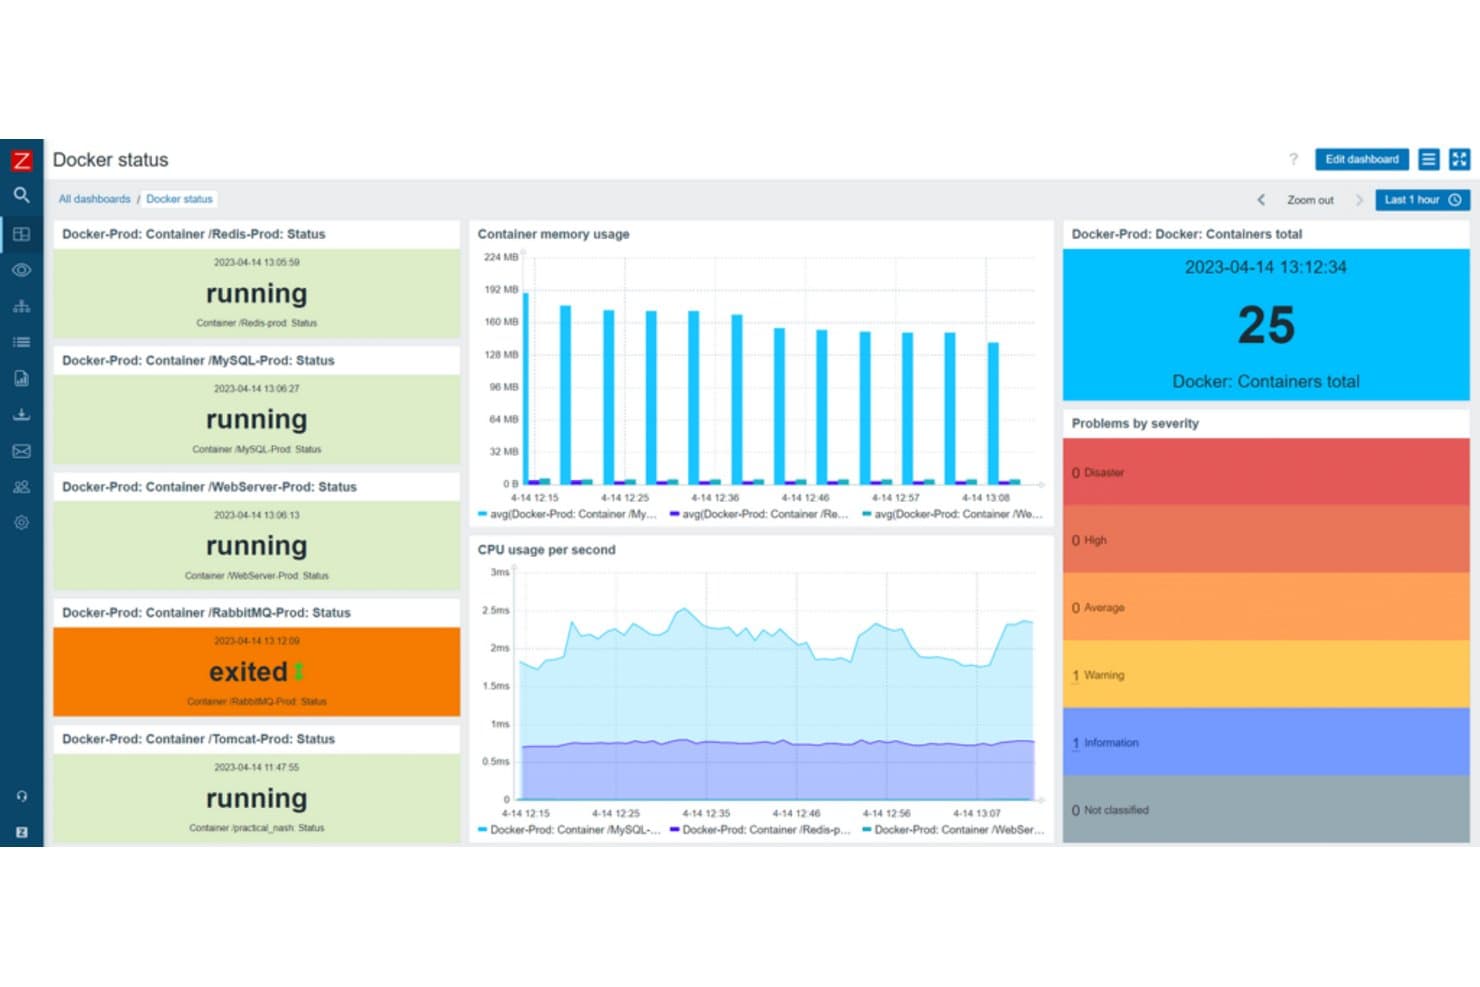
Zabbix monitors Docker container health and resource usage in real time. Zabbix is an infrastructure monitoring platform for IT teams that need to track network devices, servers, applications, and services and catch outages or performance problems across complex environments.
Who Is Zabbix Best For?
Zabbix suits enterprise IT and infrastructure teams that need open-source monitoring across large, interconnected networks and systems.
Why I Picked Zabbix
I picked Zabbix as “Best for enterprise-level, open-source network monitoring” when infrastructure visibility matters more than distributed tracing. Network discovery and SNMP monitoring help locate switches and routers, while templates and triggers standardize checks and alert on interface or service failures. That makes it a useful Honeycomb alternative for tracking infrastructure health across a large environment.
Zabbix Key Features
- Web monitoring: Configure scenarios to check website availability, response time, and page content.
- Log monitoring: Collect log entries and detect matching patterns or errors.
- Service monitoring: Map business services and track their status against service-level objectives.
- Dashboards: Arrange widgets to display monitoring data, problems, and service status.
Zabbix Integrations
Zabbix’s integrations catalog lists 559 brands and 1,986 solutions, including AWS, Azure, Kubernetes, PagerDuty, Slack, Microsoft Teams, ServiceNow, and Jira. It supports custom connections through its API and configurable webhooks; catalog listings aren’t necessarily native integrations.
Pros and Cons
Pros:
- Proxies extend monitoring across remote sites
- Templates standardize infrastructure health checks
- Auto-discovery finds SNMP network devices
Cons:
- Complex setup and alert tuning require expertise
- No native distributed-trace debugging workflow
 Best for unified traces, logs, and metrics in one view
- Free plan available
- From $15/month (billed annually)
Visit WebsiteCustomer Rating:4.5/5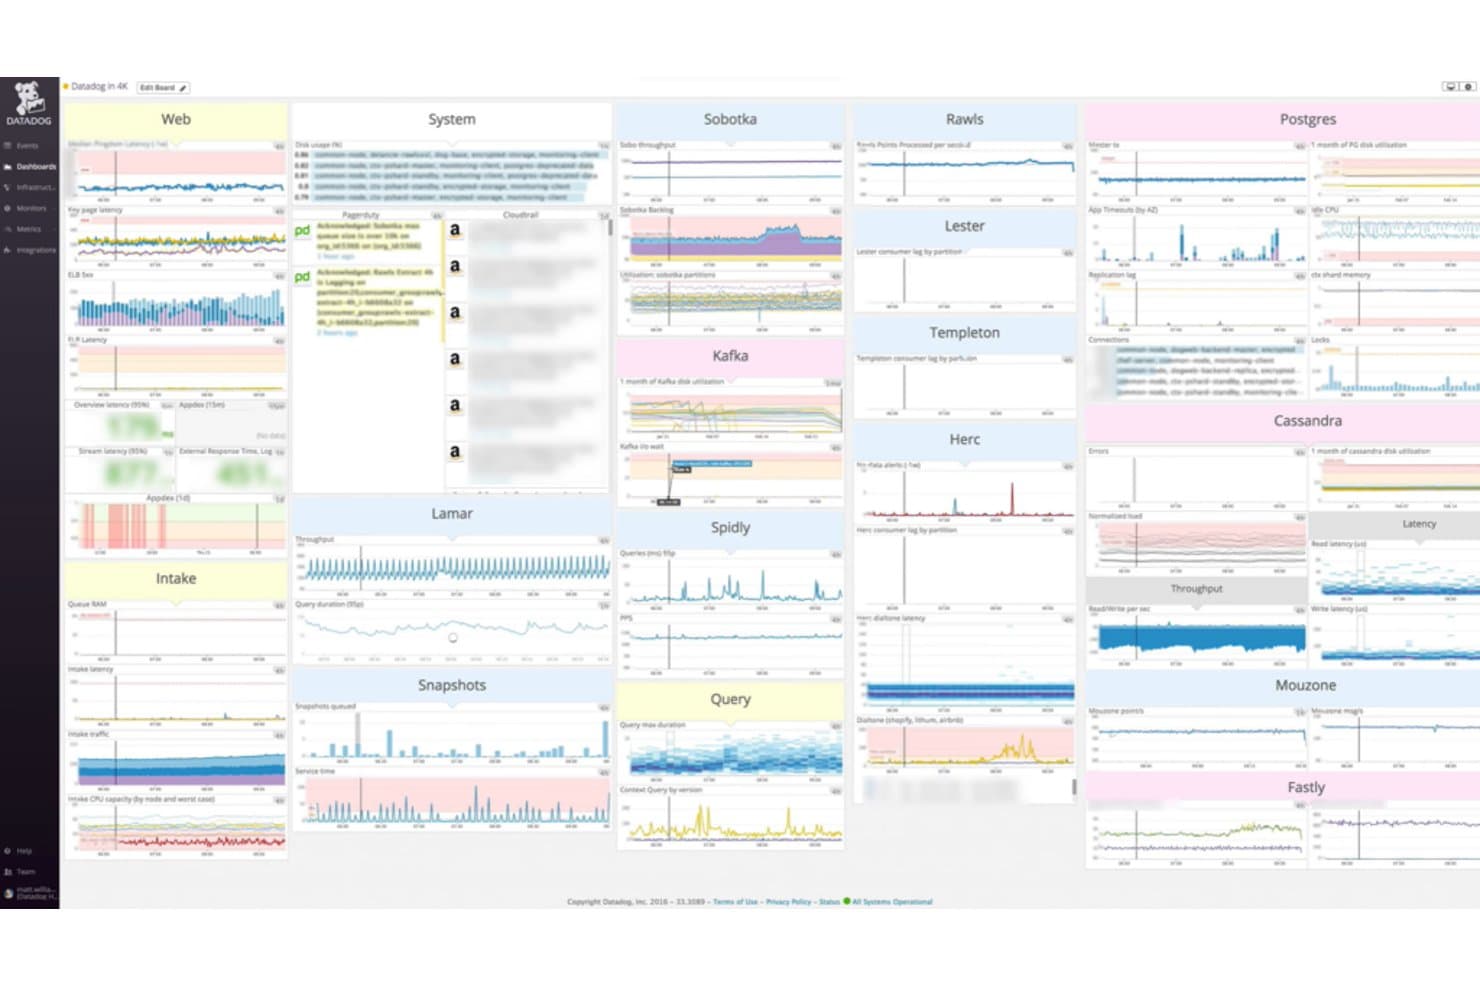
Datadog centralizes metrics across web, system, and database services in one dashboard. Datadog is an observability platform for IT and engineering teams that need to investigate application issues, trace service dependencies, and monitor infrastructure across complex environments.
Who Is Datadog Best For?
Datadog suits IT operations, platform engineering, and SRE teams that need to monitor distributed infrastructure and applications.
Why I Picked Datadog
I picked Datadog because it’s Best for unified monitoring across servers, apps, and services. Its infrastructure metrics, APM traces, and service maps help me follow a slow request from a host to its dependent services, making it a useful Honeycomb alternative for cross-layer incident investigations.
Datadog Key Features
- Log management: Search, filter, and analyze logs from applications and infrastructure.
- Synthetic monitoring: Run browser and API tests to check availability and response times.
- Monitors: Set conditions that trigger alerts when monitored data meets a threshold.
- Dashboards: Build visual displays with graphs and widgets for selected data.
Datadog Integrations
Datadog offers 1,000+ built-in integrations, including AWS, Azure, Google Cloud, Kubernetes, Docker, Jenkins, Slack, Jira, GitHub, and PagerDuty. It also provides an API for custom integrations.
Pros and Cons
Pros:
- Dashboards unite infrastructure and application signals
- Service maps connect hosts to dependent services
- Correlates logs, metrics, and traces during triage
Cons:
- OpenTelemetry handling can be inconsistent
- Alert tuning can produce noisy notifications
 Best for end-to-end business transaction tracing
- 30-day free trial
- From $6/vCPU/month (billed annually)
Visit WebsiteCustomer Rating:4.3/5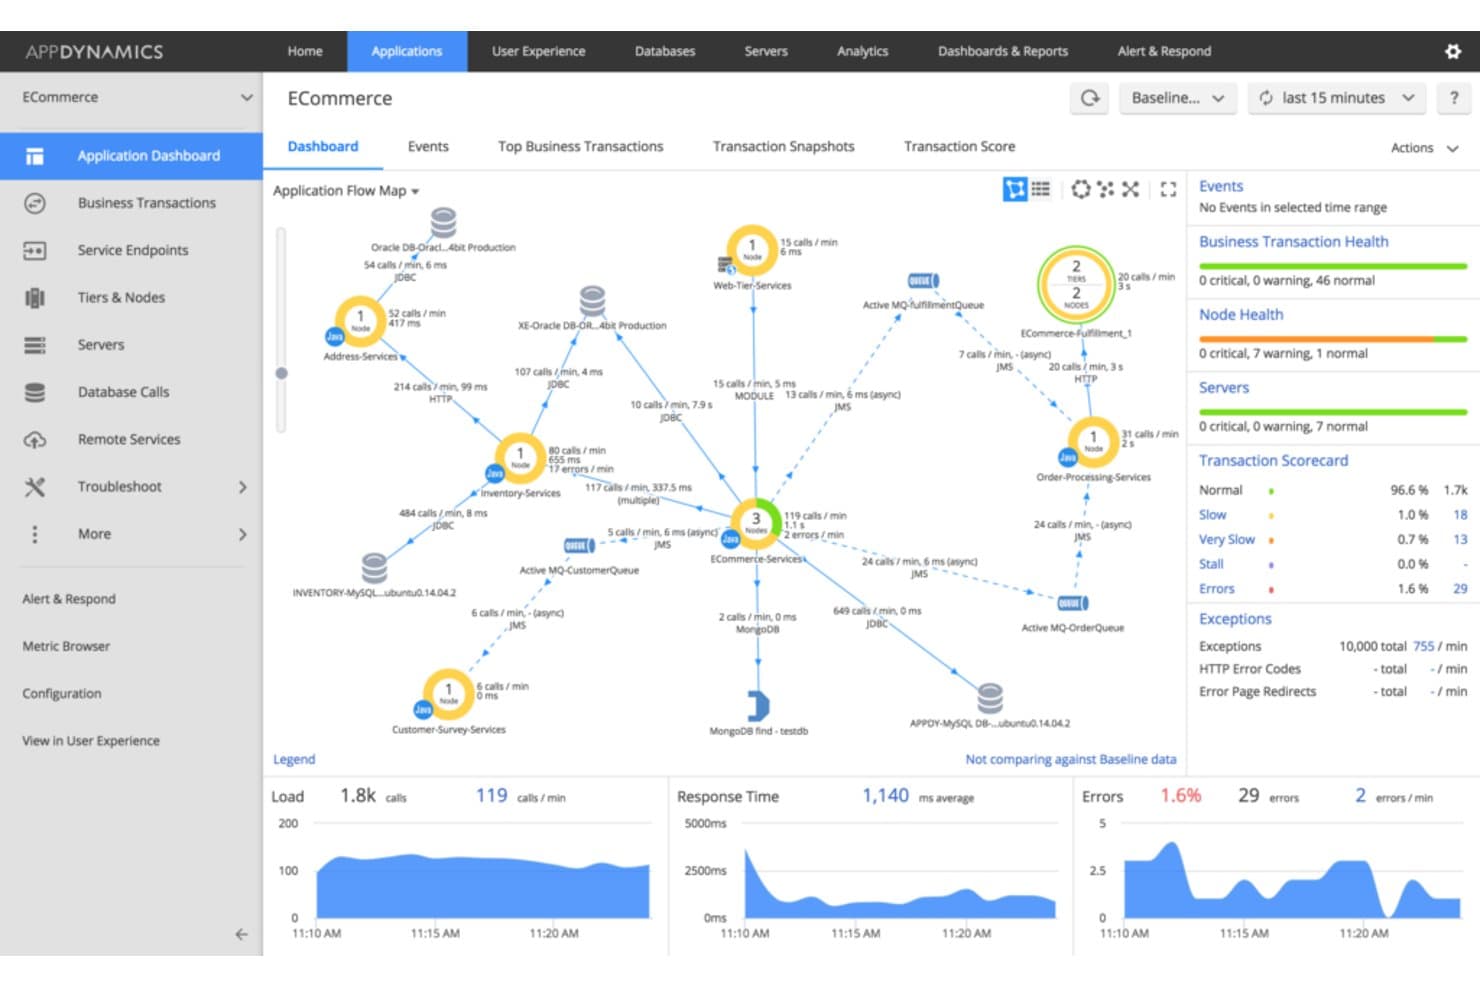
AppDynamics visualizes app service dependencies and performance in real time. AppDynamics is an observability platform for IT and application teams managing complex systems, helping them pinpoint performance problems and connect infrastructure issues with application reliability and user experience.
Who Is AppDynamics Best For?
AppDynamics suits application performance and operations teams managing distributed, multi-tier applications across complex environments.
Why I Picked AppDynamics
I picked AppDynamics for end-to-end business transaction tracing in complex environments. Its transaction flow maps show how requests move across application tiers, while transaction snapshots capture code-level details when a request slows or fails. I use that view to trace a checkout delay from the user-facing service to the backend tier causing it.
AppDynamics Key Features
- Infrastructure monitoring: Correlates infrastructure metrics with application services and business metrics.
- Digital experience monitoring: Tracks web and mobile users and runs synthetic checks across browsers, APIs, and third-party services.
- Runtime application security: Detects vulnerabilities and blocks attacks.
- SAP monitoring: Monitors hybrid and on-premises SAP systems, with tracing to ABAP code or database queries.
AppDynamics Integrations
AppDynamics supports alert integrations with PagerDuty, Slack, ServiceNow through Service Graph Connector, Jira, BigPanda, Moogsoft, and Splunk ITSI; PagerDuty’s integration is vendor-built, while Slack’s is community-built. AppDynamics also provides REST APIs and prebuilt extensions for custom integrations.
Pros and Cons
Pros:
- Links transaction health to business outcomes
- Snapshots expose slow methods and code lines
- Maps business transactions across application tiers
Cons:
- Custom queries require learning AppDynamics’ query language
- Configuration effort grows with custom application hierarchies
Learn more about AppDynamics: Best for application performance insights and end-user experience tracking
- Free plan available
- From $10/user/month
Visit WebsiteCustomer Rating:4.3/5
New Relic SQL overview dashboard. New Relic specializes in providing deep-dive insights into application performance and user experience tracking. This tool does an outstanding job of helping teams understand user interactions and application behavior in a detailed, granular manner.
Pros and Cons
Pros:
- AIOps capabilities for predictive alerts and incident response
- Broad integrations with major cloud providers and platforms
- Detailed application performance monitoring and user experience tracking
Cons:
- The vast array of features may be overwhelming for new users
- Can be complex to set up and configure
- Higher-end pricing compared to some competitors
Learn more about New Relic: Best for cloud-native log management and analytics
- 14-day free trial
- Pricing upon request
Visit WebsiteCustomer Rating:4.3/5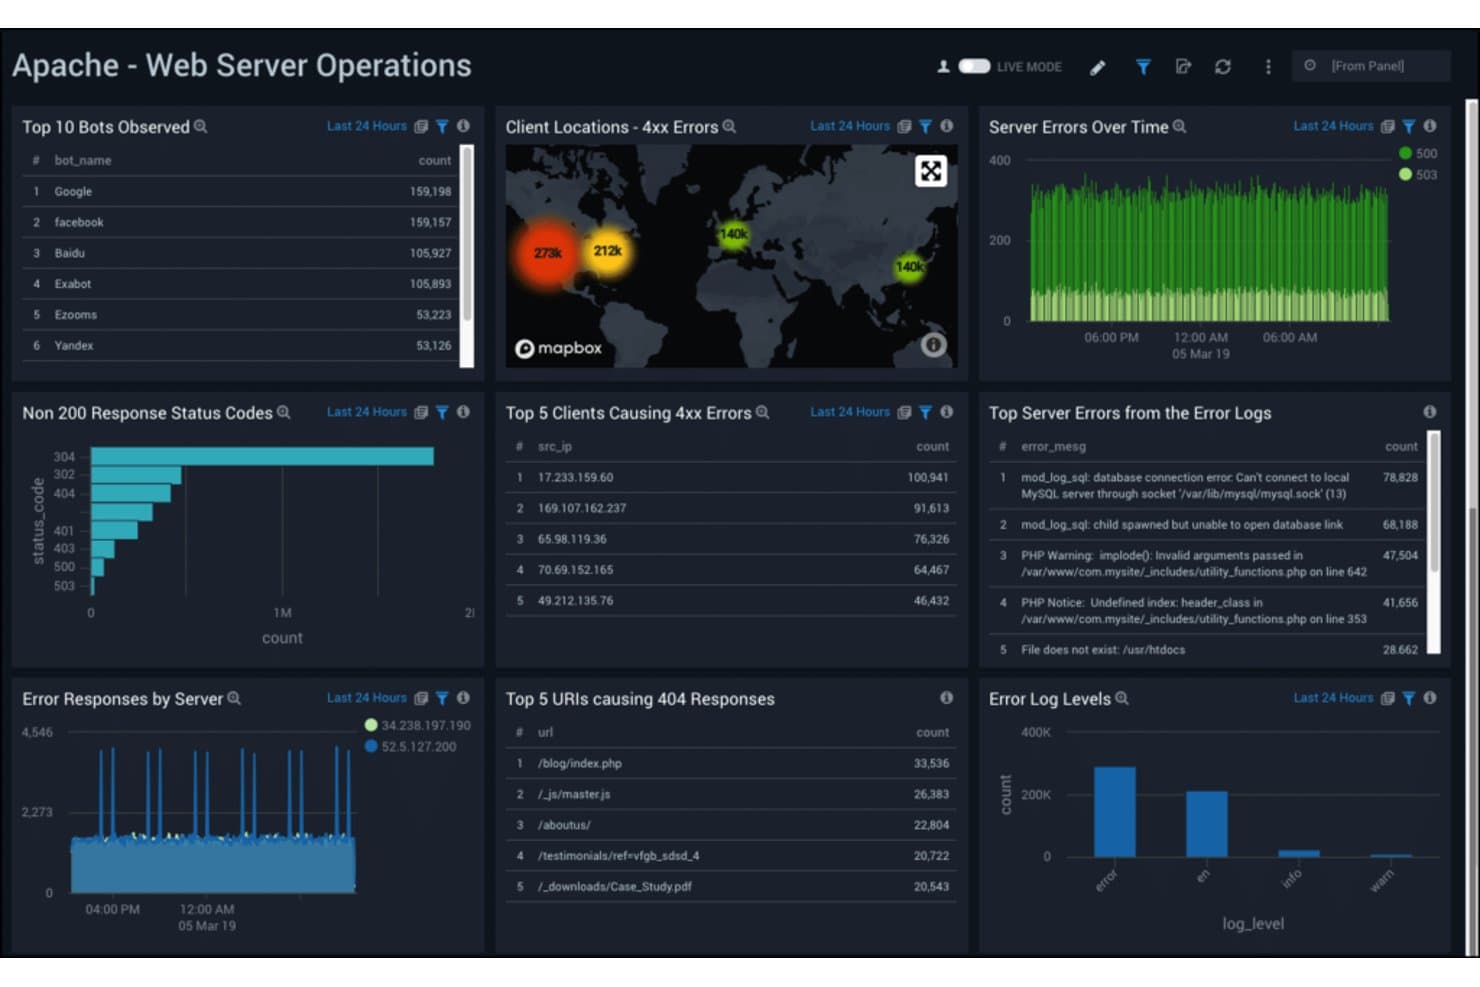
Sumo Logic monitors Apache web server errors and bot activity in real time. Sumo Logic gives IT and DevOps teams an observability platform to investigate outages, connect issues across distributed services, and gain visibility into complex cloud environments.
Who Is Sumo Logic Best For?
Infrastructure and security teams in cloud-native organizations can use Sumo Logic to analyze logs across distributed services.
Why I Picked Sumo Logic
I picked Sumo Logic as a Honeycomb alternative because it’s Best for cloud-native log management and analytics. LogReduce groups similar log messages to help me spot recurring errors, while its search query language lets me investigate an incident across distributed services.
Sumo Logic Key Features
- Metrics analytics: Ingest and query time-series metrics alongside operational telemetry.
- Distributed tracing: Follow requests across services to inspect spans and trace details.
- Dashboards: Build visual dashboards with charts and panels for operational data.
- Monitors and alerts: Set conditions on metrics or query results to trigger notifications.
Sumo Logic Integrations
Sumo Logic’s catalog covers hundreds of vendors and products, with apps, collectors, Cloud SIEM content, and automation integrations for tools including AWS, Azure, Kubernetes, Datadog, GitHub, GitLab, and Atlassian Jira. It also provides APIs for custom integrations.
Pros and Cons
Pros:
- Logs, metrics, and traces share investigations
- Search parses JSON and regex data
- LogReduce groups similar errors quickly
Cons:
- Historical searches can slow at scale
- Sumo query syntax takes practice
 Best for volume-based log monitoring and alerting
- 30-day free trial
- Pricing upon request
Visit WebsiteCustomer Rating:4.4/5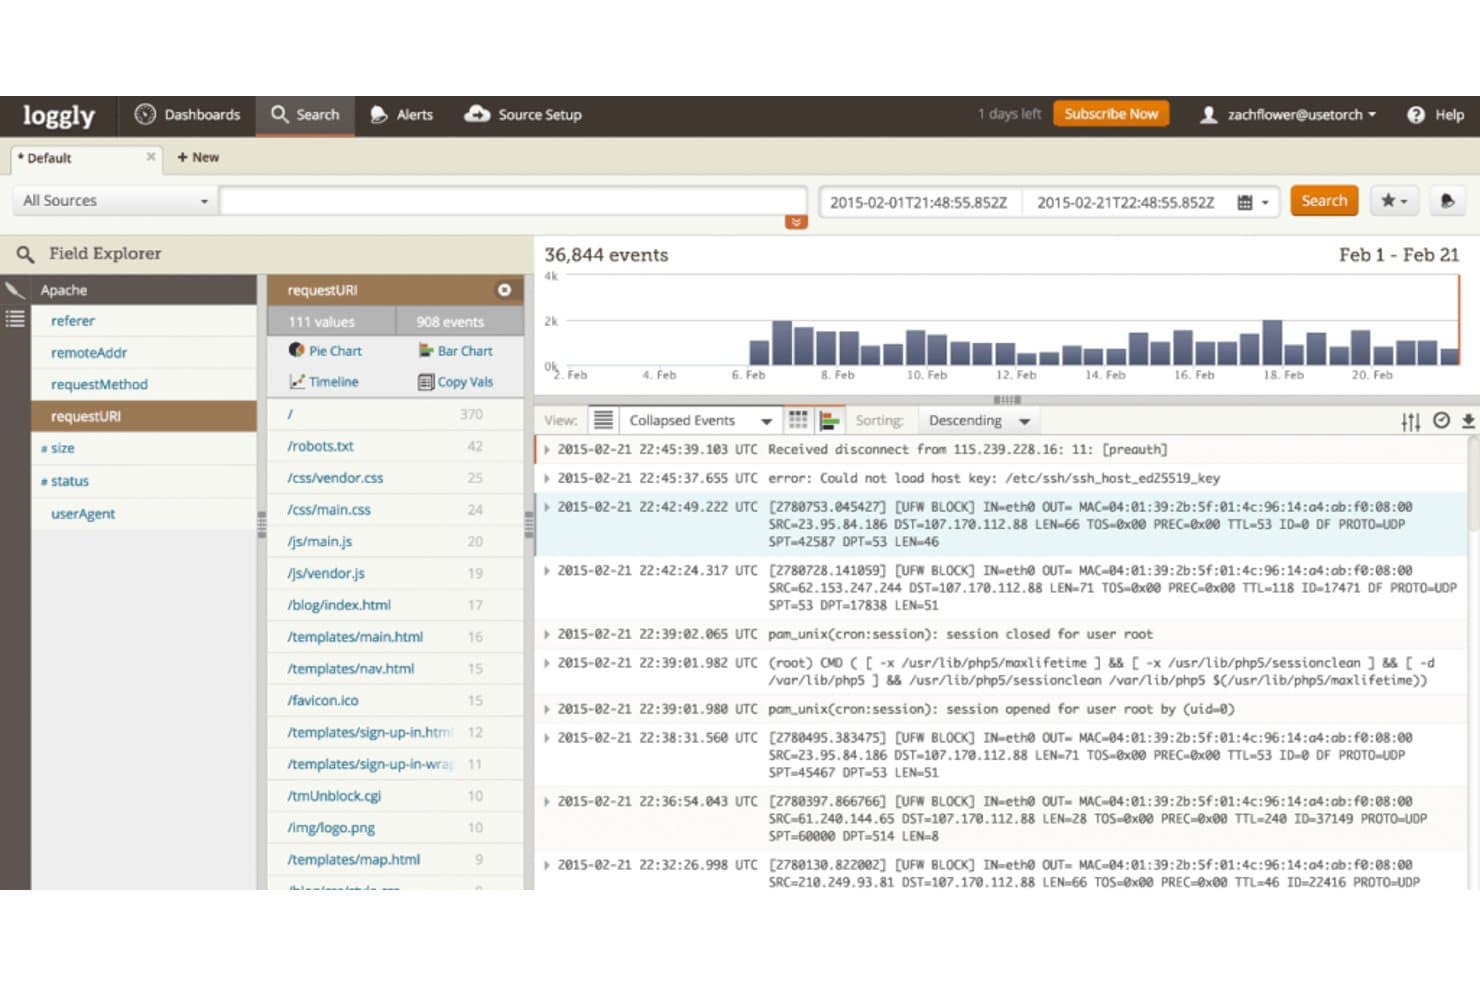
Loggly centralizes log events for real-time search and analysis. Loggly is a cloud-based log management platform for IT and DevOps teams that need to investigate application and infrastructure issues, trace events across services, and diagnose service disruptions.
Who Is Loggly Best For?
Loggly suits IT and DevOps teams that need to search and visualize log data across growing cloud-based environments.
Why I Picked Loggly
I picked Loggly as a Honeycomb alternative because it’s Best for scalable cloud-based log management and interactive data visualization. Its charts and dashboards help me spot trends across application and infrastructure logs. I also value its troubleshooting tools, which help trace issues to root causes across interconnected services.
Loggly Key Features
- Live Tail: Stream incoming log events from multiple sources in near real time.
- Search-based alerts: Set conditions on searches and send notifications to email or supported endpoints.
- Team tool integrations: Connect Loggly with Slack, GitHub, Jira, PagerDuty, Microsoft Teams, and webhooks.
- Log source support: Collect logs from sources such as AWS, syslog, PHP, network devices, and Windows systems.
Loggly Integrations
Loggly lists integrations with Slack, GitHub, Jira, PagerDuty, and Microsoft Teams, with alert delivery also available through custom webhooks. It provides an API for custom integrations.
Pros and Cons
Pros:
- Interactive charts reveal log trends
- Live tail streams events across multiple sources
- Centralized cross-service log search and dashboards
Cons:
- Log propagation delays can hinder incident triage
- SaaS-only deployment excludes on-premises requirements
Learn more about Loggly: Best for machine data-driven operational intelligence
- 60-day free trial
- Pricing upon request
Visit WebsiteCustomer Rating:4.3/5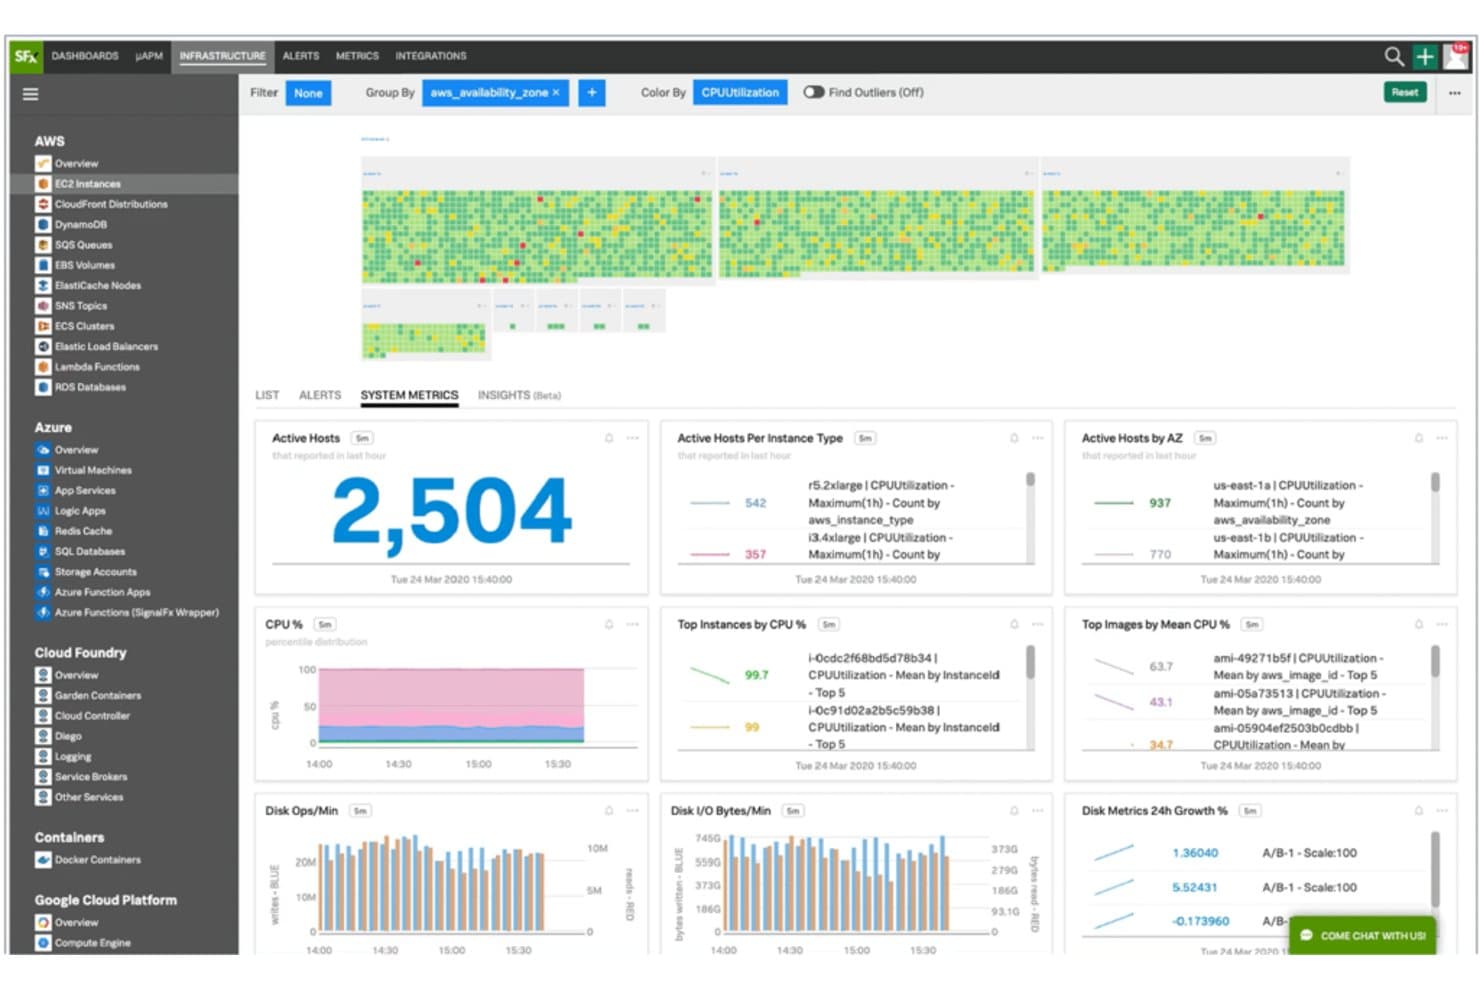
Splunk monitors AWS, Azure, and cloud infrastructure metrics in real time. Splunk is an observability platform for IT and security teams that need to investigate machine data across complex environments, identify service issues, and resolve incidents.
Who Is Splunk Best For?
IT operations teams overseeing distributed infrastructure can use Splunk to turn machine data into actionable operational intelligence.
Why I Picked Splunk
I picked Splunk as a Honeycomb alternative for “Best for leveraging machine data for deep operational intelligence.” I use SPL searches to investigate logs across distributed services, then connect findings in dashboards to trace issues such as rising errors after a deployment. That broader machine-data view helps me examine operational problems alongside related infrastructure and security events.
Splunk Key Features
- Distributed tracing: Follow requests across services through trace spans and service maps.
- Infrastructure monitoring: Track metrics from hosts, containers, and Kubernetes environments.
- Real user monitoring: Capture browser performance and user interactions.
- Synthetic monitoring: Run scripted tests to check service availability and response times.
Splunk Integrations
Splunk Observability Cloud offers hundreds of prepackaged integrations, including AWS, Microsoft Azure, Google Cloud, Kubernetes, Prometheus, Jira, Microsoft Teams, PagerDuty, ServiceNow, and Slack. Splunkbase offers 1,000+ marketplace apps and add-ons, and Splunk provides APIs for custom integrations.
Pros and Cons
Pros:
- Custom dashboards speed troubleshooting
- Analyzes traces without sampling
- Correlates logs, metrics, and traces
Cons:
- Costs rise with larger data volumes
- Heavy queries can run slowly
Learn more about Splunk: Best for Kubernetes-native metrics and alerting
- Free plan available
- Pricing upon request
Visit WebsiteCustomer Rating:4.4/5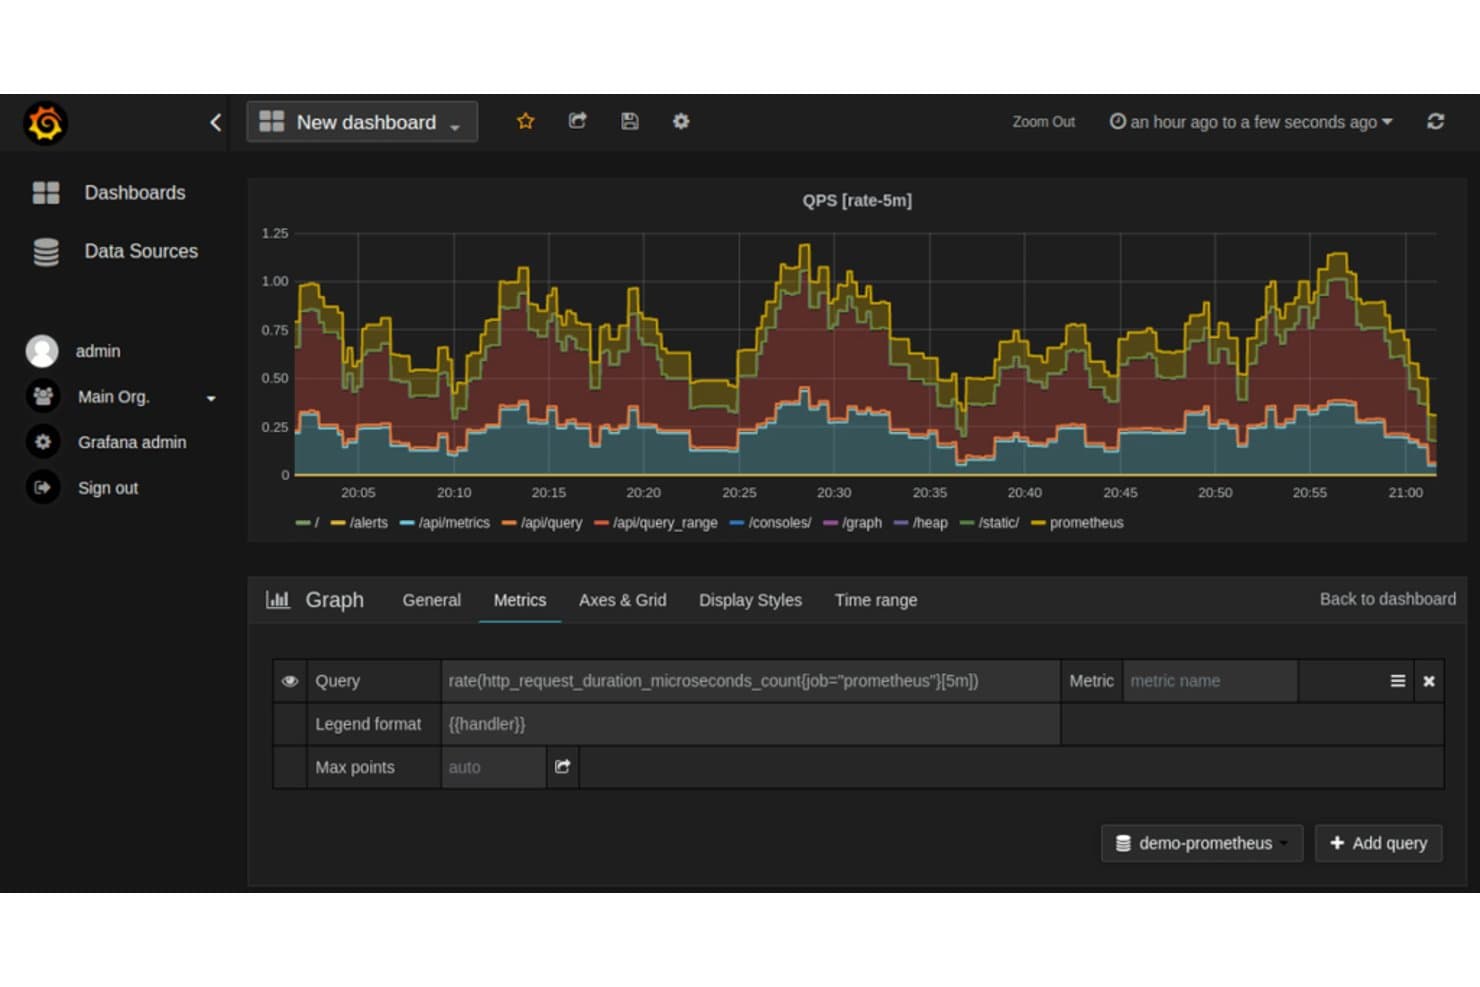
Prometheus visualizes HTTP request rates across API endpoints in Grafana. Prometheus is an open-source monitoring platform for infrastructure and application teams that need to track system health, investigate performance issues, and build observability into their services.
Who Is Prometheus Best For?
Prometheus suits DevOps and site reliability teams that need to collect metrics and set alerts across Kubernetes workloads.
Why I Picked Prometheus
I picked Prometheus for metric collection and alerting, especially in a Kubernetes environment. Its service discovery can track changing workloads, while PromQL helps me investigate metric patterns and define alert conditions. I use Alertmanager to route those alerts when service health degrades.
Prometheus Key Features
- Time series database: Stores timestamped samples in a local database.
- Multidimensional data model: Organizes time series with metric names and key-value labels.
- Exporter ecosystem: Exporters expose metrics from systems such as databases and hardware.
- Federation: Scrapes selected metrics from other Prometheus servers for aggregation.
Prometheus Integrations
Prometheus includes Kubernetes service discovery and supports exporter-based integrations with Kafka, MySQL, PostgreSQL, Redis, Jenkins, and AWS CloudWatch. Remote read/write connections include Grafana Mimir, Thanos, Google Cloud, and New Relic, and its HTTP API supports custom integrations.
Pros and Cons
Pros:
- Alertmanager routes metric alerts by labels
- Kubernetes service discovery tracks changing workloads
- PromQL supports label-based metric investigations
Cons:
- Local storage limits retention and horizontal scaling
- High-cardinality labels can strain local storage
Learn more about Prometheus:
Outras alternativas ao Honeycomb
Eis algumas alternativas adicionais ao Honeycomb que não entraram na minha lista, mas que vale a pena conhecer:
- 11Grafana CloudBest for interactive visualization, enabling data-driven decisions
- 12Elastic (ELK Stack)Best for log analysis, search, and powerful data correlation capabilities
- 13WrikeBest for project management within software teams
- 14LightstepGood for distributed tracing for large scale software systems
- 15RaygunGood for diagnosing and resolving software errors and performance issues in one platform
- 16NagiosGood for robust network monitoring and infrastructure analysis
- 17RollbarGood for real-time error alerting and debugging tools in development and production
- 18Stackify RetraceGood for full lifecycle application performance management
- 19InstanaGood for automated application performance management in microservice applications
- 20InfluxDBGood for handling high volume time-series data in real-time
- 21SysdigGood for security and compliance in container and cloud environments
- 22ScalyrGood for real-time log management and server monitoring
- 23SignalFx (Splunk Infrastructure Monitoring)Good for real-time cloud infrastructure and application monitoring
- 24ZipkinGood for distributed tracing system to track latency problems in microservice architectures
Avaliações de outro software
- Ferramentas de desenvolvimento de software
- Ferramentas de infraestrutura como código
- Ferramentas de DataOps
- Ferramentas de monitorização de bases de dados
How I Evaluate Honeycomb Alternatives
I look at every candidate on two layers: the baseline requirements—distributed tracing, high-cardinality querying, and OTel support—and the differentiators that separate tools when SREs debug live production incidents.
Core Functionality (Table Stakes For This List)
When I'm selecting tools for my list, I rank each one on a scale from 0 (does not offer the functionality) to 5 (excels in this area) for each core functionality listed below. Then, I calculate the tool's total score into a percentage. Each tool needs to achieve a minimum total score of 65% to be considered for inclusion.
- Distributed Tracing: I evaluate how well each tool visualizes trace waterfalls across services, since debugging a slow checkout flow spanning 15 microservices demands deep span detail.
- High-Cardinality Querying: Slicing telemetry by user ID or container instance at scale matters, so I check whether query performance holds up across millions of unique values.
- Unified Telemetry Support: I look for tools that correlate logs, metrics, and traces in one view—pivoting from a latency spike to the matching error log should take one click.
- OpenTelemetry Compatibility: Native OTel ingestion across traces, metrics, and logs is what I evaluate here, since teams shouldn't need proprietary agents to get data in.
- Real-Time Alerting & SLOs: Good observability includes SLO burn-rate alerts and error budgets, so I check whether each tool supports more than basic static threshold notifications.
- Interactive Debugging Workflows: I look for exploratory query interfaces—like outlier detection or group-by breakdowns—that help engineers diagnose unknown issues during an incident.
Once I have a list of tools that meet this criteria, I consider what sets each platform apart.
Differentiating Factors (What Sets Vendors Apart)
Here's how I compare and contrast different vendors:
Standout Features
AI-assisted investigation tools can cut hours off an incident by auto-surfacing the likely root cause before an engineer even writes a query. I also evaluate whether a platform offers continuous profiling—tying CPU or memory hotspots directly to a trace helps pinpoint code-level bottlenecks that span-level data alone can miss. Collaborative query workflows matter too, especially for teams running blameless postmortems. Shared investigation trails and annotated boards let the on-call engineer hand off context to the next shift without anything getting lost.
Beyond Features
The pricing model is one of the first things I check. A platform billing per host behaves very differently at scale than one billing per GB ingested, and a traffic spike during a product launch shouldn't blow up your observability budget. I also evaluate how quickly a team can get value—tools with strong auto-instrumentation and clear OTel migration guides dramatically reduce onboarding time. Ecosystem integrations round out the picture. Connecting to PagerDuty, Slack, and your CI/CD pipeline means alerts reach the right people and deploy markers land on your dashboards automatically.
Por que procurar uma alternativa ao Honeycomb?
O Honeycomb é uma ferramenta de observabilidade de vanguarda, concebida para ajudar os engenheiros de software a compreender, depurar e melhorar o software em produção. Destaca-se por fornecer informações ao nível do sistema, facilitando a descoberta de padrões e anomalias e, consequentemente, a otimização do desempenho.
Apesar da sua poderosa funcionalidade, os utilizadores podem procurar alternativas por vários motivos. Estes podem variar desde limitações orçamentais, uma vez que os preços do Honeycomb podem estar fora do alcance de algumas equipas mais pequenas, até requisitos específicos de funcionalidades que o Honeycomb não contempla, como o software tradicional de gestão de registos ou a monitorização aprofundada do desempenho das aplicações.
Por último, alguns utilizadores podem simplesmente preferir uma alternativa de código aberto ou uma com uma interface de utilizador diferente. A procura pela alternativa perfeita ao Honeycomb implica encontrar uma ferramenta que estabeleça um equilíbrio entre uma funcionalidade abrangente e uma experiência de utilizador fluida, adaptando-se simultaneamente às necessidades e aos recursos específicos da organização.
Principais funcionalidades do Honeycomb
Eis algumas das principais funcionalidades do Honeycomb, para ajudar a contrastar e comparar o que as soluções alternativas oferecem:
- Telemetria baseada em eventos: Capta dados detalhados de eventos para que a sua equipa possa ver exatamente o que aconteceu nos seus sistemas em qualquer momento.
- Construtor de consultas: Permite fazer perguntas complexas sobre os seus dados sem precisar de escrever código.
- BubbleUp: Destaca automaticamente os valores atípicos nos seus dados, para que possa identificar os problemas mais rapidamente.
- Suporte para rastreio: Liga os rastreios aos registos e às métricas, para que possa compreender como um único pedido percorre toda a sua infraestrutura.
- Quadros e vistas: Ajuda a guardar, organizar e partilhar as principais consultas ou visualizações que a sua equipa utiliza frequentemente.
- Mapa de serviços: Mostra como os seus serviços interagem, o que é útil para compreender as dependências e o estado do sistema.
- Acompanhamento de SLO: Permite definir e monitorizar objetivos de nível de serviço para acompanhar de perto as metas de desempenho.
- Ferramentas de colaboração em equipa: Permitem comentar consultas, partilhar ligações e trabalhar em conjunto nas investigações.
- Motor de consultas rápido: Responde rapidamente a grandes conjuntos de dados, o que é útil ao depurar problemas em tempo real.
- Integrações com ferramentas como o OpenTelemetry: Facilitam a importação de dados da sua configuração existente.