10 Mejores Herramientas de Perfilado para Impulsar el Rendimiento en 2026

10 Mejores Herramientas de Perfilado - Resumen


Las herramientas de perfilado te ayudan a medir y analizar cómo se desempeña tu software para que puedas detectar cuellos de botella y resolverlos.
Si alguna vez has intentado diagnosticar retrasos, fugas de memoria o picos de CPU revisando solamente los registros, sabes lo frustrante que puede ser. Estas herramientas te dan una visión clara de lo que realmente está sucediendo bajo el capó, para que no tengas que adivinar.
He trabajado con perfiladores de código tanto de código abierto como comerciales en diferentes stacks tecnológicos, así que sé lo que hace útil a uno en escenarios reales. En esta guía, compartiré las herramientas en las que confío y explicaré por qué vale la pena considerarlas.
Por qué confiar en nuestras reseñas de software
Llevamos probando y revisando software desde 2023. Como líderes tecnológicos, sabemos lo crítico y difícil que es tomar la decisión correcta al seleccionar software.
Invertimos en una investigación profunda para ayudar a nuestra audiencia a tomar mejores decisiones de compra de software. Hemos probado más de 2,000 herramientas para diferentes casos de uso tecnológicos y escrito más de 1,000 reseñas de software exhaustivas. Descubre cómo mantenemos la transparencia y nuestra metodología de revisión de software.
Resumen de las Mejores Herramientas de Perfilado
| Tool | Best For | Trial Info | Price | ||
|---|---|---|---|---|---|
| 1 | Mejor para obtener información detallada sobre el rendimiento | Plan gratuito + prueba gratuita + demo gratuita disponible | Desde $26/mes (facturado anualmente) | Website | |
| 2 | Ideal para el monitoreo del rendimiento de aplicaciones | Prueba gratuita de 14 días | Desde $15/usuario/mes (facturado anualmente). | Website | |
| 3 | La mejor para la visualización de pilas de llamadas en Python | Not available | Precio bajo consulta. | Website | |
| 4 | Ideal para utilidades de perfilado por muestreo en Python | Not available | Como py-spy es una herramienta de código abierto, sus funciones principales son gratuitas. | Website | |
| 5 | Mejor opción para monitorización de rendimiento con seguimiento de errores | Not available | Desde $26/usuario/mes (facturado anualmente). | Website | |
| 6 | Ideal para la depuración y desarrollo de PHP | Not available | Precios bajo solicitud. | Website | |
| 7 | Mejor para el rastreo de código en vivo en estaciones de trabajo de desarrollo | Not available | Precio a consultar. | Website | |
| 8 | La mejor para el perfilado continuo en tiempo real | Not available | Precios bajo consulta. | Website | |
| 9 | Ideal para visualizar operaciones asíncronas en Node.js | Not available | Precio bajo consulta. | Website | |
| 10 | Ideal para desarrollo de videojuegos y aplicaciones gráficas | Not available | Precios bajo consulta. | Website |
-

TestDevLab
Visit Website -
Site24x7
Visit WebsiteThis is an aggregated rating for this tool including ratings from Crozdesk users and ratings from other sites.4.7 -
GitHub Actions
Visit WebsiteThis is an aggregated rating for this tool including ratings from Crozdesk users and ratings from other sites.4.8


Reseñas de las Mejores Herramientas de Perfilado

Para los desarrolladores que buscan una solución confiable para mejorar el rendimiento de las aplicaciones, Sentry ofrece un enfoque integrado para el monitoreo de errores y el perfilado. Está dirigido a desarrolladores web y móviles, proporcionando herramientas para descubrir cuellos de botella en el rendimiento y agilizar el proceso de depuración. Al abordar desafíos como el seguimiento de errores y la obtención de información sobre el rendimiento, Sentry garantiza una experiencia de desarrollo más fluida.
Por qué elegí Sentry
Elegí Sentry por su capacidad única para ofrecer información detallada sobre el rendimiento gracias a su función de perfilado. Al capturar llamadas a funciones y tiempos de ejecución, Sentry te permite identificar y abordar problemas de rendimiento sin necesidad de instrumentación personalizada. La integración fluida de la herramienta con GitHub y Slack respalda aún más tu flujo de trabajo de desarrollo al proporcionar contexto para las correcciones y facilitar una colaboración más eficiente. Esto convierte a Sentry en una opción ideal para equipos que buscan optimizar el rendimiento de la aplicación y reducir el tiempo de depuración.
Características clave de Sentry
Además de sus capacidades de perfilado, Sentry ofrece varias funciones que mejoran su utilidad como herramienta de perfilado:
- Monitoreo de errores: Captura automáticamente los errores en tu aplicación, proporcionando informes detallados para ayudarte a depurar problemas de manera eficiente.
- Reproducción de sesión: Te permite ver las sesiones de los usuarios para entender el contexto de los errores y mejorar la experiencia del usuario.
- Depurador AI (Seer): Analiza registros y trazas para identificar la causa raíz de las fallas, ofreciendo sugerencias impulsadas por IA para las correcciones.
- Rastreo: Proporciona información sobre peticiones lentas y cuellos de botella en el rendimiento, ayudándote a optimizar la velocidad de tu aplicación.
Integraciones de Sentry
Las integraciones incluyen GitHub, Slack, Jira, GitLab, Bitbucket, Trello, Azure DevOps, Vercel y AWS Lambda.
Pros and Cons
Pros:
- La IA señala problemas en las solicitudes de extracción
- Generación automática de pruebas unitarias
- Monitoreo de errores en producción en tiempo real
Cons:
- La configuración inicial puede ser compleja
- Las sugerencias de IA pueden necesitar revisión
New Product Updates from Sentry

Sentry Adds Heatmaps to Application Metrics
Sentry introduced heatmaps for Application Metrics to visualize metric value distributions over time, helping teams spot patterns like latency bursts and use heatmaps in Custom Dashboards. For more information, visit Sentry's official site.
 .
.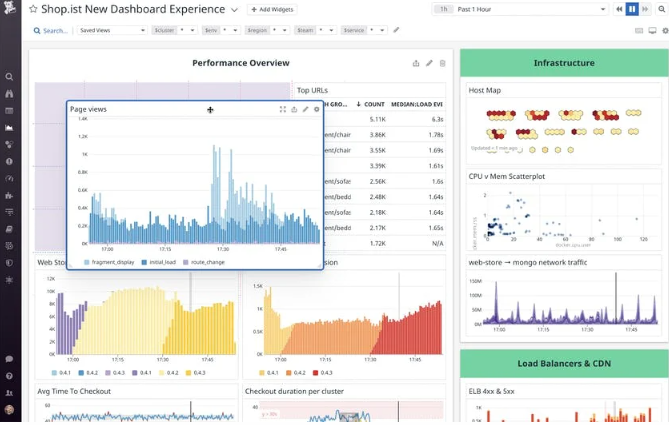
Datadog es una sólida plataforma de monitorización a escala en la nube que centraliza datos de aplicaciones, infraestructura y registros. Especialmente diseñada para entornos modernos en la nube, proporciona análisis detallados sobre el rendimiento de las aplicaciones, asegurando un tiempo de actividad óptimo y una rápida detección de incidencias.
Por qué elegí Datadog: Elegí Datadog influido por su enfoque integral hacia la monitorización del rendimiento. Comparado con otras herramientas, Datadog demostró constantemente su capacidad para aportar análisis profundos sin sacrificar la facilidad de uso. Considero que, para empresas que priorizan el monitoreo del rendimiento de sus aplicaciones, Datadog es indudablemente un líder.
Funciones destacadas e integraciones:
Datadog destaca gracias a funciones como paneles en tiempo real, detección de anomalías y valores atípicos, y rastreo de solicitudes de extremo a extremo. Sus potentes herramientas de visualización enriquecen sus capacidades de monitorización. En cuanto a integraciones, Datadog presume de compatibilidad con diversas plataformas, entre ellas AWS, Docker, Slack y muchas más, facilitando una experiencia de monitoreo integral.
Pros and Cons
Pros:
- Monitorización integral en aplicaciones, infraestructura y registros
- Amplia variedad de integraciones con plataformas populares
- Eficiente sistema de detección de anomalías y alertas
Cons:
- Puede suponer una curva de aprendizaje para los nuevos usuarios
- Algunas funciones avanzadas tienen un coste adicional
- La configuración inicial puede llevar tiempo en infraestructuras complejas.
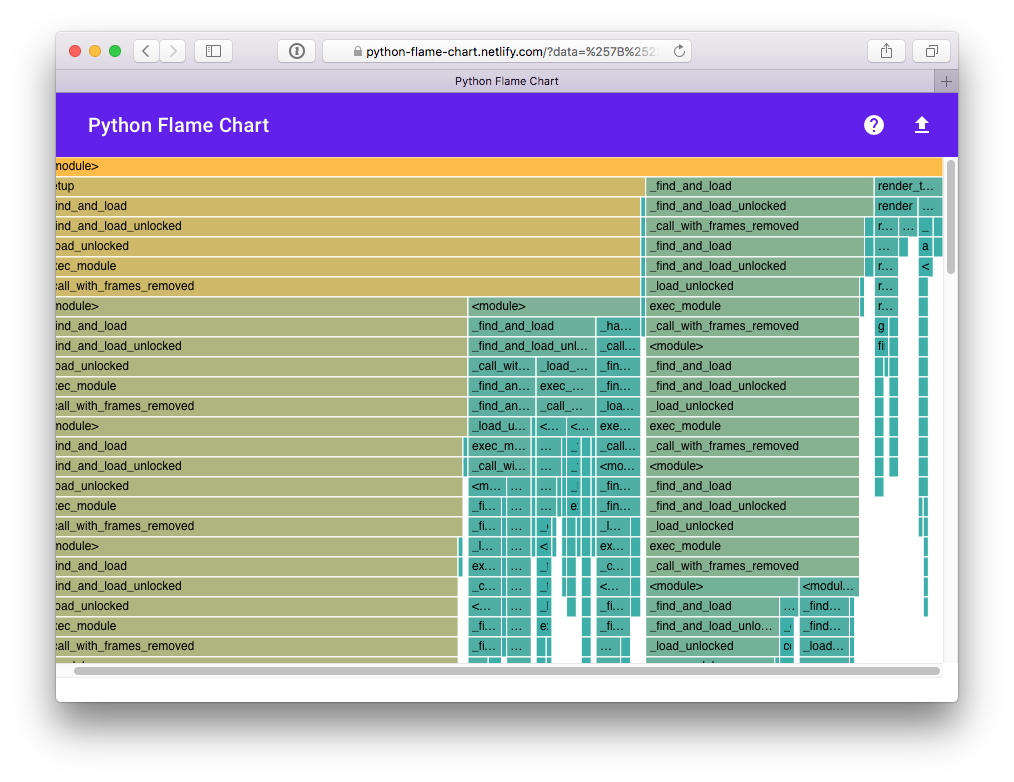
Pyinstrument es un perfilador de Python diseñado para proporcionar a los desarrolladores una visualización clara y detallada de la pila de llamadas de su programa. Con su capacidad para representar jerarquías de llamadas complejas de forma visual, es evidente que sobresale en la visualización de pilas de llamadas en Python.
Por qué elegí Pyinstrument: Elegí Pyinstrument tras compararlo exhaustivamente con otras herramientas de su categoría. Su habilidad única para articular visualmente jerarquías de llamadas complejas llamó mi atención. Lo consideré superior al presentar pilas de llamadas de Python, reafirmando mi opinión de que es la mejor herramienta para visualizar estructuras de llamada en Python.
Funciones destacadas e integraciones:
Pyinstrument ofrece una interfaz de usuario rica para la visualización de la pila de llamadas, ayudando en los esfuerzos de inteligencia empresarial. Sus paneles brindan a los desarrolladores una visión completa del comportamiento de su código. Además de sus funciones principales, Pyinstrument se integra bien con herramientas de limpieza y emparejamiento de datos, aumentando su versatilidad para proyectos orientados a datos.
Pros and Cons
Pros:
- Visualización detallada de la pila de llamadas que mejora los procesos de inteligencia empresarial
- Paneles de control completos que ofrecen una visión global del rendimiento del código
- Integraciones efectivas con herramientas de limpieza y emparejamiento de datos
Cons:
- Puede que no sea adecuada para el perfilado en tiempo real
- Requiere configuración manual para ciertas funciones avanzadas
- Soporte limitado para lenguajes que no sean Python

py-spy es una herramienta diseñada para realizar perfilado de aplicaciones Python mediante el muestreo de su ejecución. Se destaca como un recurso para los desarrolladores que buscan un análisis detallado de la memoria sin alterar el funcionamiento normal de sus aplicaciones Python.
Por qué elegí py-spy: Al analizar las mejores herramientas para el perfilado en Python, py-spy fue mi elección natural. Lo que llamó mi atención fue su enfoque no intrusivo en el perfilado de memoria y su capacidad para extraer metadatos de manera eficiente. En comparación con otras herramientas, era evidente que py-spy sobresalía por sus capacidades, consolidando su posición como la mejor utilidad de perfilado por muestreo para Python.
Características destacadas e integraciones:
Una de las cualidades principales de py-spy es su habilidad para realizar perfilado de memoria sin requerir modificaciones en el código ni reiniciar la aplicación. La herramienta también es experta en capturar metadatos enriquecidos a partir de las muestras, lo que aumenta la profundidad de los conocimientos obtenidos. Aunque py-spy se centra principalmente en Python, también son destacables sus integraciones con datos de código abierto, que ofrecen flexibilidad y transparencia.
Pros and Cons
Pros:
- Permite el perfilado de memoria sin ser intrusivo
- Captura eficazmente y proporciona metadatos valiosos
- Aprovechando datos de código abierto, garantiza transparencia y mejoras respaldadas por la comunidad
Cons:
- Algunas funciones avanzadas pueden requerir una curva de aprendizaje pronunciada para principiantes
- Al estar específicamente diseñada para Python, su versatilidad en múltiples lenguajes es limitada
- Carece de un sistema de soporte dedicado, dependiendo principalmente de la asistencia de la comunidad.
Mejor opción para monitorización de rendimiento con seguimiento de errores

Sentry Profiling es una herramienta diseñada para ayudar a los desarrolladores a supervisar el rendimiento de las aplicaciones mientras rastrean errores al mismo tiempo. Esta combinación ayuda a los desarrolladores a identificar cuellos de botella en el código fuente, asegurando así una experiencia de usuario fluida.
Por qué elegí Sentry Profiling: En el vasto mar de herramientas de perfiles, Sentry Profiling llamó mi atención. Mi decisión se basó en su capacidad dual de ofrecer monitoreo de rendimiento mientras vigila los errores. Después de compararla con otras herramientas, Sentry Profiling es realmente la mejor opción para quienes priorizan el monitoreo de rendimiento combinado con el seguimiento de errores.
Características destacadas e integraciones:
Una de las características principales de Sentry Profiling es su análisis profundo del código fuente, lo que permite una solución de problemas eficiente. Además, su mecanismo integrado de seguimiento de errores garantiza que los desarrolladores detecten anomalías antes de que afecten la experiencia del usuario. En cuanto a integraciones, Sentry se integra con muchas plataformas, incluyendo GitHub, Slack y Jira, asegurando a los desarrolladores un ecosistema cohesionado.
Pros and Cons
Pros:
- Perspectivas completas sobre el código fuente para una solución de problemas eficiente
- Capacidades duales: monitorización de rendimiento y seguimiento de errores
- Amplia gama de integraciones que mejoran la utilidad de la herramienta
Cons:
- Puede ser demasiado complejo para proyectos pequeños o principiantes
- La facturación anual podría no ser preferida por todos los usuarios
- Algunos usuarios reportan una curva de aprendizaje más pronunciada en comparación con otras herramientas de perfiles.

Xdebug, diseñado específicamente para PHP, es una herramienta esencial con capacidades detalladas de depuración. Abordar los retos enfrentados durante el desarrollo en PHP consolida su posición como la opción principal para quienes requieren una solución de depuración y desarrollo específica para PHP.
Por qué elegí Xdebug: Al seleccionar herramientas para depurar PHP, Xdebug destacó constantemente como uno de los favoritos en mis evaluaciones. Su precisión para identificar problemas de rendimiento y su inigualable profundidad en el entorno de ejecución PHP lo diferencian. Reconocí estas cualidades y determiné con confianza que Xdebug es el mejor para depuración y desarrollo en PHP.
Características destacadas e integraciones:
Xdebug sobresale por su capacidad para identificar rápidamente problemas de rendimiento, permitiendo que los desarrolladores los corrijan de manera eficaz. Sus funcionalidades ofrecen información sobre la asignación en tiempo de ejecución, asegurando el uso eficiente de los recursos. Además, su compatibilidad con numerosos plugins garantiza una experiencia de desarrollo más fluida e integrada.
Pros and Cons
Pros:
- Identifica con precisión problemas de rendimiento en aplicaciones PHP
- Detalles exhaustivos sobre la asignación en tiempo de ejecución
- Integración con múltiples plugins
Cons:
- Curva de aprendizaje más pronunciada para principiantes
- Puede introducir sobrecarga al ejecutarse en servidores de producción
- La configuración puede ser intrincada para aplicaciones complejas
Prefix
Mejor para el rastreo de código en vivo en estaciones de trabajo de desarrollo

Prefix proporciona a los desarrolladores una ventana clara al comportamiento de su código en tiempo real. Específicamente adaptado para estaciones de trabajo de desarrollo, ofrece capacidades de rastreo de código en vivo, lo que lo convierte en una herramienta invaluable para quienes desean una perspectiva en tiempo real sobre el rendimiento de su código, alineándose perfectamente con su declaración de 'mejor uso'.
Por qué elegí Prefix: Prefix destacó entre la multitud de herramientas que he revisado. Su enfoque único en el rastreo de código en vivo, especialmente diseñado para entornos de desarrollo, llamó mi atención. Permite a los desarrolladores rastrear el código en vivo en sus estaciones de trabajo, por lo que lo consideré el mejor para este caso de uso específico.
Características y integraciones destacadas:
El punto fuerte de Prefix es su función de perfilado de código en vivo, que ofrece retroalimentación inmediata sobre el comportamiento del código. Sus capacidades de análisis de grandes volúmenes de datos también ayudan a los desarrolladores a comprender grandes conjuntos de datos en tiempo real. En cuanto a integraciones, Prefix se adapta a muchos flujos de trabajo de automatización, atendiendo a las necesidades de los ciclos de desarrollo modernos.
Pros and Cons
Pros:
- Rastreo de código en vivo directamente en estaciones de trabajo de desarrollo
- Potentes capacidades de análisis de grandes volúmenes de datos
- Integración eficiente con varias plataformas de automatización
Cons:
- Puede ser menos adecuado para la monitorización de entornos de producción
- Requiere cierto nivel de familiaridad con el perfilado de código para aprovechar todo su potencial
- No tan completo en funciones como algunas herramientas de perfilado dedicadas

Pyroscope es una herramienta dinámica diseñada para proporcionar un perfilado continuo de aplicaciones en tiempo real. Su punto fuerte es ofrecer perspectivas inigualables sobre el comportamiento de una aplicación, lo que la convierte en una de las principales opciones para desarrolladores interesados en información de rendimiento en tiempo real.
Por qué elegí Pyroscope: Pyroscope se destacó como pionero en mi búsqueda de una solución eficiente para el perfilado continuo. La elegí por su alto rendimiento y su destreza para capturar métricas de rendimiento detalladas. Su especialidad en proporcionar información en tiempo real sobre el perfil de las aplicaciones la diferencia y subraya por qué es la mejor herramienta para el perfilado continuo en tiempo real.
Características destacadas & integraciones:
La instrumentación de alto rendimiento de Pyroscope permite a los desarrolladores mantener el pulso sobre sus aplicaciones. Está especialmente diseñada para detectar fugas de memoria, que a menudo pasan desapercibidas pero pueden ser perjudiciales para el rendimiento de la aplicación. Además, Pyroscope ofrece integraciones con lenguajes de programación y plataformas populares, atendiendo a un amplio espectro de desarrolladores.
Pros and Cons
Pros:
- Ofrece alto rendimiento, asegurando datos precisos en tiempo real
- Las capacidades de instrumentación permiten un examen profundo de las aplicaciones
- Eficaz en detectar y resolver fugas de memoria
Cons:
- Puede requerir una configuración inicial para adaptarse a aplicaciones específicas
- La interfaz de usuario puede ser compleja para principiantes
- Soporte limitado para algunos lenguajes o plataformas de nicho.

Bubbleprof es una herramienta de vanguardia diseñada para desarrolladores de Node.js, que ofrece una perspectiva única sobre las operaciones asíncronas. Al proporcionar visualizaciones claras de flujos de trabajo asíncronos complejos, queda claro que Bubbleprof destaca como la opción principal para desmitificar las operaciones asíncronas de Node.js.
Por qué elegí Bubbleprof: Elegí Bubbleprof tras una evaluación exhaustiva de herramientas de depuración diseñadas para Node.js. Su capacidad inigualable para ilustrar los patrones asíncronos de Node.js la diferencia de la competencia. Tras analizar sus méritos y características, estoy convencido de que es la mejor herramienta para visualizar procedimientos asíncronos en Node.js.
Características destacadas e integraciones:
Bubbleprof ofrece una representación visual detallada de las operaciones asíncronas, mejorando el proceso de depuración. Sus análisis sobre dependencias ayudan a los desarrolladores a navegar por la compleja red de módulos de Node.js. Además, sus capacidades se extienden al perfilado de la recolección de basura, lo cual es crucial para optimizar el rendimiento de las aplicaciones. En cuanto a integraciones, Bubbleprof puede trabajar con herramientas ETL populares, permitiendo un procesamiento de datos eficiente.
Pros and Cons
Pros:
- Ofrece una visión profunda de los flujos asíncronos, mejorando el proceso de depuración
- El robusto perfilado de la recolección de basura ayuda a optimizar el rendimiento
- La visualización de dependencias simplifica la gestión de módulos de Node.js
Cons:
- Puede tener una curva de aprendizaje pronunciada para principiantes
- Requiere cierta configuración para visualizaciones avanzadas
- Documentación limitada disponible para algunas funciones.

Orbit Profiler es un software de análisis de rendimiento dedicado a ayudar a los desarrolladores a detectar y abordar cuellos de botella en el rendimiento durante el desarrollo de videojuegos y aplicaciones gráficas. Su diseño está enfocado en ofrecer información detallada, lo que lo convierte en una herramienta indispensable para quienes trabajan en el sector de los videojuegos y gráficos.
Por qué elegí Orbit Profiler: En mi búsqueda por seleccionar las herramientas de análisis de rendimiento más competentes, Orbit Profiler destacó. Evalué su eficacia según la precisión que ofrece al identificar cuellos de botella de rendimiento. Gracias a sus funciones diseñadas específicamente para el desarrollo de videojuegos, tuve claro que Orbit Profiler es, sin duda, la mejor elección para el desarrollo de videojuegos y aplicaciones gráficas.
Funciones sobresalientes e integraciones:
Orbit Profiler dispone de funciones que permiten un análisis profundo del rendimiento, especialmente en entornos de juegos complejos. Su interfaz fácil de usar, combinada con la capacidad de ofrecer información detallada, lo convierte en una elección excelente. En cuanto a integraciones, Orbit está diseñado para funcionar con varias plataformas de desarrollo de videojuegos, asegurando que los desarrolladores dispongan de una herramienta completa.
Pros and Cons
Pros:
- Detección exhaustiva de cuellos de botella específicos de entornos de juegos
- Interfaz fácil de usar que simplifica el análisis de rendimiento
- Amplias capacidades de integración con múltiples plataformas de desarrollo de videojuegos
Cons:
- Puede ser excesivo para aplicaciones más simples fuera de los ámbitos de videojuegos y gráficos
- Curva de aprendizaje potencialmente pronunciada para quienes no están familiarizados con el análisis específico de juegos
- Documentación limitada en comparación con otras herramientas más consolidadas.
Reseñas Relacionadas
- Software de Calidad de Datos
- Herramientas de Monitorización del Rendimiento
- Herramientas de Monitorización de Aplicaciones
Criterios para Seleccionar Herramientas de Perfilado
Al seleccionar las mejores herramientas de perfilado para incluir en esta lista, consideré las necesidades y puntos de dolor comunes de los compradores, como la identificación de cuellos de botella en el rendimiento y la integración con entornos de desarrollo existentes. Además, utilicé el siguiente marco para mantener mi evaluación estructurada y justa:
Funcionalidad Principal (25% de la puntuación total)
Para ser consideradas en esta lista, cada solución debía cumplir con los siguientes casos de uso comunes:
- Analizar el uso de CPU
- Monitorizar la asignación de memoria
- Detectar cuellos de botella de rendimiento
- Perfilar aplicaciones multihilo
- Generar informes detallados
Características Destacadas Adicionales (25% de la puntuación total)
Para ayudar a acotar aún más la competencia, también busqué características únicas, tales como:
- Análisis de datos en tiempo real
- Integración con pipelines CI/CD
- Soporte para sistemas distribuidos
- Tableros personalizables
- Herramientas avanzadas de visualización
Usabilidad (10% de la puntuación total)
Para evaluar la usabilidad de cada sistema, consideré lo siguiente:
- Interfaz de usuario intuitiva
- Navegación sencilla
- Curva de aprendizaje mínima
- Ajustes personalizables
- Diseño adaptable
Incorporación (10% de la puntuación total)
Para evaluar la experiencia de incorporación en cada plataforma, consideré lo siguiente:
- Disponibilidad de vídeos de formación
- Tours interactivos del producto
- Acceso a plantillas
- Asistencia por chatbot
- Seminarios web en vivo
Soporte al cliente (10% de la puntuación total)
Para evaluar los servicios de atención al cliente de cada proveedor de software, consideré lo siguiente:
- Disponibilidad 24/7
- Múltiples canales de soporte
- Tiempo de respuesta
- Personal capacitado
- Disponibilidad de preguntas frecuentes
Relación calidad-precio (10% de la puntuación total)
Para evaluar la relación calidad-precio de cada plataforma, consideré lo siguiente:
- Precios competitivos
- Opciones de suscripción por niveles
- Disponibilidad de prueba gratuita
- Costo vs. características ofrecidas
- Descuentos para planes anuales
Opiniones de clientes (10% de la puntuación total)
Para tener una idea de la satisfacción general de los usuarios, consideré lo siguiente al leer las opiniones de los clientes:
- Calificación general de satisfacción
- Ventajas y desventajas mencionadas con frecuencia
- Frecuencia de actualizaciones
- Problemas reportados por usuarios
- Testimonios de industrias similares
Cómo elegir herramientas de perfilado
Es fácil perderse en largas listas de funciones y estructuras de precios complejas. Para ayudarte a mantener el enfoque durante tu proceso único de selección de software, aquí tienes una lista de factores a tener en cuenta:
| Factor | Qué considerar |
|---|---|
| Escalabilidad | ¿La herramienta puede crecer con tu equipo? Considera si puede manejar cargas de datos y cantidad de usuarios crecientes sin sacrificar el rendimiento. Asegúrate de que sea adecuada tanto para tus necesidades actuales como futuras. |
| Integraciones | ¿Se conecta fácilmente con tus sistemas actuales? Verifica la compatibilidad con los entornos de desarrollo y otras herramientas que tu equipo use a diario. Evita soluciones que requieran complejos procedimientos para integrarse. |
| Personalización | ¿Puedes adaptar la herramienta a tu flujo de trabajo? Busca opciones para personalizar paneles, informes y alertas. Asegúrate de que se ajuste a los procesos de tu equipo sin requerir una configuración extensa. |
| Facilidad de uso | ¿La herramienta es intuitiva para todos los miembros del equipo? Una curva de aprendizaje pronunciada puede afectar la productividad. Busca una navegación sencilla e instrucciones claras. Prueba la interfaz para ver si es directa para los nuevos usuarios. |
| Implementación y capacitación | ¿Qué tan rápido puede tu equipo empezar a usarla? Considera la disponibilidad de recursos de formación y soporte durante la configuración. Un proceso de incorporación fluido puede marcar la diferencia en la adopción y eficacia. |
| Costo | ¿El precio se ajusta a tu presupuesto? Evalúa el costo total, incluidos posibles cargos ocultos por funciones adicionales o soporte. Compara los planes de suscripción y analiza la asequibilidad a largo plazo. |
| Medidas de seguridad | ¿Tus datos y operaciones están seguras? Verifica el cumplimiento de las normas de protección de datos y busca funciones como encriptación y controles de acceso. No sacrifiques la seguridad por ahorrar costos. |
| Disponibilidad de soporte | ¿Hay ayuda disponible cuando la necesitas? Revisa los horarios y canales de soporte del proveedor. Tiempos de respuesta rápidos y asistencia experta pueden impactar notablemente la experiencia de tu equipo con la herramienta. |
¿Qué es una herramienta de perfilado?
Las herramientas de perfilado son programas que te ayudan a medir cómo se comporta tu código para que puedas detectar funciones lentas, problemas de memoria o uso ineficiente de recursos. Se usan principalmente por desarrolladores e ingenieros que necesitan entender cómo se comportan sus aplicaciones en tiempo de ejecución y dónde pueden estar ocultos los problemas de rendimiento.
Las funciones como los gráficos de llamadas, el seguimiento del uso de memoria y el muestreo de CPU ayudan a identificar cuellos de botella, comprender la carga del sistema y mejorar los tiempos de respuesta. Estas herramientas facilitan la optimización de aplicaciones sin tener que adivinar qué las está ralentizando.
Características
Al seleccionar herramientas de perfilado, presta atención a las siguientes características clave:
- Análisis de uso de CPU: Ayuda a identificar qué partes de la aplicación consumen más potencia de procesamiento, facilitando la optimización.
- Supervisión de la asignación de memoria: Controla el uso de memoria para detectar fugas e ineficiencias, asegurando un rendimiento más fluido.
- Detección de cuellos de botella en el rendimiento: Identifica las zonas lentas del código, permitiendo mejoras específicas.
- Capacidades de integración: Se conecta sin problemas con los entornos de desarrollo existentes, mejorando el flujo de trabajo.
- Paneles personalizables: Permite a los usuarios adaptar vistas e informes a necesidades específicas, mejorando la usabilidad.
- Análisis de datos en tiempo real: Ofrece información inmediata sobre el rendimiento de la aplicación, facilitando la toma de decisiones rápidas.
- Herramientas avanzadas de visualización: Ofrece representaciones gráficas de los datos, facilitando la comprensión de información compleja.
- Salvaguardas de seguridad: Garantiza la protección de los datos mediante cifrado y controles de acceso, manteniendo la confianza del usuario.
- Tours interactivos del producto: Guía a los nuevos usuarios por las funciones, mejorando la experiencia de incorporación.
- Disponibilidad de soporte 24/7: Ofrece asistencia en todo momento para resolver problemas rápidamente, aumentando la satisfacción del usuario.
Beneficios
Implementar herramientas de perfilado aporta varios beneficios para su equipo y su empresa. Aquí hay algunos que puede esperar:
- Mejor rendimiento: Al identificar problemas de uso de CPU y memoria, estas herramientas ayudan a optimizar la velocidad y la eficiencia de la aplicación.
- Depuración mejorada: La detección de cuellos de botella en el rendimiento permite a los desarrolladores encontrar y corregir rápidamente secciones problemáticas del código.
- Mejor gestión de recursos: La supervisión de la asignación de memoria garantiza el uso eficiente de los recursos del sistema, evitando desperdicios y mejorando la estabilidad.
- Mayor productividad: El análisis de datos en tiempo real y los paneles personalizables agilizan los flujos de trabajo, permitiendo que los equipos se concentren en tareas críticas.
- Mayor seguridad: Funciones como el cifrado y los controles de acceso protegen los datos sensibles, manteniendo la conformidad y la confianza.
- Incorporación simplificada: Los tours interactivos del producto y los recursos de capacitación facilitan que los nuevos usuarios se pongan al día rápidamente.
- Soporte fiable: Con disponibilidad 24/7, el soporte al cliente asegura que cualquier problema se resuelva rápidamente, minimizando el tiempo de inactividad.
Costos y Precios
Seleccionar herramientas de perfilado requiere comprender los distintos modelos y planes de precios disponibles. Los costos varían en función de las características, el tamaño del equipo, complementos y más. La siguiente tabla resume los planes comunes, sus precios promedio y las características típicas incluidas en las soluciones de herramientas de perfilado:
Tabla comparativa de planes para herramientas de perfilado
| Tipo de Plan | Precio Promedio | Características Comunes |
|---|---|---|
| Plan Gratuito | $0 | Monitoreo básico de CPU y memoria, reportes limitados y soporte comunitario. |
| Plan Personal | $10-$30/usuario/mes | Análisis avanzado de rendimiento, paneles personalizables y soporte por correo electrónico. |
| Plan Empresarial | $50-$100/usuario/mes | Análisis de datos en tiempo real, capacidades de integración, mejoras de seguridad y soporte prioritario. |
| Plan Enterprise | $150-$300/usuario/mes | Monitoreo integral, gestor de cuentas dedicado, opciones avanzadas de seguridad y soporte premium 24/7. |
Preguntas más comunes sobre herramientas de perfilado (FAQs)
¿Cómo ayudan las herramientas de perfilado con la optimización del rendimiento?
Las herramientas de perfilado analizan tu código para encontrar cuellos de botella en el rendimiento, lo que te permite optimizar y mejorar la eficiencia. Proporcionan información sobre el uso de la CPU, la asignación de memoria y otras métricas que pueden ralentizar tu aplicación. Al usar estas herramientas, puedes realizar mejoras específicas.
¿Cómo gestionan las herramientas de perfilado aplicaciones a gran escala?
Las herramientas de perfilado diseñadas para uso empresarial pueden manejar aplicaciones a gran escala al ofrecer análisis detallados e información de alto nivel. Son capaces de gestionar grandes volúmenes de datos y cantidades de usuarios sin sacrificar el rendimiento. Busca funciones como la compatibilidad con sistemas distribuidos si trabajas con aplicaciones grandes.
¿Cómo pueden las herramientas de perfilado mejorar mi proceso de desarrollo?
Las herramientas de perfilado pueden mejorar tu proceso de desarrollo al identificar y resolver rápidamente problemas de rendimiento. Ofrecen datos en tiempo real e informes personalizables, lo que te ayuda a tomar decisiones informadas. Esto se traduce en un código más eficiente y un ciclo de desarrollo más fluido.
¿Vale la pena invertir en una herramienta de perfilado premium?
Aunque las herramientas gratuitas pueden ser efectivas para proyectos más pequeños o necesidades básicas de perfilado, invertir en una herramienta premium se vuelve esencial para aplicaciones más grandes y complejas. Las herramientas de pago suelen ofrecer funciones más avanzadas, mejor soporte y opciones de escalabilidad, lo que las hace valiosas para garantizar un rendimiento óptimo de la aplicación.
¿Se pueden usar las herramientas de perfilado con cualquier lenguaje de programación?
La mayoría de las herramientas de perfilado son compatibles con varios lenguajes de programación, pero no todas soportan todos los lenguajes. Antes de elegir una herramienta, es fundamental comprobar su compatibilidad con los lenguajes específicos que utilizas en tu aplicación.
¿Qué sigue?
Si estás investigando herramientas de perfilado, conéctate con un asesor de SoftwareSelect para recibir recomendaciones gratuitas.
Completa un formulario y tendrás una breve charla donde analizarán tus necesidades específicas. Luego recibirás una lista seleccionada de software para revisar. Incluso te acompañarán durante todo el proceso de compra, incluyendo la negociación de precios.