10 Mejores Herramientas de Monitoreo SRE en 2026

Mejor Selección de Herramientas de Monitoreo SRE


Las herramientas de monitoreo SRE son plataformas que ayudan a los ingenieros de confiabilidad del sitio a rastrear la salud del sistema, detectar incidentes y analizar el rendimiento en infraestructuras complejas. Estas herramientas están estrechamente vinculadas con las herramientas de gestión de incidentes y están diseñadas para monitorear sistemas de producción, apoyando los flujos de trabajo modernos de desarrollo de software. Recopilan y analizan métricas, registros y trazas para proporcionar visibilidad en tiempo real, ayudando a los equipos a identificar problemas rápidamente y reducir el tiempo de inactividad. Esta guía va al grano para ayudarte a comparar las mejores opciones, entender qué distingue a cada herramienta y elegir la más adecuada para las necesidades de tu equipo en 2026.
Table of Contents
Por qué confiar en nuestras reseñas de software
Llevamos probando y revisando software desde 2023. Como líderes tecnológicos, sabemos lo crítico y difícil que es tomar la decisión correcta al seleccionar software.
Invertimos en una investigación profunda para ayudar a nuestra audiencia a tomar mejores decisiones de compra de software. Hemos probado más de 2,000 herramientas para diferentes casos de uso tecnológicos y escrito más de 1,000 reseñas de software exhaustivas. Descubre cómo mantenemos la transparencia y nuestra metodología de revisión de software.
Resumen de las Mejores Herramientas de Monitoreo SRE
Esta tabla comparativa resume los detalles de precios de mis principales selecciones de herramientas de monitoreo SRE para ayudarte a encontrar la más adecuada para tu presupuesto y necesidades empresariales
| Tool | Best For | Trial Info | Price | ||
|---|---|---|---|---|---|
| 1 | Mejor para monitoreo de pila completa | Plan gratuito disponible | Desde $49/usuario/mes | Website | |
| 2 | Ideal para el análisis de registros en la nube | Prueba gratuita de 30 días + plan gratuito + demostración gratuita disponible | Desde $79/mes (facturado anualmente) | Website | |
| 3 | Mejor para métricas y alertas de código abierto | Uso gratuito | Sin costo de licencia | Website | |
| 4 | Mejor para la observabilidad en Google Cloud | Plan gratuito disponible | Desde $0.1510/MiB para métricas ingeridas | Website | |
| 5 | Mejor para monitoreo nativo de AWS | Plan gratuito disponible | Precio bajo consulta | Website | |
| 6 | Ideal para la visualización de datos de monitoreo | Plan gratuito disponible | Desde $19/mes + uso | Website | |
| 7 | Ideal para canalizaciones de procesamiento de registros | Prueba gratuita de 7 días disponible | Precio bajo consulta | Website | |
| 8 | Ideal para monitoreo de datos de series temporales | Prueba gratuita de 30 días disponible | Precio a consultar | Website | |
| 9 | Ideal para monitoreo flexible de infraestructuras | Prueba gratuita de 14 días + demo gratis disponible | Desde $3/nodo/mes (facturación anual) | Website | |
| 10 | Ideal para el seguimiento de errores en tiempo real | Plan gratuito + prueba gratuita + demo gratuita disponible | Desde $26/mes (facturado anualmente) | Website |
-

TestDevLab
Visit Website -
Site24x7
Visit WebsiteThis is an aggregated rating for this tool including ratings from Crozdesk users and ratings from other sites.4.7 -
GitHub Actions
Visit WebsiteThis is an aggregated rating for this tool including ratings from Crozdesk users and ratings from other sites.4.8


Reseñas de las Mejores Herramientas de Monitoreo SRE
A continuación, encontrarás mis resúmenes detallados de las herramientas de monitoreo SRE que formaron parte de mi selección. Mis reseñas ofrecen un análisis profundo de sus características, integraciones y mejores casos de uso para que encuentres la mejor opción para ti.
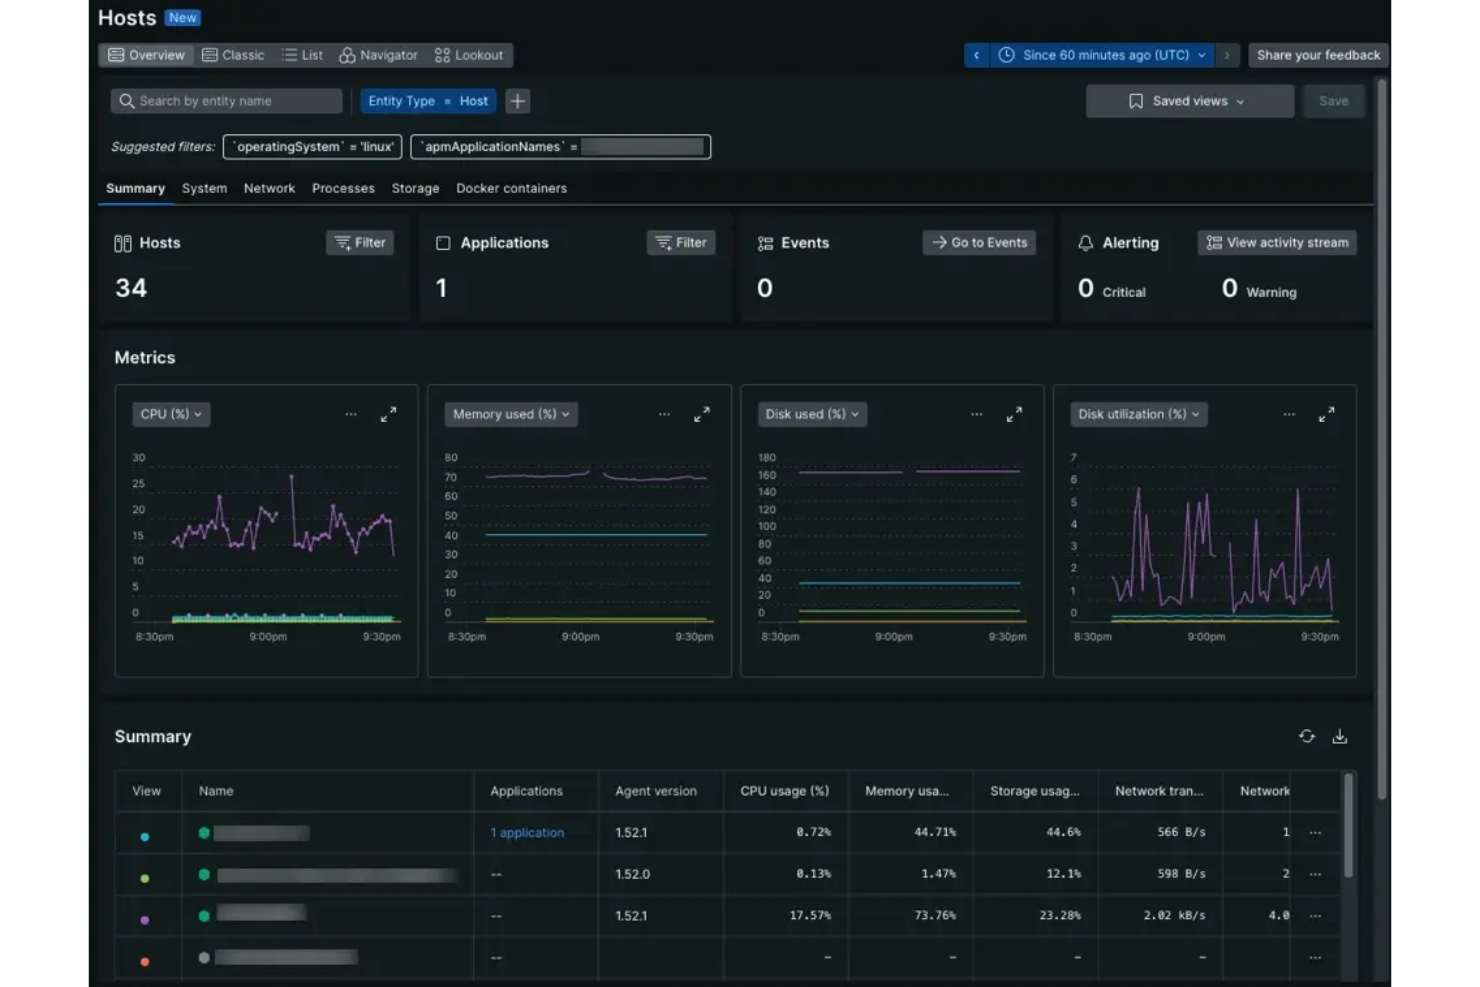
New Relic es una plataforma de observabilidad de pila completa para el monitoreo SRE que reúne el monitoreo del rendimiento de aplicaciones, el monitoreo de infraestructura, el rastreo distribuido y la gestión de registros en un solo sistema.
¿Para quién es mejor New Relic?
New Relic es especialmente adecuado para equipos SRE e ingenieros DevOps en organizaciones medianas y grandes que gestionan aplicaciones complejas basadas en la nube.
Por qué elegí New Relic
Elegí New Relic como uno de los mejores porque confío en su plataforma de telemetría unificada para reunir métricas, trazas y registros en un solo lugar. Me gusta cómo sus conocimientos impulsados por IA ayudan a mi equipo a identificar y resolver rápidamente incidentes en toda nuestra pila. Mi equipo utiliza la observabilidad de pila completa de New Relic para supervisar todo, desde la infraestructura en la nube hasta el rendimiento de aplicaciones en tiempo real.
Características clave de New Relic
- Monitoreo sintético: Simula interacciones de usuarios para probar el tiempo de actividad y el rendimiento de las aplicaciones.
- Trazabilidad distribuida: Rastrea las solicitudes a medida que se mueven a través de microservicios e infraestructura.
- Paneles personalizables: Te permite crear visualizaciones adaptadas a tus necesidades de monitoreo.
- Políticas de alertas: Permite establecer umbrales y automatizar las notificaciones de incidentes.
Integraciones de New Relic
New Relic ofrece más de 800 integraciones nativas, incluidas AWS, Azure, Google Cloud Platform, Kubernetes, Docker, Slack, PagerDuty, Jira, GitHub, ServiceNow y Salesforce, con una API disponible para integraciones personalizadas.
Pros and Cons
Pros:
- Flujo de datos en tiempo real para respuesta rápida a incidentes
- Paneles personalizables para flujos de trabajo SRE
- Ofrece observabilidad profunda en stacks nativos en la nube
Cons:
- Altos costos de ingestión de datos en entornos grandes
- Opciones limitadas de implementación local
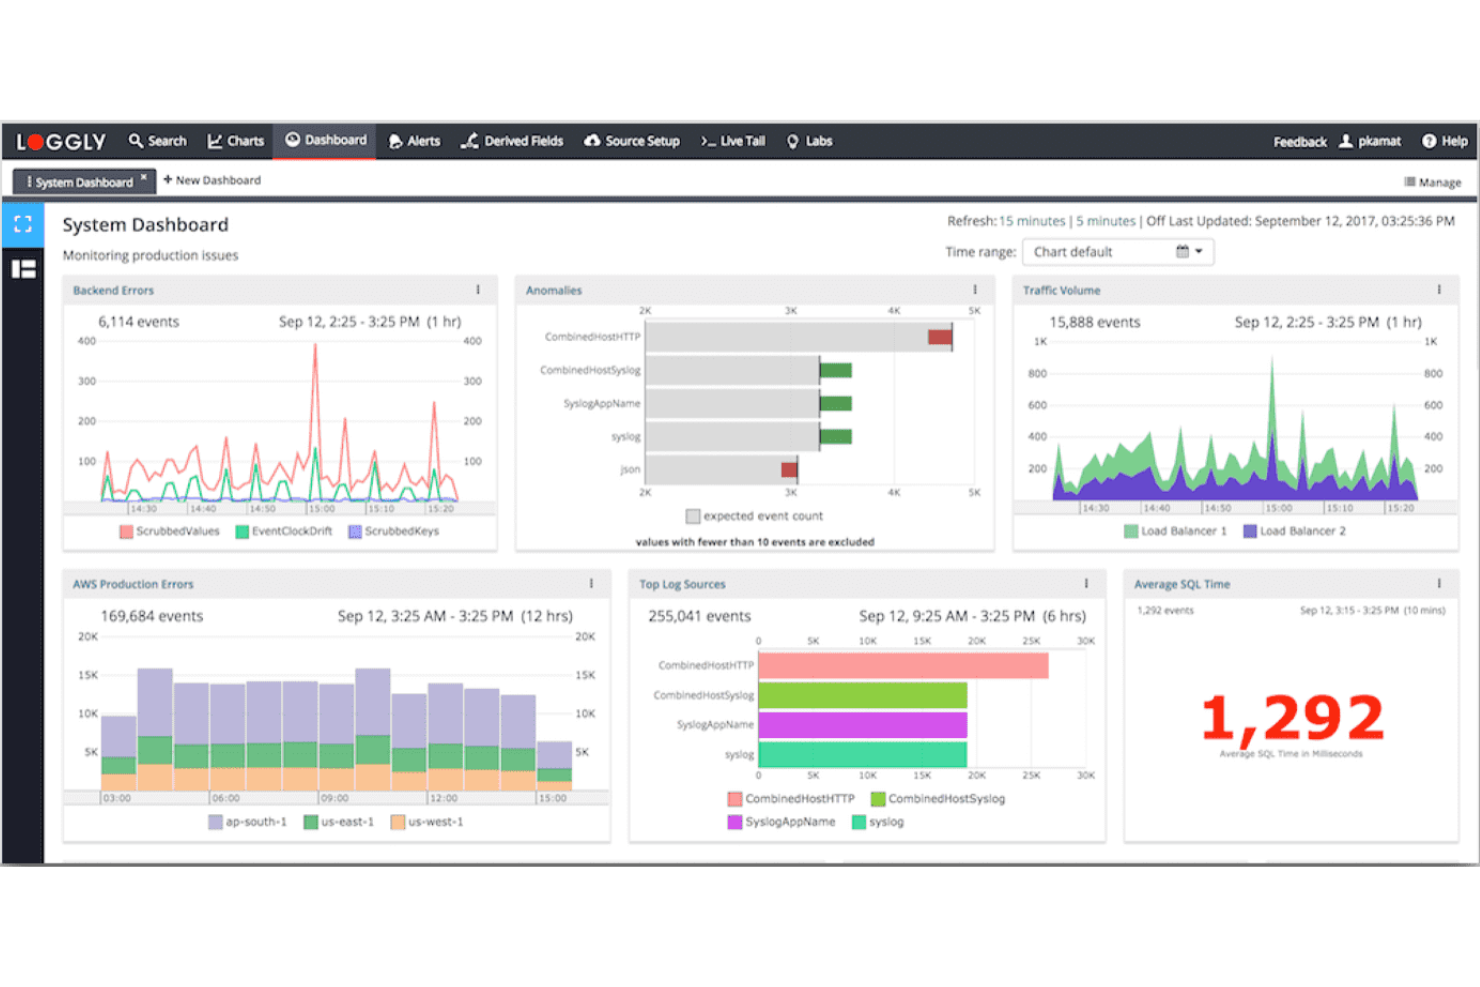
Loggly es una plataforma de gestión de registros basada en la nube para el monitoreo SRE que recopila, indexa y analiza datos de registros de servidores, aplicaciones y servicios en la nube en tiempo real.
¿Para Quién es Mejor Loggly?
Loggly es una excelente opción para SREs y equipos de TI en organizaciones medianas y grandes que gestionan infraestructuras en la nube distribuidas.
Por Qué Elegí Loggly
Elegí Loggly como uno de los mejores porque confío en su gestión de registros en la nube para buscar y visualizar rápidamente grandes volúmenes de registros. Me gusta cómo su explorador de campos dinámico y los tableros interactivos me permiten profundizar en los datos de registros sin tener que crear consultas personalizadas. Mi equipo utiliza su búsqueda en tiempo real y el análisis automático para monitorear sistemas distribuidos y detectar problemas rápidamente.
Características Clave de Loggly
- Alertas automáticas: Configura alertas personalizadas basadas en eventos de registro y umbrales.
- Archivado de registros: Almacena y recupera datos históricos de registros para cumplimiento y auditorías.
- Acceso a la API RESTful: Integra datos de registros con herramientas y flujos de trabajo externos.
- Soporte para múltiples fuentes de registros: Recopila registros de servidores, plataformas en la nube y dispositivos de red.
Integraciones de Loggly
Loggly ofrece integraciones nativas con AWS CloudWatch, GitHub, Jira, Slack, Microsoft Teams y PagerDuty, y proporciona una API para integraciones personalizadas.
Pros and Cons
Pros:
- Gestiona formatos y fuentes de registros diversas
- Visualiza datos de registros con paneles interactivos
- Admite formatos de registros estructurados y no estructurados
Cons:
- Sin soporte integrado para implementación local
- Las alertas carecen de lógica avanzada de correlación

Prometheus es un sistema de monitoreo y alerta de código abierto diseñado para ingenieros de confiabilidad del sitio que necesitan recopilar, almacenar y consultar métricas de series temporales de infraestructuras y aplicaciones.
¿Para Quién Es Mejor Prometheus?
Prometheus es ideal para ingenieros de confiabilidad del sitio y equipos DevOps en organizaciones orientadas a la tecnología que gestionan infraestructuras a gran escala y en contenedores.
Por Qué Elegí Prometheus
Elegí Prometheus como uno de los mejores porque confío en su conjunto de herramientas de código abierto para recopilar y almacenar datos de series temporales de infraestructuras dinámicas. Me gusta cómo su lenguaje de consulta flexible me permite crear paneles personalizados y alertas para cualquier métrica relevante para mi equipo. Mi equipo utiliza Prometheus para monitorear clústeres de Kubernetes y cargas de trabajo en contenedores, aprovechando su recolección de datos basada en pull y su descubrimiento automático de servicios.
Funciones Clave de Prometheus
- Integración con Alertmanager: Envía alertas a correo electrónico, PagerDuty o Slack según reglas personalizadas.
- Modelo de datos multidimensional: Almacena métricas con etiquetas para consultas y filtrados flexibles.
- Descubrimiento de servicios: Detecta automáticamente objetivos en entornos cloud y de contenedores.
- Configuración de retención de datos: Establece períodos de retención personalizados para los datos de series temporales.
Integraciones de Prometheus
Prometheus ofrece integraciones nativas con Alertmanager, Grafana, Kubernetes, Consul y Docker, y proporciona una API para integraciones personalizadas.
Pros and Cons
Pros:
- La recolección de métricas por pull soporta entornos dinámicos
- Lenguaje de consulta PromQL flexible para métricas personalizadas
- Comunidad de código abierto sólida y buena documentación
Cons:
- Sin almacenamiento incorporado para métricas a largo plazo
- No cuenta con soporte nativo para trazabilidad distribuida

Google Cloud Monitoring es una plataforma de monitoreo nativa de la nube para ingeniería de confiabilidad del sitio que recopila, visualiza y analiza métricas, eventos y registros de Google Cloud y entornos híbridos.
¿Para Quién Es Mejor Google Cloud Monitoring?
Google Cloud Monitoring es ideal para equipos de SRE que gestionan cargas de trabajo en Google Cloud o entornos de nube híbrida.
Por Qué Elegí Google Cloud Monitoring
Elegí Google Cloud Monitoring como uno de los mejores porque me ofrece monitoreo y observabilidad nativos en los recursos de Google Cloud sin configuración adicional. Me gusta cómo puedo visualizar métricas, registros y comprobaciones de tiempo de actividad para mis cargas de trabajo en la nube e híbridas en un solo lugar. Mi equipo utiliza sus políticas de alertas y paneles personalizados para rastrear la salud del servicio y responder rápidamente a los incidentes.
Características Clave de Google Cloud Monitoring
- Monitoreo multicloud: Recopila y muestra métricas de AWS y sistemas locales junto con Google Cloud.
- Seguimiento de SLO: Te permite definir y monitorear objetivos de nivel de servicio para la confiabilidad.
- Monitoreo de tiempo de actividad: Verifica continuamente la disponibilidad del servicio desde múltiples ubicaciones globales.
- Líneas de tiempo de incidentes: Visualiza incidentes y eventos relacionados en una vista cronológica para una resolución de problemas más rápida.
Integraciones de Google Cloud Monitoring
Google Cloud Monitoring ofrece integraciones nativas en todo el ecosistema de Google Cloud, incluyendo Google Compute Engine, Google Kubernetes Engine, Google App Engine, Google Cloud Functions y Google Cloud Storage. Hay una API disponible para integraciones personalizadas.
Pros and Cons
Pros:
- Admite monitoreo multicloud e híbrido
- Funciones personalizadas de seguimiento de SLO y SLA
- Escalable para entornos grandes y distribuidos
Cons:
- La navegación por la interfaz puede resultar poco intuitiva para nuevos usuarios
- El precio puede aumentar rápidamente con un alto volumen de datos
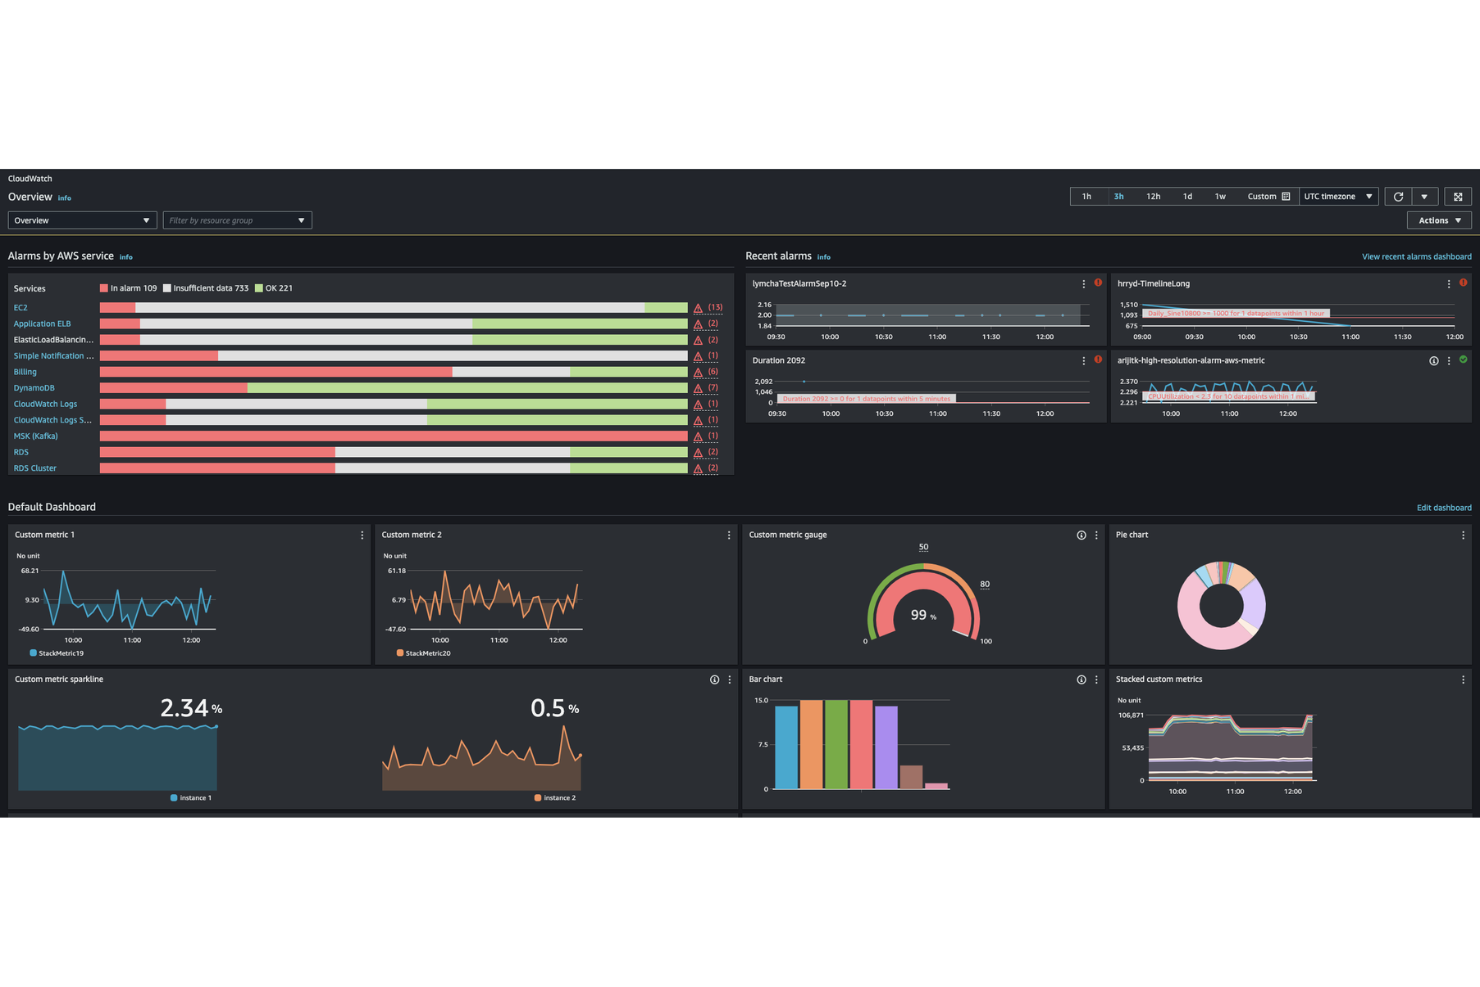
Amazon CloudWatch es una plataforma de monitoreo y observabilidad nativa en la nube de AWS que proporciona recopilación de métricas, gestión de registros, monitoreo de eventos y alertas automáticas para la infraestructura y las aplicaciones que se ejecutan en AWS.
¿Para quién es mejor Amazon CloudWatch?
Amazon CloudWatch es una opción sólida para los equipos de SRE enfocados en AWS y los ingenieros de infraestructura en la nube en empresas medianas y grandes.
Por qué elegí Amazon CloudWatch
Elegí Amazon CloudWatch como uno de los mejores porque me brinda monitoreo y observabilidad nativos de AWS sin configuración adicional. Me gusta cómo puedo recopilar y visualizar métricas, registros y eventos de todos mis recursos de AWS en un solo lugar. Mi equipo utiliza sus alarmas automáticas y paneles para rastrear el estado de la infraestructura en la nube y el rendimiento de las aplicaciones en tiempo real.
Características clave de Amazon CloudWatch
- Métricas personalizadas: Envía y monitorea métricas específicas de la aplicación junto con los datos de recursos AWS.
- Log Insights: Ejecuta consultas y analiza datos de registros de forma interactiva para la resolución de problemas.
- Detección de anomalías: Detecta patrones inusuales en las métricas automáticamente mediante aprendizaje automático.
- Monitoreo sintético: Simula interacciones de usuarios para monitorear la disponibilidad y la latencia de los puntos finales.
Integraciones de Amazon CloudWatch
Amazon CloudWatch ofrece integraciones nativas con más de 70 servicios de AWS, incluidos Amazon EC2, Amazon S3, Amazon API Gateway y Amazon RDS. También admite integración con Amazon OpenSearch Service y proporciona una API para integraciones personalizadas.
Pros and Cons
Pros:
- Integración profunda con servicios y recursos de AWS
- Soporta métricas y paneles personalizados
- Permisos granulares con integración AWS IAM
Cons:
- Visibilidad limitada en entornos ajenos a AWS
- Sin flujos de trabajo de gestión de incidentes integrados
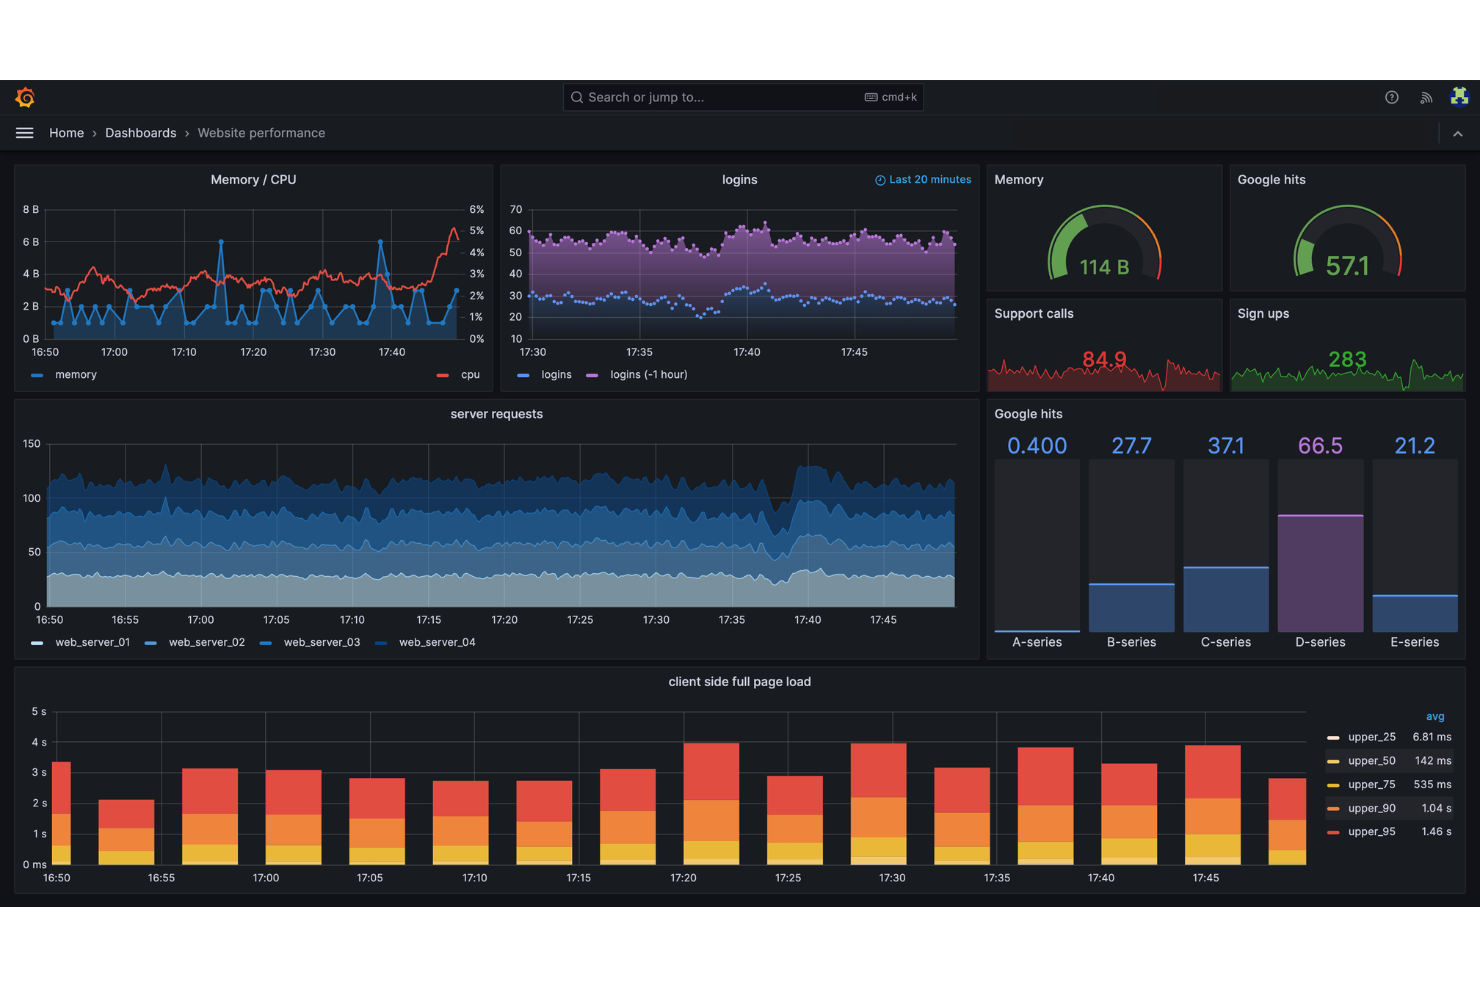
Grafana Labs es una plataforma de monitoreo y análisis de código abierto para ingenieros de confiabilidad de sitios que te permite visualizar, consultar y correlacionar datos de series temporales de múltiples fuentes en paneles personalizables.
¿Para quién es mejor Grafana Labs?
Grafana Labs es ideal para ingenieros de confiabilidad de sitios y equipos DevOps en organizaciones que necesitan visualizar y analizar métricas de diversas fuentes de datos.
Por qué elegí Grafana Labs
Elegí Grafana Labs como uno de los mejores porque confío en sus paneles de código abierto para visualizar datos de series temporales de Prometheus, Loki y otras fuentes en un solo lugar. Me gusta poder crear paneles personalizados y alertas para métricas SRE, y después compartir esos paneles con mi equipo. Mi equipo utiliza Grafana Labs para correlacionar registros, métricas y trazas para una respuesta a incidentes más rápida.
Características clave de Grafana Labs
- Control de acceso basado en roles: Gestiona los permisos de usuarios y restringe el acceso a paneles sensibles.
- Plugins de fuentes de datos: Conéctate a bases de datos como MySQL, PostgreSQL, InfluxDB y Elasticsearch.
- Soporte de anotaciones: Marca eventos directamente en los paneles para aportar contexto durante las revisiones de incidentes.
- Paneles con plantillas: Usa variables para crear paneles reutilizables y dinámicos para diferentes entornos o equipos.
Integraciones de Grafana Labs
Grafana Labs ofrece integraciones nativas con MongoDB, AppDynamics, Jira, Oracle, GitLab, Salesforce, Splunk, y proporciona una API para integraciones personalizadas.
Pros and Cons
Pros:
- Soporta la agregación de datos de múltiples fuentes en paneles
- PromQL permite consultas avanzadas de métricas
- Sólido ecosistema de plugins de código abierto
Cons:
- Los datos de alta cardinalidad pueden afectar el rendimiento
- El soporte de trazabilidad distribuida es limitado

Logstash es una herramienta de canalización de datos en tiempo real para la supervisión SRE que ingiere, transforma y reenvía registros y datos de eventos desde diversas fuentes a múltiples salidas.
¿Para quién es más adecuado Logstash?
Logstash es ideal para los equipos de SRE y TI de grandes empresas que necesitan centralizar y procesar grandes volúmenes de registros y datos de eventos.
Por qué elegí Logstash
Elegí Logstash como uno de los mejores porque confío en su canalización de datos en tiempo real para ingerir, transformar y reenviar registros desde docenas de fuentes. Mi equipo utiliza su rico ecosistema de plugins para analizar, enriquecer y enrutar datos a Elasticsearch y otras salidas. Me gusta cómo podemos construir canalizaciones complejas para la monitorización SRE sin escribir código personalizado para cada fuente de datos.
Características clave de Logstash
- Gestión centralizada de canalizaciones: Configure y supervise múltiples canalizaciones desde una sola interfaz.
- Amplio soporte de códecs: Maneja varios formatos de datos como JSON, CSV y syslog.
- Colas persistentes: Almacena eventos en disco para evitar la pérdida de datos durante interrupciones.
- Cola de mensajes fallidos (dead letter queue): Captura y aísla eventos fallidos para su posterior revisión y solución de problemas.
Integraciones de Logstash
Logstash ofrece más de 200 plugins nativos para entradas, filtros y salidas, incluidas integraciones nativas con Elasticsearch, Amazon S3, Kafka, JDBC y AWS CloudWatch, y proporciona una API para el desarrollo de plugins personalizados.
Pros and Cons
Pros:
- Manejo avanzado de análisis y enriquecimiento de registros
- Ofrece colas persistentes para durabilidad de datos
- Configuración de canalizaciones flexible para flujos de trabajo personalizados
Cons:
- La resolución de errores en las canalizaciones puede ser complicada
- Problemas de compatibilidad de plugins tras actualizaciones mayores

InfluxDB es una base de datos de series temporales y una plataforma de monitoreo diseñada para equipos SRE que necesitan recopilar, almacenar y analizar métricas de red e infraestructura de alto volumen.
¿Para quién es mejor InfluxDB?
InfluxDB es una excelente opción para SREs y equipos DevOps en organizaciones que manejan monitoreo de red e infraestructura de alto rendimiento.
Por qué elegí InfluxDB
Elegí InfluxDB como una de las mejores opciones porque está diseñada específicamente para datos de series temporales de alto rendimiento, lo cual es esencial para el monitoreo de redes a gran escala. Me gusta cómo puedo ingerir, almacenar y consultar millones de métricas por segundo sin retrasos. Mi equipo utiliza su lenguaje de consulta Flux para analizar patrones de tráfico de red y detectar anomalías en tiempo real. La flexibilidad de su esquema nos permite adaptarnos rápidamente a medida que evolucionan nuestras necesidades de monitoreo.
Características clave de InfluxDB
- Soporte nativo para el agente Telegraf: Recopila métricas de cientos de fuentes usando complementos ligeros.
- Reducción de datos y políticas de retención: Gestiona automáticamente el almacenamiento agregando y eliminando datos antiguos.
- Paneles personalizados: Permite crear visualizaciones para datos de red en tiempo real e históricos.
- Motor de alertas: Genera notificaciones basadas en umbrales y condiciones definidos por el usuario.
Integraciones de InfluxDB
InfluxDB ofrece integraciones nativas con Telegraf, Grafana, Kapacitor, Chronograf y MQTT, y proporciona una API para integraciones personalizadas.
Pros and Cons
Pros:
- Maneja grandes volúmenes de datos de series temporales de alta ingesta
- Políticas flexibles de retención y reducción de datos
- El lenguaje de consulta Flux permite análisis avanzados
Cons:
- No cuenta con funciones de aprendizaje automático integradas
- Sin alertas nativas en la versión open source

Sensu es una plataforma de monitoreo de código abierto para equipos SRE que ofrece procesamiento de eventos, comprobaciones de estado, recopilación de telemetría y remediación automatizada para infraestructuras dinámicas y entornos nativos en la nube.
¿Para quién es mejor Sensu?
Sensu es ideal para SREs y equipos de DevOps que gestionan infraestructuras complejas y dinámicas en entornos nativos en la nube o híbridos.
Por qué elegí Sensu
Elegí Sensu como una de las mejores opciones porque me gusta la flexibilidad que me da para monitorear infraestructuras dinámicas, especialmente en entornos nativos en la nube e híbridos. Mi equipo utiliza su canal de eventos para automatizar comprobaciones de estado, recopilación de telemetría y flujos de trabajo de remediación. Dependo de su soporte para comprobaciones y complementos personalizados para adaptar el monitoreo a nuestros entornos únicos.
Características clave de Sensu
- Control de acceso basado en roles: Gestiona los permisos de los usuarios y el acceso a los recursos de monitoreo.
- Modo de silenciamiento y mantenimiento: Suprime temporalmente las alertas durante el mantenimiento planificado o problemas conocidos.
- Gestión de secretos integrada: Almacena y gestiona de forma segura credenciales confidenciales para comprobaciones y controladores.
- Descubrimiento dinámico de entidades: Registra y cancela automáticamente componentes de infraestructura a medida que escalan.
Integraciones de Sensu
Sensu ofrece integraciones nativas con PagerDuty, Slack, InfluxDB, Nagios, Prometheus y ServiceNow, y proporciona una API para integraciones personalizadas.
Pros and Cons
Pros:
- Soporta complementos personalizados para necesidades de monitoreo únicas
- Gestiona entornos de infraestructura dinámica a gran escala
- El canal de eventos permite flujos de trabajo de remediación automatizados
Cons:
- La sintaxis de configuración puede ser compleja para principiantes
- Visualización incorporada y paneles limitados

Sentry es una plataforma de monitorización de aplicaciones para ingenieros de confiabilidad del sitio que se centra en el seguimiento de errores en tiempo real, la monitorización del rendimiento y la supervisión de la salud de las versiones en múltiples lenguajes de programación y frameworks.
¿Para quién es mejor Sentry?
Sentry es una buena opción para equipos de ingeniería en empresas tecnológicas que requieren visibilidad en tiempo real sobre errores y el rendimiento de las aplicaciones.
Por qué elegí Sentry
Elegí Sentry como uno de los mejores porque confío en su seguimiento de errores en tiempo real para detectar problemas en cuanto ocurren. Me gusta cómo agrupa los errores por causa raíz y proporciona trazas detalladas de pila, lo que ayuda a mi equipo a identificar y resolver rápidamente los problemas. La función de salud de las versiones nos permite monitorizar la estabilidad de los nuevos despliegues sin configuración adicional.
Funciones clave de Sentry
- Monitorización del rendimiento: Rastrea la latencia de la aplicación, el rendimiento y las trazas de transacciones entre servicios.
- Etiquetado de entornos: Filtra y analiza errores según el entorno, como producción, pruebas o desarrollo.
- Seguimiento del impacto en los usuarios: Observa qué usuarios se ven afectados por errores o fallos específicos.
- Integraciones con terceros: Conéctate con herramientas como Slack, Jira y GitHub para alertas y automatización de flujos de trabajo.
Integraciones de Sentry
Sentry ofrece integraciones nativas con Slack, Jira, GitHub, GitLab, Trello, PagerDuty, Datadog, Microsoft Teams, Bitbucket y Azure DevOps. Existe una API disponible para integraciones personalizadas.
Pros and Cons
Pros:
- Seguimiento de errores en tiempo real con contexto detallado
- Monitorización de la salud de las versiones para nuevos despliegues
- Admite múltiples lenguajes de programación y frameworks
Cons:
- Funciones limitadas de monitorización de infraestructura y servidores
- Sin agregación ni análisis de logs incorporados
New Product Updates from Sentry

Sentry Adds Heatmaps to Application Metrics
Sentry introduced heatmaps for Application Metrics to visualize metric value distributions over time, helping teams spot patterns like latency bursts and use heatmaps in Custom Dashboards. For more information, visit Sentry's official site.
 .
.Otras Herramientas de Monitoreo SRE
Aquí tienes algunas opciones adicionales de herramientas de monitoreo SRE que no entraron en mi selección principal, pero que aún vale la pena revisar:


Cómo evalúo las herramientas de monitorización SRE
Divido mi evaluación en dos capas: el nivel básico que toda plataforma SRE debe cumplir y los diferenciadores que marcan la diferencia.
Funcionalidad básica (requisitos esenciales para esta lista)
Estas capacidades básicas sirven como los criterios de aceptación para la inclusión en mi lista:
- Observabilidad de pila completa: Verifico si las métricas, logs y trazas se unifican en una sola vista correlacionada, y no en paneles aislados que obligan a cambiar de contexto durante una interrupción.
- Seguimiento de SLO y presupuesto de errores: Definir indicadores de nivel de servicio y vigilar las tasas de consumo en tiempo real es la manera en que los equipos SRE priorizan el trabajo, así que evalúo cuán nativamente apoya cada herramienta ese flujo de trabajo.
- Alertas y respuesta a incidentes: Busco alertas multicondicionadas con enrutamiento de guardias y políticas de escalamiento que se integren de forma nativa con herramientas como PagerDuty o Opsgenie.
- Detección de anomalías y RCA: Cuando un servicio se degrada, evalúo si la herramienta muestra señales correlacionadas y causas probables, o si solo dispara una ráfaga de alertas no relacionadas.
- Monitorización sintética y de usuarios reales: Chequeos proactivos de disponibilidad y RUM a nivel de sesión ayudan a detectar problemas antes de que los reporten los usuarios.
- Integraciones y estándares de telemetría: El soporte para OpenTelemetry, Prometheus, principales proveedores en la nube y Kubernetes es esencial; reviso tanto el alcance como la profundidad del catálogo de integraciones.
Puntúo a cada proveedor en una escala del 0 (no ofrece la funcionalidad) al 5 (sobresale en esta área) por cada criterio.
Los proveedores deben alcanzar una puntuación media mínima para ser considerados en mi lista. A partir de ahí, considero qué distingue a cada plataforma.
Factores diferenciadores (qué distingue a los proveedores)
Una vez he creado mi lista, así es como contrasto y comparo los diferentes proveedores:
Características destacadas
Las perspectivas predictivas impulsadas por IA detectan riesgos latentes de fiabilidad antes de que se agraven, lo cual es crítico en entornos de rápido crecimiento. También considero el mapeo de topología que detecta de forma automática las dependencias entre microservicios, ayudando a los equipos a identificar el alcance de las fallas durante incidentes caóticos. Para escenarios avanzados, la instrumentación basada en eBPF destaca por su recopilación de telemetría granular y de bajo consumo sin agentes ni cambios de código.
Más allá de las funcionalidades
El modelo de precios es clave aquí: la facturación basada en la ingestión puede dispararse cuando se envían millones de series temporales desde un clúster de Kubernetes, por lo que evalúo cómo cada proveedor gestiona controles de costos como el almacenamiento en niveles y los límites de cardinalidad. La escalabilidad con alta cardinalidad es otro factor relevante, ya que el rendimiento de las consultas suele degradarse al crecer la combinación de etiquetas. Para equipos regulados, reviso la certificación SOC 2 Tipo II, HIPAA y FedRAMP junto con RBAC y registros de auditoría.
Cómo Elegir Herramientas de Monitoreo SRE
Es fácil perderse entre extensas listas de características y estructuras de precios complejas. Para ayudarte a mantener el enfoque durante tu propio proceso de selección de software, aquí tienes una lista de verificación de factores a considerar:
| Factor | Qué considerar |
| Escalabilidad | ¿La herramienta puede manejar el tamaño actual y proyectado de tu infraestructura? Busca soporte comprobado para entornos grandes y dinámicos. |
| Integraciones | ¿Se conecta de forma nativa con tus herramientas de alertas, gestión de tickets y mensajería? Comprueba la compatibilidad con tu stack actual. |
| Personalización | ¿Puedes adaptar verificaciones, alertas y flujos de trabajo a las necesidades de tu equipo? Evalúa el soporte para complementos o scripts personalizados. |
| Facilidad de uso | ¿Tu equipo podrá adoptar y operar la herramienta rápidamente? Considera la curva de aprendizaje y la claridad de la interfaz. |
| Implementación y puesta en marcha | ¿Cuánto tiempo llevará desplegar y configurar la herramienta? Pregunta por soporte en migraciones, documentación y recursos de onboarding disponibles. |
| Costo | ¿Los niveles de precios son transparentes y predecibles? Ten en cuenta los costes iniciales y recurrentes, incluyendo complementos o tarifas por uso. |
| Salvaguardas de seguridad | ¿La herramienta ofrece cifrado, controles de acceso y registros de auditoría? Asegúrate de que cumpla los estándares de seguridad de tu organización. |
| Disponibilidad de soporte | ¿Hay soporte disponible y ágil cuando lo necesitas? Verifica cobertura 24/7, acuerdos de nivel de servicio (SLA) y acceso a expertos técnicos. |
¿Qué son las Herramientas de Monitoreo SRE?
Las herramientas de monitoreo SRE son plataformas de software que ayudan a los ingenieros de confiabilidad del sitio a supervisar, analizar y responder al rendimiento y la confiabilidad del sistema. Estas herramientas proporcionan instrumentación para recopilar métricas, registros y trazas, apoyando la visibilidad de extremo a extremo en aplicaciones e infraestructura. Se integran con plataformas y flujos de trabajo de gestión de incidentes como la programación de guardias para alertar a los ingenieros de turno y gestionar todo el ciclo de vida del incidente. Funcionalidades como runbooks y orquestación ayudan a automatizar la respuesta y la resolución. Las herramientas SRE también se conectan con APM, gestión de configuración e infraestructura como código (IaC), apoyando los procesos de aprovisionamiento y depuración.
Características de las herramientas de monitoreo SRE
Al seleccionar herramientas de monitoreo SRE, ten en cuenta las siguientes características clave:
- Recopilación de métricas en tiempo real: Recoge de manera continua datos sobre el rendimiento del sistema y las aplicaciones, proporcionando información actualizada para la monitorización proactiva y la resolución de problemas.
- Alertas personalizadas: Permite definir umbrales y condiciones específicas que activan notificaciones, para que tu equipo responda rápidamente a incidentes y anomalías.
- Respuesta automática a incidentes: Permite flujos de trabajo que ejecutan pasos de remediación o escalan problemas automáticamente según reglas predefinidas, reduciendo la intervención manual.
- Control de acceso basado en roles: Permite gestionar permisos de usuario y restringir el acceso a datos de monitoreo sensibles y configuraciones.
- Soporte de integración: Se conecta de forma nativa con herramientas populares para alertas, tickets, mensajería y gestión de infraestructura, agilizando tus flujos de trabajo.
- Retención histórica de datos: Almacena datos de monitoreo a lo largo del tiempo, permitiendo el análisis de tendencias, la planificación de capacidad y revisiones post-incidente.
- Descubrimiento dinámico de entidades: Detecta y registra componentes nuevos de infraestructura automáticamente a medida que el entorno crece o cambia.
- Gestión de secretos: Almacena y gestiona de forma segura credenciales o información sensible necesaria para comprobaciones, integraciones o tareas de automatización.
- Modo de mantenimiento: Permite suprimir temporalmente las alertas durante el mantenimiento planificado o interrupciones conocidas, evitando ruidos innecesarios.
- Soporte para plugins personalizados: Permite ampliar las capacidades de monitoreo con scripts o plugins adaptados a tus sistemas y necesidades específicas.
Características de IA comunes en las herramientas de monitoreo SRE
Más allá de las funcionalidades estándar mencionadas anteriormente, muchas de estas soluciones incorporan IA con características como:
- Detección de anomalías: Utiliza algoritmos de IA para identificar automáticamente patrones inusuales o desviaciones en las métricas del sistema, ayudando a los equipos a detectar incidentes antes de que se agraven.
- Alertas predictivas: Emplea aprendizaje automático para prever posibles caídas o problemas de rendimiento en función de datos históricos y tendencias, permitiendo la intervención proactiva.
- Análisis automatizado de causa raíz: Aplica IA para correlacionar eventos y registros, identificando con precisión la causa probable de los incidentes y reduciendo el tiempo de investigación manual.
- Reducción inteligente del ruido: Filtra y agrupa alertas relacionadas mediante IA, minimizando la fatiga de alertas al mostrar solo las notificaciones realmente relevantes y accionables.
- Priorización de incidentes: Utiliza IA para evaluar el posible impacto de los incidentes y clasificarlos automáticamente, ayudando a los equipos a enfocarse en los problemas más críticos primero.
Beneficios de las herramientas de monitoreo SRE
La implementación de herramientas de monitoreo SRE ofrece varios beneficios para tu equipo y tu empresa. Algunos de los que puedes esperar son:
- Respuesta más rápida a incidentes: Las alertas automáticas y flujos de trabajo de incidentes ayudan a tu equipo a detectar y resolver problemas rápidamente, minimizando el tiempo de inactividad.
- Mayor confiabilidad del sistema: La monitorización continua y las funciones de remediación proactiva favorecen una mayor disponibilidad y servicios más estables.
- Mejor planificación de los recursos: La retención histórica de datos y el análisis de tendencias permiten una mejor planificación de capacidad y optimización de la infraestructura.
- Menos fatiga por alertas: Las alertas inteligentes y la reducción de ruido garantizan que tu equipo solo reciba notificaciones realmente relevantes.
- Mejor seguridad y cumplimiento: El control de acceso basado en roles y la gestión de secretos protegen los datos sensibles y apoyan los requisitos normativos.
- Colaboración simplificada: La integración con herramientas de mensajería y tickets mantiene a todo el equipo alineado durante los incidentes y los análisis posteriores.
- Escalabilidad para entornos dinámicos: El descubrimiento dinámico de entidades y las integraciones flexibles facilitan la monitorización de infraestructuras en crecimiento o en cambio.
Costos y precios de las herramientas de monitoreo SRE
Seleccionar herramientas de monitoreo SRE requiere comprender los diferentes modelos de precios y planes disponibles. Los costos varían según las características, el tamaño del equipo, complementos y más. La siguiente tabla resume los planes habituales, sus precios promedio y las funciones típicas incluidas en las soluciones de herramientas de monitoreo SRE:
Tabla comparativa de planes para herramientas de monitoreo SRE
| Tipo de Plan | Precio Promedio | Funciones Comunes |
| Plan Gratuito | $0 | Monitoreo básico, alertas limitadas, soporte de la comunidad y acceso para un equipo pequeño. |
| Plan Personal | $5-$25/usuario/mes | Métricas ampliadas, alertas personalizadas, integraciones con herramientas de mensajería e informes básicos. |
| Plan Empresarial | $25-$75/usuario/mes | Respuesta avanzada ante incidentes, control de acceso basado en roles, retención histórica de datos y soporte mejorado. |
| Plan Enterprise | $75-$150/usuario/mes | Soporte para complementos personalizados, descubrimiento dinámico de entidades, funciones avanzadas de seguridad, incorporación dedicada y SLAs. |
Preguntas frecuentes sobre herramientas de monitoreo SRE
Aquí tienes respuestas a preguntas comunes sobre herramientas de monitoreo SRE:
¿En qué se diferencian las herramientas de monitoreo SRE de las soluciones de monitoreo tradicionales?
Las herramientas de monitoreo SRE se centran en prácticas de ingeniería de confiabilidad, ofreciendo funciones como respuesta automatizada a incidentes, presupuestación de errores y descubrimiento dinámico de la infraestructura. Las herramientas tradicionales pueden limitarse a rastrear métricas y enviar alertas, mientras que las SRE ayudan a los equipos a gestionar objetivos de confiabilidad y simplifican los flujos de trabajo de incidentes.
¿Pueden las herramientas SRE integrarse con las cadenas de herramientas DevOps existentes?
Sí, la mayoría de las herramientas SRE ofrecen integraciones con plataformas DevOps populares, sistemas de tickets, aplicaciones de mensajería y pipelines de CI/CD. Esto permite conectar los datos de monitoreo con la gestión de incidentes, colaboración y herramientas de automatización que ya usas.
¿Qué debo considerar al escalar herramientas de monitoreo SRE para un entorno en crecimiento?
Busca soluciones que soporten descubrimiento dinámico de entidades, integraciones flexibles y retención escalable de datos. Asegúrate de que la herramienta pueda manejar un mayor volumen de datos, más usuarios e infraestructura compleja sin problemas de rendimiento ni aumentos excesivos de costos.
¿Existen riesgos de seguridad al implementar herramientas de monitoreo SRE?
Sí, como con cualquier solución de monitoreo, existen consideraciones de seguridad. Elige herramientas con sólidos controles de acceso, almacenamiento de datos cifrado y registro de auditoría. Revisa cómo maneja la herramienta las credenciales sensibles y asegúrate de que se alinea con las políticas de seguridad de tu organización.
¿Cuánto tiempo toma implementar una herramienta de monitoreo SRE?
El tiempo de implementación varía según la herramienta y la complejidad del entorno. Muchas soluciones ofrecen guías rápidas, plantillas y soporte para la incorporación, por lo que equipos pequeños pueden comenzar en horas o días. Entornos más grandes o complejos pueden requerir mayor planificación y un despliegue por fases.