DevOps Metrics to Measure the Success of Your Processes


So, you started adopting DevOps in your company. But how can you tell if it’s improving your processes? You have to measure the success somehow and can achieve this by monitoring some key DevOps metrics.
There are many ways to assess the quality of a system or application, but in this article, I’ll focus on key metrics that help evaluate the quality of your processes. By tracking these indicators, you can gain deeper insights into your strengths and weaknesses, improve your DevOps best practices, and leverage the right tools and software for continuous improvement.
Why Are DevOps Metrics Important?
As discovered above, shared goals and metrics can be challenging for teams rolling out DevOps within a business. Without DevOps metrics, there would be no testing or measuring and no improvements to the development. It would just be iterations of the same software based on hunches and ideas, throwing it out into the abyss, and then trying something new. Without feedback or product success metrics to understand how something performs, there is no direction.
For example, finance departments want to keep costs as low as possible, whereas developers want to keep performance as high as possible. These two goals may not align unless risks have been assessed and the teams understand each others’ targets.
Where your developers may choose to ship an incomplete product and deal with it later, the cost of this impact causes technical debt. Implementing DevOps can align the goals and strategies of both teams, and you can help your developers understand the cost impact of their technical decisions.
This is just one small part of DevOps and the importance of shared metrics.
5 Key DevOps Metrics (DORA)
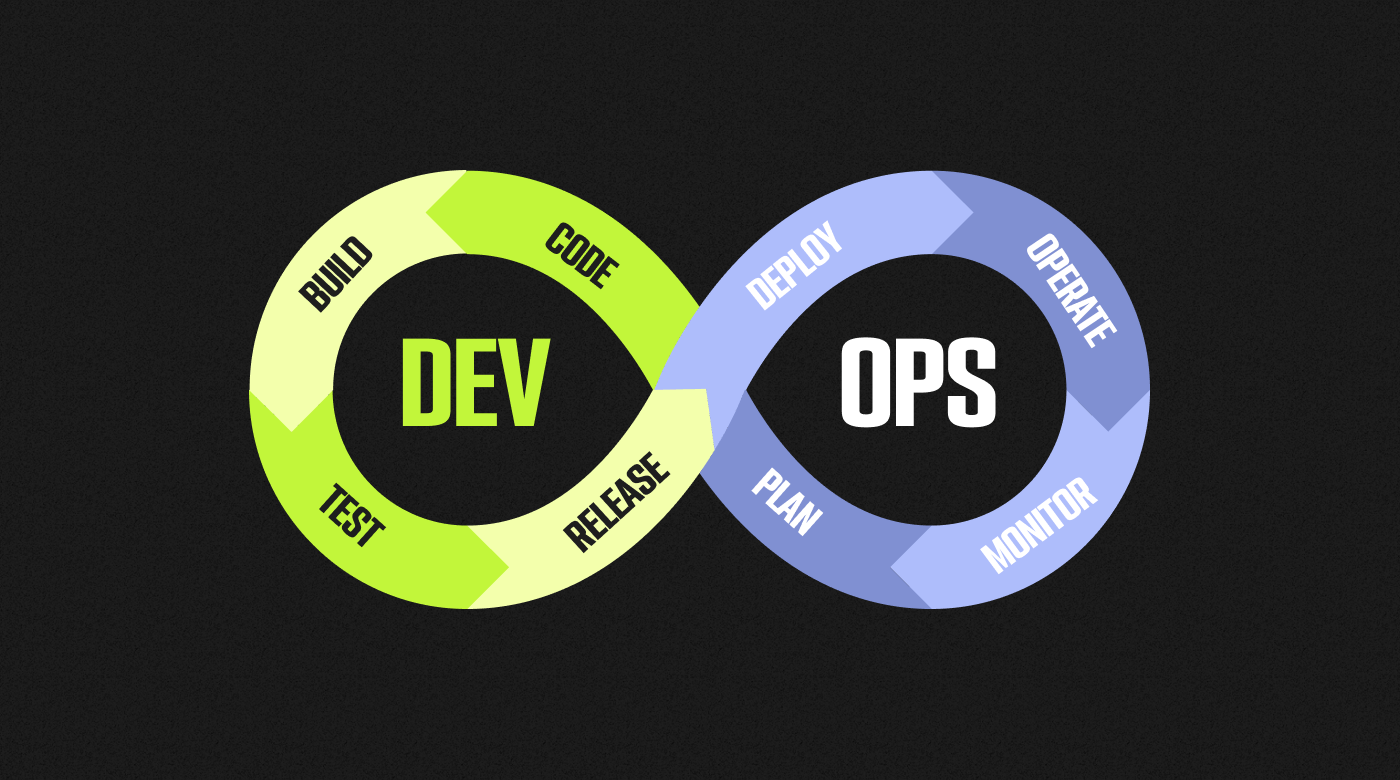
Implementing DevOps and understanding principle-based frameworks is one thing, but DevOps metrics are where you really start to see the benefits of this collaborative approach to the software development life cycle. Like most business strategies, there are endless metrics you could choose to measure for growth, depending on your industry, audience, and goals.
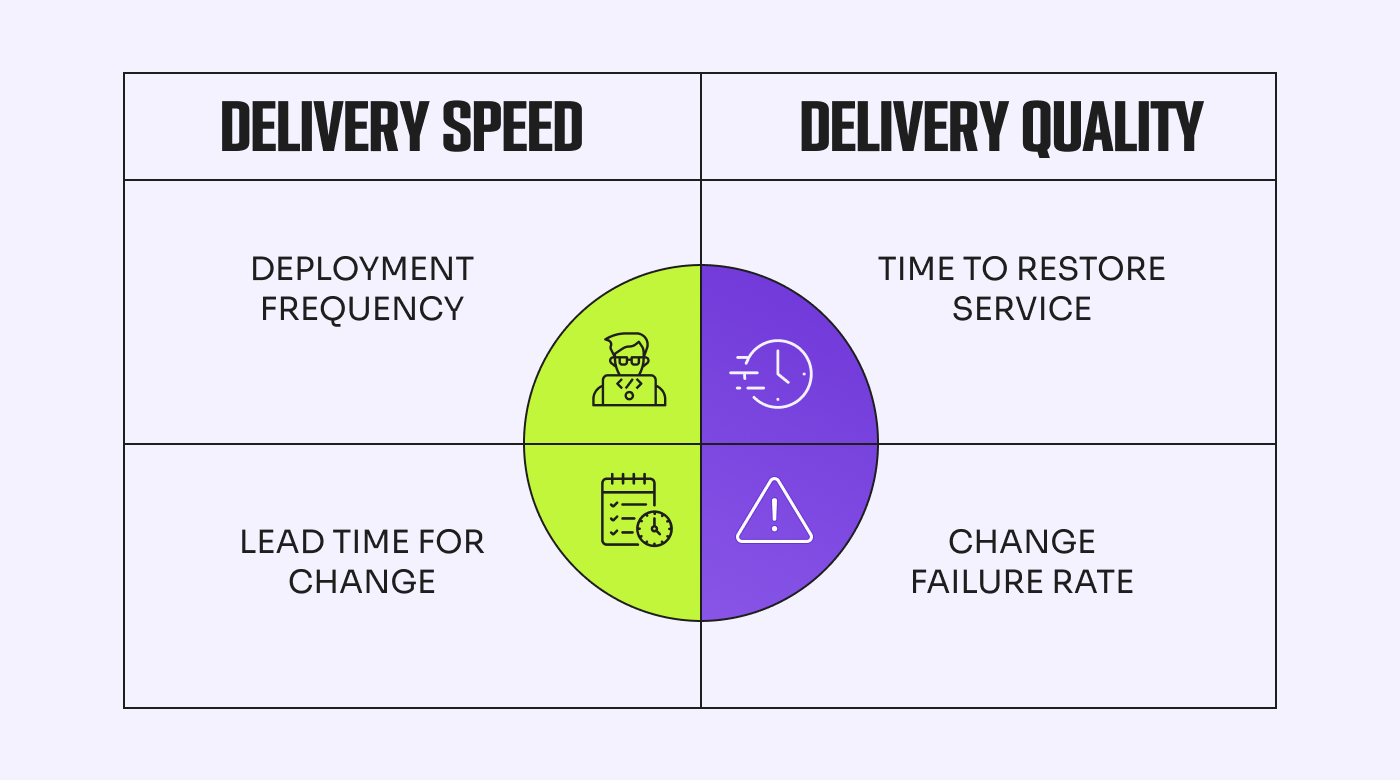
Google Cloud’s DevOps Research and Assessment (DORA) team is the longest-running research team of its kind. They originally found four key metrics to measure the performance of the ‘elite’ in DevOps. However, there has since been a fifth key metric added to the mix, and their cluster analysis only detects three levels of DevOps team: high, medium, and low, with ‘elite’ being a thing of the past.
1. Deployment Frequency (DF)
DF measures how often you successfully release to production. This metric is about consistency and is an excellent indication of goal completion.
Teams under the ‘elite’ category would consistently deploy to production multiple times daily, whereas low-performing teams would be closer to once every six months.
Improving DF is as simple as releasing several minor updates. The main benefit of doing this is highlighting any process blockers, bottlenecks, or complex projects requiring attention. Larger teams may prefer deploying at regular intervals by building Agile release trains; this will help to remove the overwhelm of extreme pace and many people.
2. Lead Time for Changes (LTC)
LTC refers to the time it takes a commit to get into production. This metric is a good indicator of team responsiveness and agility as it measures how quickly they can act on user needs and demands.
The legacy ‘elite’ standard would aim for less than one day for LTC, whereas lower-performing teams could take more than six months. Performing at the lower end of the scale for LTC is likely due to inefficient processes.
You can improve this metric by improving automation processes, especially testing. By enhancing your continuous integration and continuous delivery (CI/CD) pipeline, you can get updates to production faster. However, one risk to watch out for here is sustainability. If your team cannot sustain this improved pace, you could face poor user experience and potential security vulnerabilities.
3. Change Failure Rate (CFR)
CFR is the percentage of deployments causing a failure in production. Failure could be downtime, rollbacks, or degraded service. This metric shows you the effectiveness of your team when deploying changes.
Elite performance benchmarks are 0-15%, where high, medium, and low performance all fall under 16-30%.
Improving CFR is about quality over quantity. Companies release varying numbers of changes and, therefore, have varying numbers of failures. However, the highest-quality modifications will result in fewer failures, whether they deploy changes twice a year or twice a day.
4. Mean Time to Recovery (MTTR)
MTTR is how long your team takes to restore service from a failure or disruption. Not only does this metric measure your team's agility, but it’s also a good gauge of the stability of your software.
If you’re aiming for an ‘elite’ level, you’d need to be looking at less than an hour for MTTR. Low-performing teams can take over six months.
You can boost MTTR by focusing on minor, quick releases, making failures easier to find and fix. You could also explore feature flags to give your team more control — especially if they’re experimental.
There’s one more metric to cover.
5. Reliability
Bonus metric number five is reliability. This metric was discovered later by the DORA team (2021) due to previously measuring availability as a benchmark for reliable software. However, it was decided that reliability better encompasses availability, latency, performance, and scalability. It is essentially the inclusion of measuring operational performance alongside development.
Other Common DevOps Metrics

Cycle Time
Cycle time is the total time from starting a task to final delivery. On the surface, it tracks the working speed of your team. However, you can dive deeper into this metric to find bottlenecks like long queue times and long-running pull requests.
A shorter cycle time indicates an efficient workflow, reducing bottlenecks and increasing development speed.
How to Measure Cycle Time
Cycle time is calculated by tracking timestamps of commits, code merges, and deployments in tools like GitHub, GitLab, or Jenkins.
Cycle Time = Deployment Time - Commit Time
To improve Cycle Time, teams should:
- Optimize CI/CD pipelines for faster integration and deployment.
- Automate builds and testing.
- Improve collaboration between development and operations teams.
- Reduce dependencies between tasks to minimize bottlenecks.
Mean Time to Detection (MTTD)
This is the average time it takes for your team to acknowledge a failure. A low MTTD indicates efficient monitoring and alerting systems, allowing for quick incident response and resolution.
How to Measure MTTD
MTTD can be measured by tracking the average time between an issue's occurrence and its detection by monitoring tools or users' reporting. Lowering MTTD involves improving automated monitoring, refining alerting mechanisms, and ensuring proactive issue detection.
Passed Automated Tests
It’s good to strive for good test coverage, especially automated tests. And here, I’m talking about unit, integration, UI, and end-to-end tests. However, good coverage is not enough to ensure the quality of the software. What matters is the percentage of these tests that pass.
Of course, the goal is to have a percentage of passed tests as close to 100% as possible. Monitoring this metric can also reveal how often new developments break existing tests.
How to Measure the Percentage of Passed Automated Tests
The calculation is a simple percentage: multiply the number of passed tests by 100, then divide by the total number of tests. You can get this information from the pipeline tool that runs the builds (Jenkins, Azure DevOps, CircleCI, etc.).
The number can be a good indicator of the quality of the product. However, it can also be tricky if you have flaky or unreliable tests.
Defect Escape Rate
The defect escape rate is how many bugs are missed during testing and released into production – how many ‘escaped.’ This metric is ideal for tracking if you want to improve testing and automation processes.
In a utopian world, all our apps would be defect-free. However, that’s rarely the case. Ideally, defects are caught during the development and testing phases of the DevOps process, not in production.
This metric helps to determine the efficacy of your testing processes and the overall quality of your program. A high defect escape rate suggests that procedures must be improved and that more automation is needed, whereas a low rate (ideally near zero) implies a high-quality application.
How to Measure the Defect Escape Rate
To measure this, you can use your bug tracking tool and, for each open defect, track where it has been detected—whether the testing or the production environment (or any other environment you might be using, such as UAT).
Customer Tickets
Customer happiness is a driving element for innovation, and with good reason: a flawless user experience is good customer service and typically corresponds to a rise in sales. As a result, client tickets, especially during the ticket escalation process, are a good indicator of how well your DevOps transition is going.
Customers should not act as quality control by reporting defects and bugs. Hence, a decrease in customer tickets is a good sign of good application performance.
CPU and Memory Usage
Identifies resource utilization trends.
Response Time
Measures the time it takes for the application to respond to requests.
Error Rate
Tracks the number of failed requests over time.
Throughput
Measures the number of requests processed per second.
API Request Latency
Measures the delay between sending a request and receiving a response.
Database Query Performance
Tracks query execution times and potential bottlenecks.
User Behavior Analytics
Monitors feature adoption and engagement trends.
Mean Time Between Failures (MTBF)
MTBF measures the average time elapsed between system failures, downtime, or incidents. This metric evaluates the reliability and stability of your software systems, highlighting the effectiveness of your preventive maintenance and error mitigation strategies.
Time to Mitigate (TTM)
The time taken to fix an issue once detected is the TTM. This metric helps assess incident response and resolution processes, indicating the efficiency of your teams in addressing and recovering from issues.
Change Lead Time (CLT)
CLT provides a benchmark for the end-to-end change implementation process, including development, testing, review, and deployment. A shorter CLT signifies faster delivery cycles and increased agility.
How to Set KPIs With DevOps Metrics
Now that you have a good understanding of the metrics you can use to implement and optimize DevOps in your business, you’lll want to explore key performance indicators (KPIs) to set some targets and benchmarks for your team.
Metrics vs. KPIs
You may be wondering what the difference between metrics and KPIs is. A metric is what you measure. It’s a quantifiable measurement that provides data about a specific performance aspect. Not all metrics are necessarily tied to specific goals or targets.
On the other hand, KPIs are a type of metric strategically selected and defined to reflect the most critical aspects of performance and progress toward strategic goals. KPIs are typically tied to objectives and often have associated targets, thresholds, or benchmarks that need to be achieved.
Setting KPIs for Your DevOps Team
The first step to setting KPIs for your DevOps team is linking DevOps metrics with your business strategy and goals. By prioritizing the most essential metrics to track, you can begin to establish targets and benchmarks for continuous improvement. Selecting the right metrics requires considering your company size, product, and market. Focus on what will provide the most actionable insights, avoiding the common pitfall of metric overload.
Monitoring your KPIs is just as important as setting them. Explore data visualization tools to provide your team real-time data on intuitive dashboards. This ensures complete visibility, provides accountability, and allows everyone to work together on shared goals, aligning development and operations teams and supporting the adoption and maturity of DevOps.

Taking the DORA core metrics, we can see the benchmarks for each metric based on the elite, high, medium, and low-performing teams. This table can help you set KPIs for your own business, depending on what you qualify as a priority.
When setting your KPIs, considering your team and business carefully without comparing them to other companies is best. If we look at CFR as an example, the benchmark is the same for high, medium, and low performance. This will depend heavily on your deployment frequency but can also affect it the other way around. If your team is spending all their time fixing failures, they spend less time developing and releasing updates. KPIs may also change as your DevOps team matures. Airtight automation and testing processes should automatically mean you can raise the bar on your targets.
How to Use DevOps Metrics to Scale
With the global DevOps market expected to hit $24.71 billion by 2027 (a compound annual growth rate of 22.9%, based on the $10.84 billion market size in 2023), take this as your sign if you’re looking for the best time to begin implementing it into your business.
DevOps not only accelerates development, reducing time-to-market, but it also improves collaboration by eliminating silos, enhances quality with continuous testing and feedback loops, and utilizes resources efficiently, which saves money. Finally, it is easily scalable, supporting business growth to new limits, with 83% of IT decision-makers accessing higher business value by implementing DevOps in 2021.
Performance Measurement and Continuous Improvement
Monitoring performance is the key to scaling a business that utilizes DevOps. It’s a fast-paced approach with a constant production workflow, so measuring and reporting should be just as frequent. DevOps metrics allow you to track the performance of your development and delivery processes. By quantifying key aspects such as deployment frequency, lead time, and change failure rate, you can identify bottlenecks, inefficiencies, and areas for improvement. This enables you to optimize workflows and processes often.
Tracking metrics like change failure rate and mean time to recovery helps you identify trends that allow you to detect issues early. This proactive approach means you can take corrective measures and minimize the impact on customers, providing reliability – another vital ingredient for scaling at high quality.
Finally, using DevOps metrics will help to mature your DevOps team by opening a culture of continuous improvement. Feedback loops promote learning and growth; there must always be room for experimenting with different approaches.
Which DevOps Metrics Support Business Growth?
When setting KPIs, most metrics should be considered within your team and positioned for growth rather than compared with other businesses and groups at different maturity levels.
For example, a low LTC could show that your team is efficient, but if they cannot maintain the pace, it’s not sustainable and could eventually affect user experience. This metric should be measured over time rather than setting a KPI to match a high-performing, or even elite, mature DevOps team. Setting KPIs to reduce LTC month-on-month, quarterly, or yearly demonstrates growth within your team and business.
CFR is a valuable metric because not everyone has the same number of failures or issues, but by putting a percentage on this, you can measure how successful your deployments are. Your team may have very few failures if they release changes infrequently, but if each release is causing an issue, the CFR will be very high. If you follow CI/CD practices, you may see a higher number of failures, but if your CFR is low, you will have an advantage because you have speed and quality supporting growth. MTTR should also be measured over time to ensure steady growth.
DORA found that teams of all development performance levels saw better results when focusing on operational performance. This could mean setting KPIs for incident reports or open tickets, application uptime, and availability.
A high number of open tickets could represent an issue with your customer satisfaction, but aiming for a decrease over time reflects growth in this area. You could delve deeper and measure response and queue times to accelerate the improvement of this metric.
The one metric that combines both development and operations wholly as a DevOps team is the cycle time. This opens the floor for building a culture of feedback and growth. As other metrics improve and automation matures, you should expect cycle time to reduce. If your customer service is high and development failures low, you’ve found a winning combination to scale your business.
Final Thoughts
Like any other methodology, DevOps is only successful if implemented correctly. And you can’t know the success until you know how to use DevOps metrics.
Of course implementing DevOps metrics has its challenges. It requires a strategic mindset, collaborative culture, and commitment to continuous improvement. However, the results are optimized workflows and processes on which you can build a solid foundation for scaling your business.
If you want to stay updated with news and articles, subscribe to our newsletter!
