Die 25 besten Tools zur Leistungsüberwachung für SaaS

10 Bestes Performance-Monitoring-Tools Kurzliste
Here's my pick of the 10 best software from the 25 tools reviewed.


Performance-Monitoring-Tools helfen Ihnen dabei, zu verfolgen, wie Ihre Systeme und Anwendungen laufen, damit Sie Probleme frühzeitig erkennen und alles reibungslos läuft.
Viele Teams suchen nach solchen Tools, wenn sie mit langen Ladezeiten, unvorhersehbarer Performance oder Schwierigkeiten bei der Ursachenfindung von Problemen zu kämpfen haben. Ohne das richtige Tool riskieren Sie, stundenlang vagen Warnmeldungen hinterherzujagen oder Leistungseinbrüche komplett zu übersehen.
Ich habe Teams dabei unterstützt, Performance-Monitoring-Systeme einzurichten, die tatsächlich nützliche Daten liefern und das Rätselraten reduzieren. Dieser Leitfaden basiert auf diesen Erfahrungen und hilft Ihnen, ein Tool zu wählen, das zu Ihrem Workflow passt und Sie über wichtige Faktoren informiert hält.
Why Trust Our Software Reviews
Bestes Performance-Monitoring-Tools Zusammenfassung
Diese Vergleichstabelle fasst Preisinformationen zu meinen besten Performance-Monitoring-Tools zusammen, damit Sie das passende für Ihr Budget und Ihre geschäftlichen Anforderungen finden.
| Tool | Best For | Trial Info | Price | ||
|---|---|---|---|---|---|
| 1 | Best for automatic network mapping | 14-day free trial available | Pricing upon request | Website | |
| 2 | Best for session replay insights | Free plan + free demo available | From $26/month (billed annually) | Website | |
| 3 | Best for hybrid cloud monitoring | Free demo + 30-day free trial available | From $9/month (billed annually) | Website | |
| 4 | Best for code-level insights | 30-day free trial + free demo + free plan availabl | From $199/year | Website | |
| 5 | Best for network performance monitoring | Free demo available | From $245/25 devices | Website | |
| 6 | Best for real-time error tracking | 14-day free trial + free demo available | From $49/host/month (billed annually) | Website | |
| 7 | Best for AI-driven diagnostics | Free demo + 15-day free trial available | From $7/host/month (billed annually) | Website | |
| 8 | Best for automated hybrid infrastructure monitoring | Free 15-day trial | From $16/hybrid unit/month | Website | |
| 9 | Best for comprehensive IT infrastructure monitoring | Free 30-day trial | From $20/user/month (billed annually) | Website | |
| 10 | Best for uptime and website speed insights | 30-day free trial + demo available | From $10/month | Website |
-

Site24x7
Visit WebsiteThis is an aggregated rating for this tool including ratings from Crozdesk users and ratings from other sites.4.6 -
Docker
Visit WebsiteThis is an aggregated rating for this tool including ratings from Crozdesk users and ratings from other sites.4.6 -
Pulumi
Visit WebsiteThis is an aggregated rating for this tool including ratings from Crozdesk users and ratings from other sites.4.8


Bestes Performance-Monitoring-Tools Bewertungen
Unten finden Sie meine detaillierten Zusammenfassungen der besten Performance-Monitoring-Tools, die es auf meine Kurzliste geschafft haben. Meine Bewertungen bieten einen detaillierten Einblick in die wichtigsten Funktionen, Vor- und Nachteile, Integrationen und idealen Anwendungsfälle jedes Tools, um Ihnen bei der Auswahl zu helfen.

Auvik is a network management tool that provides performance monitoring features to help you track network performance and optimize your infrastructure. It's designed to give you a clear view of your network's health, enabling you to quickly identify and resolve issues.
Why I Picked Auvik: One of the reasons I picked Auvik as a performance monitoring tool is its ability to automatically map devices and connections. This feature allows you to see your entire network layout, making it easier to pinpoint where issues might arise. Additionally, Auvik monitors hardware health and tracks performance metrics across various device types from over 700 vendors, ensuring you have comprehensive data to keep your network running smoothly. Another feature that stands out is Auvik's customizable alerts. These alerts allow you to set specific thresholds and receive notifications when something goes awry, so you're always in the loop and can take action promptly. The platform also supports remote management and configuration backups, which means you can manage your network from anywhere and ensure that your data is secure and recoverable.
Standout Features & Integrations:
Features include intuitive network mapping, which provides a visual representation of your network's structure, helping you quickly understand its layout. Auvik also offers global alert settings, allowing you to configure alerts across your entire network with ease. Moreover, the platform supports configuration comparisons, enabling you to track changes and identify potential issues before they escalate. Integrations include ConnectWise, Cisco, Datto, ServiceNow, Slack, Microsoft Intune, Salesforce, Fortinet, Sophos, Splunk, Palo Alto Networks, and Zendesk.
Pros and Cons
Pros:
- Network mapping improves troubleshooting efficiency
- Automatic configuration backups ensure data safety
- Real-time monitoring enhances performance tracking
Cons:
- Resource-intensive for large deployments
- Limited customization options for users
New Product Updates from Auvik
Auvik Adds HA Pair Monitoring, Improves Ping Alerts, & Expands SaaS Integrations
Auvik introduces HA Pair Monitoring for Fortinet firewalls, improved Service Status alerts for Internal Ping Checks, and new SaaS integrations with ServiceNow, GitLab, ClickUp, and Notion. These updates improve network monitoring visibility and provide better insights into SaaS license usage. For more information, visit Auvik’s official site.
 .
.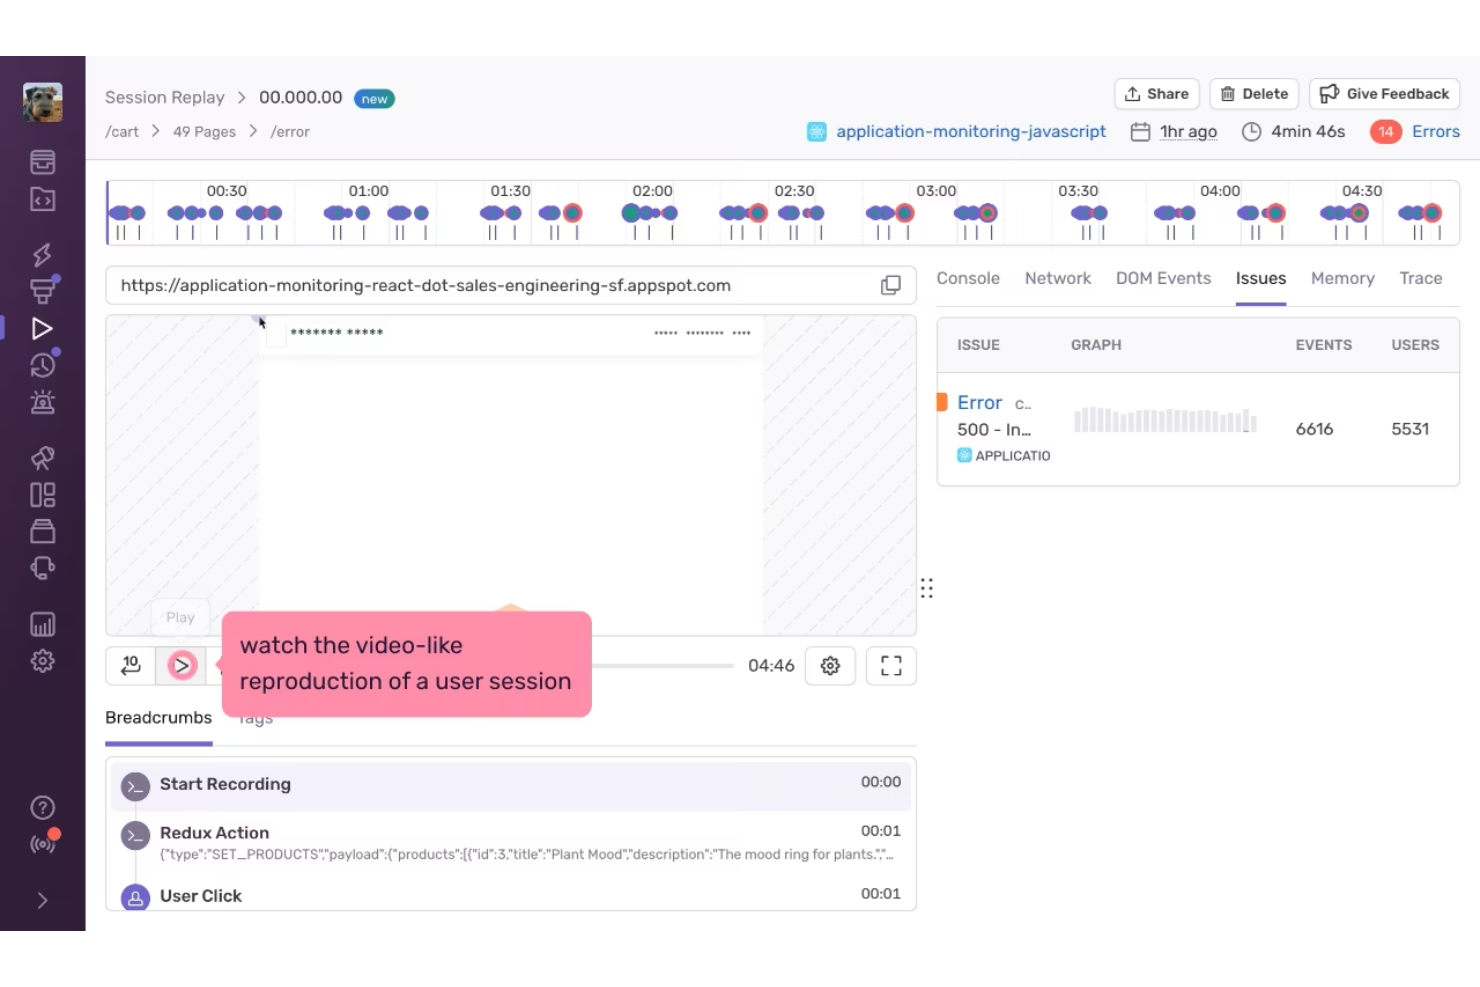
Sentry is a performance monitoring tool used by developers and businesses to understand how their applications behave in real use, with added insight from session replay. It offers error tracking, tracing, and replay tools that help teams see where users encounter issues and slowdowns. By giving clearer visibility into performance problems, Sentry helps teams reduce downtime and improve the overall user experience.
Why I Picked Sentry
I picked Sentry for its session replay insights, which let teams see exactly what users experience when performance issues occur. This makes it easier to connect errors and slowdowns to real user actions, rather than relying solely on logs or metrics. Combined with error tracking and tracing, Sentry helps teams identify and fix problems faster with clearer context.
Sentry Key Features
In addition to session replay insights, Sentry offers:
- Code Coverage: Offers insights into which parts of your code are tested, helping prioritize tests and streamline development efforts.
- Mobile App Crash Reporting: Supports mobile platforms by identifying and resolving crash issues, ensuring a smooth user experience on mobile devices.
- AI Observability: Monitors AI applications, aiding in the detection and resolution of performance issues specific to AI-driven functionalities.
Sentry Integrations
Integrations include GitHub, Slack, Jira, Bitbucket, Trello, GitLab, PagerDuty, Microsoft Teams, and Asana.
Pros and Cons
Pros:
- Session replay helps teams understand issues from the user’s perspective
- Strong error tracking with clear stack traces
- Alerts help teams respond quickly to critical issues
Cons:
- Not a full infrastructure monitoring or observability platform
- Session replay may require careful setup to manage data volume and privacy
New Product Updates from Sentry

Sentry Enhances Alerting Across Uptime and Metrics
Sentry introduces expanded alert configuration for Uptime Monitors and adds alerting support to its Metrics open beta. These updates improve issue detection by enabling more flexible monitoring conditions and proactive alerts. For more information, visit Sentry’s official site.
 .
.
Site24x7 offers businesses a comprehensive tool to monitor hybrid cloud environments, ensuring optimal performance and uptime. Given the increasing adoption of hybrid cloud architectures by businesses, Site24x7's specialized tools fill a vital niche in monitoring both on-premises and cloud components cohesively.
Why I Picked Site24x7: After comparing various monitoring tools, Site24x7 stood out for its dedicated focus on hybrid cloud environments. I determined that its capability to holistically monitor both on-premises and cloud infrastructure sets it apart from its competitors. This unique emphasis is why I regard Site24x7 as the best choice for organizations looking to oversee their hybrid cloud setups.
Standout Features & Integrations:
Site24x7 boasts features that include real-time performance metrics, automated incident remediation, and advanced AIOps capabilities. When it comes to integrations, the platform smoothly connects with leading cloud services providers, such as AWS, Microsoft Azure, and Google Cloud, facilitating broader oversight across various services.
Pros and Cons
Pros:
- Strong AIOps capabilities for enhanced insights
- Automated incident remediation reduces manual intervention
- Tailored for hybrid cloud environments
Cons:
- Reporting interface could be more intuitive for certain users
- Initial setup may require a learning curve
- Some advanced monitoring features are limited to premium tiers
New Product Updates from Site24x7

Site24x7 Enhances Monitoring with AI-Powered Features
Site24x7 introduces new AI-powered capabilities to improve monitoring and troubleshooting. These updates help teams identify issues faster and gain insights more efficiently across their systems. For more information, visit Site24x7’s official site.
 .
.
ManageEngine Applications Manager is a performance monitoring and observability solution that provides full-stack visibility into cloud and on-premise applications. It supports over 150 technologies, helping IT teams detect and resolve performance bottlenecks before they affect users.
Why I Picked ManageEngine Applications Manager: I like its ability to provide deep diagnostics through code-level insights and distributed transaction tracing. You can monitor application performance across various programming languages, including Java, .NET, Python, and Ruby. With application service maps, you get a clear view of dependencies, helping your team pinpoint slow transactions and optimize code execution. Additionally, real user monitoring offers detailed front-end performance metrics based on actual user traffic, including response times by geography, browser, and network.
Standout Features & Integrations:
Other features include synthetic transaction monitoring, which simulates user interactions using Selenium-based test scripts to proactively check website performance from multiple locations. Additionally, automated discovery and dependency mapping help you visualize relationships between applications, databases, and services, dynamically updating as your environment changes. Integrations include ManageEngine ServiceDesk Plus, ServiceNow, Site24x7, AlarmsOne, Slack, Prometheus, AWS, Google Cloud, Microsoft Azure, Oracle, and MySQL.
Pros and Cons
Pros:
- Simplifies management of applications and their relationships
- Real-time alerting system helps teams respond promptly to issues
- Monitors a wide range of applications and infrastructure components
Cons:
- The tool can be resource-intensive
- Setting up the tool to meet specific needs can be challenging
New Product Updates from ManageEngine Applications Manager

ManageEngine Adds Amazon VPC Monitoring Support
ManageEngine Applications Manager now supports Amazon VPC monitoring, allowing users to track network health and activity efficiently. For more information, visit ManageEngine Applications Manager's official site.
 .
.
ManageEngine OpManager is a network performance monitoring tool that helps you keep an eye on your network's health and performance. It monitors devices like routers, switches, servers, and virtual machines to ensure they're running smoothly.
Why I Picked ManageEngine OpManager: I chose OpManager for its ability to monitor network performance in real-time. It tracks important metrics such as latency, packet loss, and response time, giving you a clear picture of your network's status. This real-time monitoring means you can detect and address issues promptly, helping to prevent downtime and keep your operations running smoothly. I also like that OpManager offers over 100 built-in reports that you can tailor to your needs, providing insights into network availability, usage trends, and performance analysis.
Standout Features & Integrations:
Other features include network traffic analysis, which allows you to monitor bandwidth usage and identify top users and network configuration management, enabling you to schedule configuration backups and track changes. It also offers IP address and switch port management, helping you manage IP addresses and map switch ports to devices. Some integrations include ADManager Plus, ADAudit Plus, ADSelfService Plus, M365 Manager Plus, PAM360, Password Manager Pro, ServiceDesk Plus, and Log360.
Pros and Cons
Pros:
- Comprehensive monitoring capabilities
- Real-time alerting
- Scalability for growing networks
Cons:
- Complex initial setup
- Could offer more integration options
New Product Updates from ManageEngine OpManager
ManageEngine OpManager Vendor Templates and NCM XML Import
ManageEngine OpManager introduces enhanced vendor template integration and device template import for the NCM module using XML files. This update helps teams improve device classification and speed up configuration workflows. For more information, visit ManageEngine OpManager’s official site.
 .
.
Atatus specializes in giving its users a clear and immediate insight into errors as they happen, so there's no delay in troubleshooting. This tool thrives on its ability to catch errors in real time, providing clarity and swift action when systems glitch or break.
Why I Picked Atatus: Out of all the tools I evaluated, Atatus struck a chord due to its singular focus on real-time error detection. I chose Atatus because, in my opinion, it offers a clear-cut advantage when it comes to immediate error tracking, setting it apart from many other monitoring tools. The essence of its prowess lies in its capability to reduce downtime and maximize operational efficiency, which is why I determined it's best for real-time error tracking.
Standout Features & Integrations:
Atatus offers application performance metrics alongside its error tracking, meaning users get a comprehensive view of application health. Their alerts system is both prompt and customizable, ensuring the right people know about issues immediately. On the integration front, Atatus supports a range of platforms including Slack, JIRA, and Webhooks, allowing for efficient communication and issue resolution across teams.
Pros and Cons
Pros:
- A broad range of integrations for team communication
- Comprehensive application performance metrics
- Immediate error detection and alerts
Cons:
- Limited features in the basic pricing plan
- An interface may seem complex for beginners
- Might require some setup for specific environments

Dynatrace is a comprehensive application performance monitoring solution that delves deep into your IT environment to diagnose issues. What sets it apart is its AI-powered engine that facilitates precise diagnostics and offers actionable insights.
Why I Picked Dynatrace: When selecting monitoring platforms for inclusion, Dynatrace's robust AI capabilities quickly caught my attention. I judged its diagnostic precision, powered by AI, to be a key differentiator from many other tools in the market. In an era where AI-driven insights are revolutionizing IT operations, Dynatrace stands out as particularly adept at leveraging this technology.
Standout Features & Integrations:
Dynatrace shines with features like real-user monitoring, infrastructure monitoring, and its unique "Davis AI" engine which automates anomaly detection and root cause analysis. It provides integrations with a wide array of platforms, including AWS, Azure, Kubernetes, and many more, offering a well-rounded monitoring experience.
Pros and Cons
Pros:
- User-friendly interface and visualizations
- Comprehensive monitoring across multiple platforms
- Exceptional AI-driven diagnostic capabilities
Cons:
- Some users may find the configuration process intricate.
- The extensive range of features can have a steeper learning curve for newcomers
- Pricing might be on the higher side for small businesses

LogicMonitor offers a cloud-based platform that specializes in monitoring and observing hybrid infrastructures, encompassing both on-premises systems and cloud-based deployments. Its automated approach to tracking the performance of various infrastructure components makes it particularly valuable for companies with complex and diverse environments.
Why I Picked LogicMonitor: When choosing monitoring solutions for this list, I judged their capabilities, and LogicMonitor consistently stood out. What differentiates it from others is its automation capabilities, especially for hybrid setups, combining both traditional and cloud environments.
In my opinion, its proficiency in this aspect positions it as the best for automated hybrid infrastructure monitoring.
Standout Features & Integrations:
Key features of LogicMonitor include automated device discovery, dynamic thresholding, and advanced alerting mechanisms. Integration-wise, LogicMonitor has compatibility with a plethora of services such as AWS, Azure, Cisco, VMware, and many more, ensuring broad coverage across multiple platforms.
Pros and Cons
Pros:
- Supports a wide array of integrations
- Robust automation features reduce manual intervention
- Comprehensive hybrid infrastructure monitoring
Cons:
- Some users report occasional lags in alert notifications.
- Advanced features might be overwhelming for smaller deployments
- The interface can be intricate for beginners

With Nagios, users gain a wide-lens view of their entire IT infrastructure, ensuring that every component, from servers to applications, functions optimally. Recognizing the vital role of reliable IT infrastructure in modern businesses, Nagios has tailored its tool to provide a holistic monitoring solution.
Why I Picked Nagios: In my journey of evaluating monitoring tools, Nagios consistently appeared as a top contender. I chose Nagios because of its comprehensive approach to IT infrastructure monitoring, ensuring no component goes unchecked.
This all-encompassing nature is why I've judged Nagios to be best for businesses wanting thorough IT infrastructure oversight.
Standout Features & Integrations:
Nagios excels in providing both visual and detailed reports, granting IT teams a clear picture of their infrastructure's health. Its alerting system is particularly robust, immediately notifying teams of any potential disruptions. On the integration front, Nagios supports a variety of plugins and has a strong community backing, ensuring compatibility with a wide array of systems and tools.
Pros and Cons
Pros:
- Extensive plugin support and active community backing
- Proactive alerting system for timely issue resolution
- Detailed and visual reporting capabilities
Cons:
- Requires consistent maintenance for optimal performance
- The interface might feel dated to some users
- Initial setup can be complex for newcomers

Pingdom provides businesses with invaluable insights into website uptime, performance, and speed. Recognizing that a site's accessibility and loading speed can significantly influence user experience and conversions, Pingdom offers specialized tools to track these crucial metrics.
Why I Picked Pingdom: Throughout my assessment of web monitoring tools, Pingdom constantly emerged as a leader. I chose Pingdom primarily because it specializes in delivering precise uptime and speed metrics, which are crucial for any online business. The depth and accuracy of its insights validate my judgment that it's best for obtaining clear website speed and uptime data.
Standout Features & Integrations:
Pingdom shines with its real-time performance monitoring, providing instant alerts the moment issues are detected. Its root cause analysis feature offers valuable insights to address potential problems swiftly. Integration-wise, Pingdom supports several platforms, including Slack, Opsgenie, and PagerDuty, ensuring teams are promptly notified of any discrepancies.
Pros and Cons
Pros:
- Supports multiple integrations for enhanced team communication
- Comprehensive root cause analysis for swift problem-solving
- Real-time monitoring and instant alerts
Cons:
- Some advanced features only available in higher-priced tiers
- Limitations on the number of checks in basic plans
- The interface might be slightly complex for beginners
Weitere Performance-Monitoring-Tools
Nachfolgend finden Sie eine Liste weiterer Performance-Monitoring-Tools, die es auf meine Auswahlliste geschafft haben, aber nicht in die Top 10 aufgenommen wurden. Sie sind definitiv einen Blick wert.
- New Relic
For DevOps and SRE collaboration
- AppDynamics
For end-to-end business transaction tracing
- Datadog
For integrated cloud-scale monitoring
- SolarWinds AppOptics
For granular application performance metrics
- Paessler PRTG
For flexible network monitoring options
- Sematext
For centralized logs and metrics
- Dotcom Monitor
For complex, scripted monitoring for APIs
- Coralogix
Good for real-time log analytics and insights
- Raygun
Good for error tracking and crash reports
- Zabbix
Good for open-source server monitoring
- Prometheus
Good for real-time alerting and time series analysis
- LogRocket
Good for understanding user behaviors in web apps
- Stackify Retrace
Good for developers seeking in-depth code insights
- Catchpoint
Good for user experience and network monitoring
- IBM Instana
Good for end-to-end application visibility


Auswahlkriterien für Performance-Monitoring-Tools
Bei der Auswahl der besten Performance-Monitoring-Tools für diese Liste habe ich typische Anforderungen und Schmerzpunkte von Käufern wie Skalierbarkeit und Integrationsfähigkeit berücksichtigt. Außerdem habe ich dieses Bewertungsschema genutzt, um meine Analyse strukturiert und objektiv zu gestalten:
Kernfunktionalität (25% der Gesamtwertung)
Um in diese Liste aufgenommen zu werden, musste jede Lösung diese gängigen Anwendungsfälle abdecken:
- Anwendungsleistung überwachen
- Serververfügbarkeit verfolgen
- Echtzeit-Analysen bereitstellen
- Warnmeldungen bieten
- Unterstützung für Multi-Plattform-Umgebungen
Besondere Zusatzfunktionen (25% der Gesamtwertung)
Um die Auswahl weiter einzugrenzen, habe ich zudem nach einzigartigen Funktionen geschaut, zum Beispiel:
- Anpassbare Dashboards
- KI-gestützte Einblicke
- Verteiltes Tracing
- Anomalie-Erkennung
- Überwachung der Nutzererfahrung
Benutzerfreundlichkeit (10% der Gesamtwertung)
Um ein Gefühl für die Benutzerfreundlichkeit jeder Lösung zu bekommen, habe ich Folgendes berücksichtigt:
- Intuitives Oberflächendesign
- Einfache Navigation
- Individuelle Anpassungsmöglichkeiten
- Lernkurve
- Barrierefreiheitsfunktionen
Onboarding (10% der Gesamtwertung)
Um die Einarbeitung in jede Plattform zu bewerten, habe ich Folgendes einbezogen:
- Verfügbarkeit von Schulungsvideos
- Interaktive Produkttouren
- Zugriff auf Vorlagen
- Chatbot-Unterstützung
- Webinare und Live-Demos
Kundensupport (10 % der Gesamtbewertung)
Um die Kundensupportdienste jedes Softwareanbieters zu bewerten, habe ich Folgendes berücksichtigt:
- 24/7 Erreichbarkeit
- Multikanal-Supportoptionen
- Reaktionsgeschwindigkeit auf Anfragen
- Verfügbarkeit einer Wissensdatenbank
- Personalisierte Supportleistungen
Preis-Leistungs-Verhältnis (10 % der Gesamtbewertung)
Um das Preis-Leistungs-Verhältnis jeder Plattform zu bewerten, habe ich Folgendes berücksichtigt:
- Konkurrenzfähige Preise
- Transparente Preisgestaltung
- Verfügbarkeit von kostenlosen Testversionen
- Umfang der Funktionen in jeder Preiskategorie
- Rabatte für Jahresabonnements
Kundenbewertungen (10 % der Gesamtbewertung)
Um einen Eindruck von der allgemeinen Kundenzufriedenheit zu erhalten, habe ich Folgendes bei der Auswertung von Kundenbewertungen berücksichtigt:
- Benutzerzufriedenheitsbewertungen
- Häufig gemeldete Probleme
- Lob für bestimmte Funktionen
- Feedback zu Supportleistungen
- Gesamtempfehlungsraten
Wie wähle ich ein Performance-Monitoring-Tool aus?
Es ist leicht, sich in langen Funktionslisten und komplexen Preisstrukturen zu verlieren. Damit Sie während Ihres individuellen Auswahlprozesses für Software fokussiert bleiben, finden Sie hier eine Checkliste mit wichtigen Faktoren, die Sie im Hinterkopf behalten sollten:
| Faktor | Worauf zu achten ist |
|---|---|
| Skalierbarkeit | Kann das Tool mit den Anforderungen Ihres Unternehmens mitwachsen? Prüfen Sie, ob es steigende Datenmengen und Benutzerzahlen ohne Leistungseinbußen unterstützt. |
| Integrationen | Lässt sich das Tool in Ihre bestehende Systemlandschaft integrieren? Überprüfen Sie die Kompatibilität mit wichtigen Systemen wie AWS, Azure oder Kubernetes, um Datensilos zu vermeiden. |
| Anpassbarkeit | Können Sie das Tool an Ihre Workflows anpassen? Suchen Sie nach Optionen, mit denen Sie Dashboards und Berichte individuell auf die Anforderungen Ihres Teams zuschneiden können. |
| Benutzerfreundlichkeit | Ist die Benutzeroberfläche für Ihr Team intuitiv? Eine steile Lernkurve kann die Einführung verzögern – achten Sie also auf benutzerfreundliche Designs und klare Navigation. |
| Implementierung und Onboarding | Wie lange dauert es, bis das Tool einsatzbereit ist? Prüfen Sie, ob Ressourcen wie Tutorials und Support den Umstieg erleichtern. Netzwerkdienste von WAN-Optimierungsanbietern können komplexere Onboarding-Prozesse haben als andere Werkzeuge. |
| Kosten | Ist die Preisgestaltung transparent und im Rahmen Ihres Budgets? Berücksichtigen Sie nicht nur die Anschaffungskosten, sondern auch langfristige Ausgaben, einschließlich möglicher Zusatzfunktionen oder Upgrades. |
| Sicherheitsmaßnahmen | Erfüllt das Tool Ihre Sicherheitsanforderungen? Achten Sie auf robuste Datenschutzfunktionen wie Verschlüsselung und regelmäßige Sicherheitsupdates. |
| Support-Verfügbarkeit | Ist Hilfe verfügbar, wenn Sie sie benötigen? Prüfen Sie die Supportzeiten und -kanäle wie Chat oder Telefon, um sicherzustellen, dass sie zu den Anforderungen Ihres Teams passen. |
Was sind Performance-Monitoring-Tools?
Performance-Monitoring-Tools sind Softwarelösungen zur Überwachung und Analyse der Leistung von Anwendungen, Servern und Netzwerken. IT-Fachleute, Entwickler und Betriebsteams verwenden diese Werkzeuge in der Regel, um einen effizienten Systembetrieb sicherzustellen und potenzielle Probleme zu erkennen, bevor sie eskalieren.
Echtzeitüberwachung, Benachrichtigungen bei Warnmeldungen und anpassbare Dashboards unterstützen die Aufrechterhaltung der Systemgesundheit und die Leistungsoptimierung. Umfassende Hardware-Monitoring-Software erweitern diese Funktionen, indem sie detaillierte Einblicke in die physische Infrastruktur bieten. Diese Tools liefern wichtige Erkenntnisse, mit deren Hilfe Teams Zuverlässigkeit und Benutzerzufriedenheit verbessern können.
Funktionen
Achten Sie bei der Auswahl von Performance-Monitoring-Tools insbesondere auf folgende Hauptfunktionen:
- Benachrichtigungen bei Alarmen: Sendet sofortige Warnungen, um Benutzer über Systemanomalien zu informieren und schnelle Reaktionen auf potenzielle Probleme zu ermöglichen.
- Anpassbare Dashboards: Ermöglicht es Benutzern, die Anzeige von Kennzahlen und Daten individuell an ihre spezifischen Bedürfnisse und Vorlieben anzupassen.
- Anomalieerkennung: Erkennt ungewöhnliche Muster und Abweichungen in Leistungskennzahlen und unterstützt so eine schnelle Problemdiagnose.
- Einblicke in die Anwendungsleistung: Bietet eine detaillierte Analyse der Anwendungsintegrität und -effizienz, um Teams bei der Optimierung der Softwareleistung zu unterstützen.
- Integrationsfähigkeit: Stellt die Kompatibilität mit bestehenden Systemen und Plattformen sicher, reduziert Datensilos und verbessert den Workflow.
- Überwachung der Nutzererfahrung: Verfolgt Interaktionen und Erfahrungen der Endnutzer, um Einblicke zur Steigerung der Zufriedenheit und Bindung zu liefern.
- Echtzeitüberwachung: Stellt kontinuierliche Daten zur Systemleistung bereit und hilft Teams, Probleme schnell zu erkennen und zu beheben, sobald sie auftreten. Beliebte Lösungen wie Nagios-Alternativen bieten verschiedene Ansätze zur Systemüberwachung.
- Automatisierte Erkennung: Vereinfacht den Einrichtungsprozess, indem Systemkomponenten automatisch erkannt und abgebildet werden.
- Sicherheitsvorkehrungen: Bietet Datenschutzfunktionen wie Verschlüsselung, um Systemintegrität und die Einhaltung von Standards zu gewährleisten.
Vorteile
Die Implementierung von Performance-Monitoring-Tools bringt zahlreiche Vorteile für Ihr Team und Ihr Unternehmen. Hier sind einige, auf die Sie sich freuen können:
- Verbesserte Systemzuverlässigkeit: Echtzeitüberwachung und Alarmbenachrichtigungen helfen dabei, die Systemverfügbarkeit aufrechtzuerhalten, indem Probleme schnell erkannt und behoben werden.
- Steigerung der Nutzerzufriedenheit: Das Monitoring der Nutzererfahrung liefert Einblicke in die Interaktionen der Endnutzer und ermöglicht so Verbesserungen, die die Zufriedenheit erhöhen.
- Optimierte Leistung: Einblicke in die Anwendungsleistung und Anomalieerkennung helfen, Engpässe zu identifizieren und die Effizienz der Software zu steigern.
- Effizientes Ressourcenmanagement: Anpassbare Dashboards und Integrationsfähigkeiten sorgen dafür, dass Daten plattformübergreifend leicht zugänglich und verwertbar sind.
- Erhöhte Sicherheit: Sicherheitsvorkehrungen schützen die Datenintegrität, gewährleisten die Einhaltung von Branchenstandards und reduzieren Risiken.
- Proaktive Problemlösung: Automatisierte Erkennung und Echtzeitwarnungen ermöglichen es Teams, potenzielle Probleme anzugehen, bevor sie den Betrieb beeinträchtigen.
- Vereinfachte Arbeitsabläufe: Integrationsfähigkeiten sorgen für einen reibungslosen Datenfluss zwischen Systemen, senken den manuellen Arbeitsaufwand und steigern die Produktivität.
Kosten & Preise
Die Auswahl von Performance-Monitoring-Tools erfordert ein Verständnis der verschiedenen verfügbaren Preismodelle und Tarife. Die Kosten variieren je nach Funktionsumfang, Teamgröße, Zusatzoptionen und mehr. Die folgende Tabelle fasst gängige Tarife, deren Durchschnittspreise und typische enthaltene Funktionen von Performance-Monitoring-Tools zusammen:
Tarifvergleichstabelle für Performance Monitoring Tools
| Tarifart | Durchschnittspreis | Übliche Funktionen |
|---|---|---|
| Gratis-Tarif | $0 | Grundlegende Überwachung, begrenzte Datenaufbewahrung und Community-Support. |
| Personal-Tarif | $5-$25/user/month | Echtzeitüberwachung, Alarmbenachrichtigungen, anpassbare Dashboards und E-Mail-Support. |
| Business-Tarif | $30-$75/user/month | Erweiterte Analytik, Integrationsmöglichkeiten, Nutzererfahrungsüberwachung und Telefonsupport. |
| Enterprise-Tarif | $100-$200/user/month | Vollständige Systemübersicht, dediziertes Account-Management, erweiterte Sicherheitsfeatures und 24/7 Premium-Support. |
FAQs zu Performance-Monitoring-Tools
Hier finden Sie Antworten auf häufig gestellte Fragen zu Performance-Monitoring-Tools:
Welche Überlegungen sollten Sie bei der Auswahl eines Performance-Monitoring-Tools anstellen?
Bei der Auswahl eines Performance-Monitoring-Tools sollten Sie Sicherheit, Datenschutz und Privatsphäre berücksichtigen. Stellen Sie sicher, dass das Tool branchenspezifische Standards wie DSGVO oder HIPAA einhält. Bewerten Sie, wie gut es sich in Ihre bestehenden Systeme integrieren lässt und ob es mit den Anforderungen Ihres Unternehmens skalieren kann. Wenn Sie nach umfassenden Optionen jenseits traditioneller Lösungen suchen, bietet unser Leitfaden zu New Relic Alternativen detaillierte Vergleiche der besten Tools.
Wie gehen Performance-Monitoring-Tools mit dem Datenschutz um?
Performance-Monitoring-Tools verfügen häufig über Funktionen zur Sicherstellung des Datenschutzes, wie z. B. Datenverschlüsselung und Zugriffskontrollen. Sie sollten sicherstellen, dass das ausgewählte Tool alle relevanten Datenschutzbestimmungen einhält und Prüfprotokolle zur Nachverfolgung des Datenzugriffs bietet.
Wie integrieren sich Performance-Monitoring-Tools in bestehende Systeme?
Die meisten Performance-Monitoring-Tools bieten APIs und Konnektoren zur Integration mit anderen Systemen an. Überprüfen Sie, ob das Tool Ihre aktuelle Technologielandschaft unterstützt, darunter Cloud-Dienste und lokale Anwendungen, um einen reibungslosen Datenfluss sicherzustellen und Datensilos zu vermeiden.
Wie informieren Performance-Monitoring-Tools Nutzer über Probleme?
Diese Tools setzen typischerweise auf Echtzeit-Benachrichtigungen, um Nutzer bei Performance-Problemen zu informieren. Benachrichtigungen können per E-Mail, SMS oder integrierten Messaging-Plattformen versendet werden. Achten Sie auf individuell einstellbare Schwellenwerte für Warnungen und Eskalationspfade, die zum Workflow Ihres Teams passen.
Welche Art von Support können Sie von Anbietern von Performance-Monitoring-Tools erwarten?
Der Support variiert je nach Anbieter, umfasst aber häufig rund um die Uhr Unterstützung per Chat, E-Mail oder Telefon. Einige Anbieter stellen auch dedizierte Account Manager oder Premium-Supportpläne bereit. Überprüfen Sie den benötigten Support-Level und stellen Sie sicher, dass er über die gewünschten Kanäle verfügbar ist.
Wie helfen Performance-Monitoring-Tools bei der Ressourcenoptimierung?
Durch das Bereitstellen von Einblicken in die Systemleistung und dem Aufdecken von Engpässen unterstützen diese Tools eine optimale Ressourcenverteilung. Sie ermöglichen es, Workloads anzupassen, Ressourcen effizient zu skalieren und die Gesamtperformance zu verbessern, was zu Kosteneinsparungen und besserem Ressourcenmanagement führt.
Wie geht es weiter:
Wenn Sie gerade Performance-Monitoring-Tools recherchieren, verbinden Sie sich mit einem SoftwareSelect-Berater für kostenlose Empfehlungen.
Sie füllen ein Formular aus und führen ein kurzes Gespräch, in dem Ihre spezifischen Anforderungen ermittelt werden. Anschließend erhalten Sie eine Shortlist geeigneter Software. Sie werden sogar während des gesamten Kaufprozesses unterstützt – bis hin zu Preisverhandlungen.