10 Best SolarWinds Alternatives Reviewed in 2026

Best SolarWinds Alternatives Shortlist


I understand the importance of finding a robust SolarWinds alternative that satisfies the needs of my team. You want a tool that goes beyond mere network performance monitoring, offering extensive modules, excellent API support, and Microsoft compatibility. You want software that empowers IT, teams, making their jobs more manageable.
What Is SolarWinds?
SolarWinds is an IT monitoring tool that helps you track the performance and health of your network, servers, and infrastructure. It's used by IT admins, network engineers, and MSPs who need to spot issues early and keep systems running smoothly. Monitoring dashboards, alerts, and reporting tools help with identifying problems, managing resources, and showing uptime to stakeholders. Overall, SolarWinds gives your team the visibility you need to stay ahead of IT issues.
Why Trust Our Software Reviews
We’ve been testing and reviewing SaaS development software since 2023. As tech experts ourselves, we know how critical and difficult it is to make the right decision when selecting software. We invest in deep research to help our audience make better software purchasing decisions.
We’ve tested more than 2,000 tools for different SaaS development use cases and written over 1,000 comprehensive software reviews. Learn how we stay transparent & check out our software review methodology.
Best SolarWinds Alternatives Summary
This comparison chart summarizes pricing details for my top SolarWinds alternative selections to help you find the best one for your budget and business needs.
| Tool | Best For | Trial Info | Price | ||
|---|---|---|---|---|---|
| 1 | Best for automated network mapping | 14-day free trial + free demo available | Pricing upon request | Website | |
| 2 | Best for integrated fault and performance management | Free demo available | From $245/25 devices | Website | |
| 3 | Best with customizable dashboards | Free plan + 30-day free trial available | From $275/month (billed annually) | Website | |
| 4 | Best for its scalable and extensible architecture | Free plan available | Pricing upon request | Website | |
| 5 | Best for real user monitoring | 30-day free trial + free demo available | From $10/month (billed annually) | Website | |
| 6 | Best for intuitive setup with auto-discovery | 30-day free trial | From $179/month (billed annually) | Website | |
| 7 | Best for cloud infrastructure monitoring and analytics | 14-day free trial | From $15/host/month (billed annually) | Website | |
| 8 | Best for log monitoring and tamper-proof retention | Free demo available | From $0.09/GB/month | Website | |
| 9 | Best for versatility in data collection methods | Free download available | From $325/month (billed annually) | Website | |
| 10 | Best for comprehensive infrastructure monitoring | Free plan and free demo available | From $2,595 (perpetual license for 100 nodes) | Website |
-

TestDevLab
Visit Website -
Site24x7
Visit WebsiteThis is an aggregated rating for this tool including ratings from Crozdesk users and ratings from other sites.4.7 -
GitHub Actions
Visit WebsiteThis is an aggregated rating for this tool including ratings from Crozdesk users and ratings from other sites.4.8


Overviews of the Best SolarWinds Alternatives
Below are my detailed summaries of the best SolarWinds alternatives that made it onto my shortlist. My reviews offer a detailed look at the key features, pros & cons, integrations, and ideal use cases of each tool to help you find the best one for you.

Auvik is a cloud-based network monitoring platform built to help IT teams and managed service providers (MSPs) gain real-time visibility and control over network infrastructure. It offers tools for network discovery, mapping, monitoring, and performance analysis through a user-friendly interface that requires no additional hardware.
Why I Picked Auvik:
I picked Auvik for this list because it offers automated network mapping that helps you visualize device connections in real time, making it easier to pinpoint performance issues and track changes across complex environments. I also liked that Auvik can be deployed quickly, typically without additional hardware, and provides centralized monitoring for multi-site environments through a single dashboard with global alerting. These features make it especially well-suited for MSPs managing distributed networks.
Standout Features & Integrations:
Auvik’s features include performance monitoring with health metrics, customizable alerts for unusual activity, centralized syslog management, automatic configuration backups, and remote access for faster troubleshooting. For more advanced workflows, Auvik provides tools like configuration comparisons, command execution, and API access. As a cloud-based platform, Auvik ensures automatic updates and scalability without the need for extra infrastructure. Integrations include Slack, Microsoft Teams, ConnectWise Manage, ServiceNow, Autotask PSA, Freshdesk, BrightGauge, PagerDuty, and more.
Pros and Cons
Pros:
- Prompt alerting system for various issues
- Can back up and restore device configurations
- Detailed device inventory aids in lifecycle management
Cons:
- Setting up more advanced functionalities can be challenging
- Occasional delays in real-time data updates
New Product Updates from Auvik
Auvik Adds Aurora Troubleshooting Assistance
Auvik introduces Aurora Troubleshooting Assistance with AI-powered troubleshooting guidance, possible root causes, conversation downloads, and feedback tools. The open beta helps IT teams diagnose network issues faster with contextual recommendations tailored to specific devices and alerts. For more information, visit Auvik's official site.
 .
.Best for integrated fault and performance management

ManageEngine OpManager, a versatile network management software, offers a comprehensive toolset for integrated fault and performance management. With its ability to swiftly identify, notify, and rectify network issues, it truly shines in ensuring smooth network operations.
Pros and Cons
Pros:
- Detailed network visualization and mapping
- Good scalability for growing networks
- Integrated fault and performance management
Cons:
- High cost for managing larger networks
- Initial setup may require technical expertise
- UI can feel cluttered due to numerous features
New Product Updates from ManageEngine OpManager
ManageEngine OpManager Vendor Templates and NCM XML Import
ManageEngine OpManager introduces enhanced vendor template integration and device template import for the NCM module using XML files. This update helps teams improve device classification and speed up configuration workflows. For more information, visit ManageEngine OpManager’s official site.
 .
.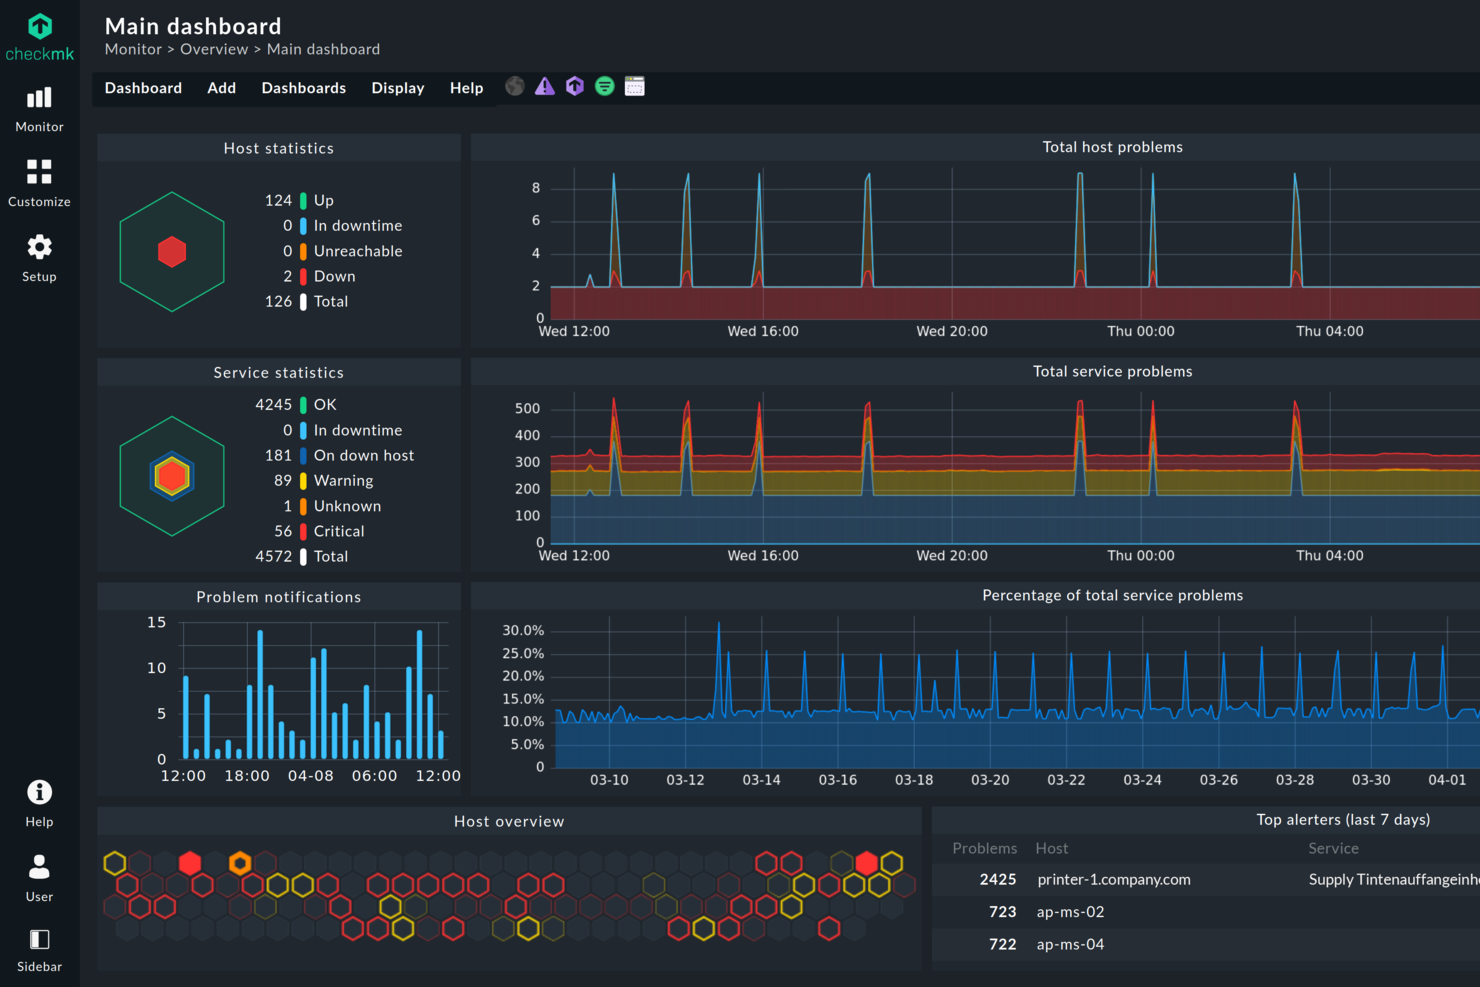
Checkmk is a monitoring platform designed for IT teams managing complex, hybrid, or large-scale infrastructures. It stands out for its flexibility and depth, offering broad compatibility with modern and legacy systems that many SolarWinds alternatives struggle to match. If you need unified visibility, automation, and granular control across diverse environments, Checkmk addresses these challenges head-on.
Who Is Checkmk Best For?
Checkmk is a strong fit for IT operations teams and system administrators who need to create tailored monitoring views for different departments or business units.
Why Checkmk Is a Good solarwinds alternative
If you need monitoring dashboards that adapt to your team’s unique workflows, Checkmk is a strong SolarWinds alternative. I like that you can build fully customizable dashboards, choosing exactly which metrics, graphs, and alerts to display for each user or team. The drag-and-drop dashboard editor and widget library make it easy to create views tailored to specific roles or business needs. This flexibility helps IT teams focus on the most relevant data without distraction from unnecessary information.
Checkmk Key Features
Some other features in Checkmk that stand out for IT teams include:
- Customizable dashboards: Build and tailor dashboards to display the most relevant metrics and alerts for your environment.
- Automated host discovery: Automatically detect and add new devices or services to your monitoring setup without manual intervention.
- Granular alerting rules: Set up detailed notification policies based on thresholds, dependencies, or business hours.
- Integrated log and event analysis: Collect, analyze, and correlate logs and events directly within the monitoring platform.
Checkmk Integrations
Integrations include AWS, Azure, Google Cloud Platform, Cisco, Dell, VMware vSphere, Kubernetes, Microsoft Windows, Oracle, and SAP.
Pros and Cons
Pros:
- Provides deep visibility into network and application layers
- Scales efficiently for large enterprise environments
- Highly granular alerting and notification options
- Offers over 2,000 native plug-ins
- Supports hybrid, cloud, and on-premises monitoring
Cons:
- Community support is less active than SolarWinds
- Fewer out-of-the-box integrations for SaaS tools
- Limited mobile app functionality
- Initial setup can be time-intensive
- Fewer built-in reporting templates than SolarWinds

Icinga is an open-source network monitoring tool that offers flexible and scalable solutions to monitor network resources, notify users of outages, and provide data for reporting. It's known for its extensible architecture which makes it perfect for environments that need a customizable and scalable monitoring solution.
Pros and Cons
Pros:
- Open-source with enterprise-level support available
- Strong integration capabilities
- Highly scalable and extensible
Cons:
- Interface can feel outdated and less intuitive compared to competitors
- Documentation could be improved
- Requires technical knowledge for setup and customization
New Product Updates from Icinga

Icinga Adds TOTP Two-Factor Authentication to Icinga Web
Icinga added time-based one-time password (TOTP) two-factor authentication to Icinga Web, helping organizations strengthen login security with an additional verification step. For more information, visit Icinga’s official site.
 .
.
Site24x7 is a cloud-based, AI-powered monitoring solution that helps you oversee your websites, servers, applications, and network infrastructure. It offers real-time insights into performance and availability, enabling you to detect and address issues promptly.
Why I Picked Site24x7:
One reason I like Site24x7 is its application performance monitoring (APM) capabilities. Site24x7's APM lets you monitor applications built on various platforms, including Java, .NET, PHP, and Node.js. This feature helps you identify and resolve performance bottlenecks in your applications, ensuring a smooth user experience. Another advantage of Site24x7 is its real user monitoring (RUM) feature. RUM provides insights into how actual users experience your website or application by analyzing metrics like page load times and user interactions.
Standout features & integrations:
Other features include synthetic web transaction monitoring, which allows you to record and simulate multi-step user interactions in a real browser to optimize critical user paths like login forms and shopping carts. Additionally, Site24x7 offers log management from the cloud, enabling you to collect, consolidate, and search application logs across servers and data centers for efficient troubleshooting.
Integrations include ServiceNow, PagerDuty, Jira, Microsoft Teams, Slack, Nagios, AWS, Azure, Google Cloud Platform, Docker, Jenkins, and Kubernetes.
Pros and Cons
Pros:
- Comprehensive monitoring for various systems
- Customizable dashboards and reports
- Offers real-time alerts across various channels
Cons:
- Alert overload may be overwhelming for users
- Complexity in initial setup for large environments
New Product Updates from Site24x7

Site24x7 Adds Discovery Issues for AWS Monitoring
Site24x7 added Discovery Issues for AWS monitoring, helping teams identify why resources are not being discovered across services and regions. The feature surfaces permission gaps, policy restrictions, and blocked API actions to support faster troubleshooting. For more information, visit Site24x7’s official site.
 .
.
Paessler PRTG is a comprehensive network monitoring solution designed to provide real-time insights into the health and performance of IT infrastructures. With PRTG, IT teams can monitor a wide range of devices, including servers, switches, routers, and applications, through customizable sensors.
Why I Picked PRTG:
PRTG’s auto-discovery tool simplifies the initial setup by automatically detecting devices and setting up relevant sensors. This approach allows your IT team to start monitoring their network almost immediately, saving time and reducing the complexity of the implementation process.
Additionally, PRTG's all-in-one monitoring tool supports various protocols such as SNMP, WMI, Flow, and Ping, allowing it to track key metrics like bandwidth usage, uptime, CPU load, and more.
Standout features & integrations:
PRTG offers other comprehensive features, including flexible alerting, multiple user interfaces, and cluster failover solutions. It also has built-in reporting tools that allow for detailed insights into network performance over time, and a map feature for creating customized, visual representations of your entire network infrastructure, offering a clear and organized view of devices, metrics, and overall network health.
Pricing:
The pricing for PRTG starts from $2,149 for 500 aspects of your devices in your network (billed annually).
Pros and Cons
Pros:
- Rapid auto-discovery of network devices
- Intuitive setup and user-friendly interface
- Wide range of supported technologies for integration
Cons:
- No built-in ticketing system
- Advanced features may require technical expertise
- High cost for managing larger networks
New Product Updates from PRTG
PRTG Introduces New Monitoring Sensors In Beta
This week, PRTG introduces three BETA sensors that broaden your monitoring scope for Proxmox VE clusters and SIMATIC S7-300/400 PLCs, giving you deeper operational insights. For more information, visit PRTG’s official site.
 .
.
Datadog is a robust monitoring service for cloud-scale applications, providing businesses with observability into their entire infrastructure, from applications to the underlying hardware. Tailored primarily for cloud environments, it allows organizations to understand their systems' performance and derive insights from data analytics.
Pros and Cons
Pros:
- Powerful analytics tools
- Robust integrations with other services
- Comprehensive cloud infrastructure monitoring
Cons:
- Some users report the need for better alert customization
- Requires a learning curve to utilize full features
- Costly for small businesses

Logmanager is a powerful log management and Security Information and Event Management (SIEM) platform built to help IT teams improve observability, security, and compliance. As an alternative to SolarWinds, it provides an intuitive interface, flexible deployment, and more flexibility for log retention, making it a solid choice for organizations that want deep visibility without the complexity of legacy systems.
Why I Picked Logmanager:
I picked Logmanager because it gives you real-time visibility into your IT environment. Its live log monitoring means you can detect issues as they occur and act before they escalate into costly downtime. I also like how it supports more than 140 log sources out of the box, giving you unified insight across firewalls, servers, databases, and cloud platforms. For teams that need to stay compliant with standards like GDPR or ISO 27001, Logmanager’s automated reporting and retention policies make it easy to stay audit-ready without manual effort.
Logmanager standout features and integrations:
Logmanager’s predefined dashboards provide actionable insights into system health, network activity, and security alerts the moment you log in. Its no-code customization options let you adapt dashboards and alerts to your specific use cases without relying on developers. The platform’s compliance reporting and data retention policies also help organizations meet regulatory standards while maintaining performance efficiency. Integrations include Apache Tomcat/Web Server, Aruba ClearPass, Cisco ASA, DELL iDRAC, ESET Remote Administrator, Fortinet Products, Kaspersky Security Center, MySQL, NGINX, Microsoft 365, VMware, and Zyxel ZyWALL USG/VPN.
Pros and Cons
Pros:
- No-code customization
- Built-in parsers and compliance reporting tools
- Tamper-proof log storage
Cons:
- Interface could feel dated
- Setup may require learning curve
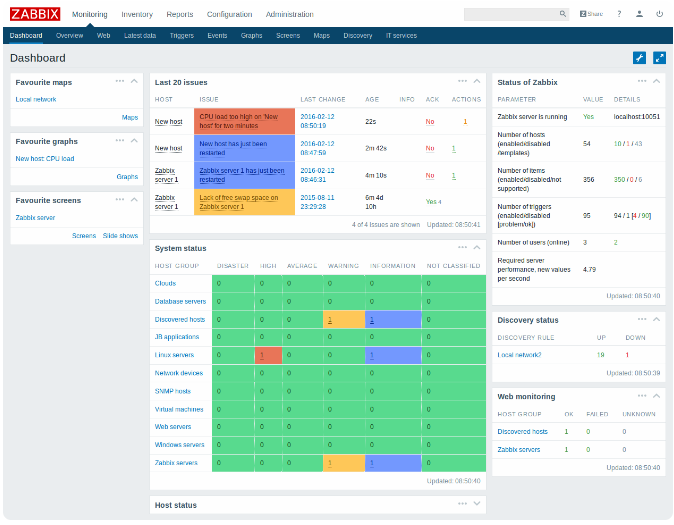
Zabbix emerges as a robust network monitoring software providing exceptional flexibility in data collection. With multiple data-gathering methods, it's primed to become the best fit for a variety of network scenarios.
Pros and Cons
Pros:
- Open-source and cost-effective
- Scalable to large networks
- Versatile data collection methods
Cons:
- Requires in-house expertise for setup and maintenance
- GUI could be more intuitive
- Steeper learning curve

Nagios, a renowned player in the IT infrastructure monitoring space, offers a holistic view of your network environment. With its comprehensive feature set, it justifies its stance as the best solution for wide-ranging infrastructure oversight.
Pros and Cons
Pros:
- Extensive integration possibilities
- High level of customization
- Wide-ranging monitoring capability
Cons:
- Cost might be high for small businesses
- Interface could be more modern
- Steep learning curve for beginners
Other SolarWinds Alternative Tools
Here are some additional SolarWinds alternatives that didn’t make it onto my shortlist, but are still worth checking out:
- LogicMonitor
For hybrid IT monitoring from the cloud
- InvGate Service Management
For easy WHD migration planning
- Spiceworks
For free network monitoring and helpdesk solution
- ScienceLogic
For AI-based IT operations and service management
- Zenoss
For unified monitoring of large-scale environments
- Opsview Monitor
For business service monitoring and reporting
- AppDynamics
Good for end-to-end business and application performance monitoring
- Dynatrace
Good for AI-powered, full-stack observability
- New Relic
Good for real-time insights into application performance
- Sumo Logic
Good for cloud-native log management and analytics
- WhatsUp Gold
Good for network monitoring with visual interactive maps
- Prometheus
Good for monitoring and alerting in Kubernetes environments
- ConnectWise Automate
Good for automated IT management and remote monitoring
- SysAid
Good for combining IT service management and help desk needs
- Grafana Cloud
Good for customizable data visualization and analytics
- Atera
For all-in-one RMM software for MSPs
- Sematext
Good for combining monitoring and logging with real-user monitoring
- Pandora FMS
Good for flexible, open-source monitoring of large environments
- Elastic Stack (ELK Stack)
Good for powerful log analysis and search capabilities


Other Software Reviews
How I Evaluate SolarWinds NCM Alternatives
I evaluate NCM tools across two layers: baseline must-haves like multi-vendor config backup and change detection, and the differentiators that determine the right fit for your environment.
Core Functionality (Table Stakes For This List)
When I'm selecting tools for my list, I rank each one on a scale from 0 (does not offer the functionality) to 5 (excels in this area) for each core functionality listed below. Then, I calculate the tool's total score into a percentage. Each tool needs to achieve a minimum total score of 65% to be considered for inclusion.
- Multi-Vendor Device Support: I check whether a tool handles configs across vendors like Cisco, Juniper, Arista, Fortinet, and Palo Alto with consistent depth across each.
- Automated Configuration Backup: Each tool should schedule and run backups of running and startup configs without manual intervention, with encrypted, searchable storage.
- Change Detection & Versioning: I look for real-time change alerts, side-by-side diffs, and version rollback—especially useful when tracking down an unauthorized ACL change at 2 a.m.
- Bulk Configuration Deployment: Pushing a VLAN update to hundreds of switches at once is a common scenario, so I evaluate template-based mass pushes and scheduled deployments.
- Compliance & Policy Auditing: Tools should include prebuilt policy checks for frameworks like PCI-DSS or HIPAA while also letting you define custom rules for internal standards.
- Role-Based Access & Audit Logs: Granular RBAC matters when multiple teams touch network configs, so I evaluate permission controls, SSO/LDAP support, and audit trail detail.
Once I have a list of tools that meet this criteria, I consider what sets each platform apart.
Differentiating Factors (What Sets Vendors Apart)
Here's how I compare and contrast different vendors:
Standout Features
Configuration drift remediation is a big differentiator—I look for tools that detect when a device strays from its golden baseline and auto-correct it without a ticket. API and automation support also matters, especially if your team uses Ansible or Terraform to manage infrastructure as code. I evaluate change approval workflows too, since tying config pushes to ITSM tools like ServiceNow gives every change an auditable approval chain before it reaches production.
Beyond Features
Vendor security posture matters here more than in most categories. Many teams started shopping for NCM alternatives after the SUNBURST incident, so I check each vendor's disclosure practices, certifications, and patching cadence. Deployment flexibility is another factor I evaluate—some environments require on-premise or air-gapped installations, while others benefit from SaaS. I also consider scalability, particularly whether a tool supports distributed pollers or worker nodes for managing thousands of devices across multiple sites without performance issues.
Why Look For A SolarWinds Alternative?
While SolarWinds is a good choice of IT monitoring tool, there are a number of reasons why some users seek out alternative solutions. You might be looking for a SolarWinds alternative because…
- You want a faster, more modern user interface.
- You don’t need all the advanced enterprise features.
- You’re looking for easier setup and configuration.
- You prefer simpler, more transparent pricing.
- You need better support for cloud-native environments.
- You’re managing a smaller team or fewer endpoints.
If any of these sound like you, you’ve come to the right place. My list contains several IT monitoring tools that are better suited for teams facing challenges with SolarWinds and looking for SolarWinds or New Relic alternative solutions.
SolarWinds Key Features
Here are some of the key features of SolarWinds, to help you contrast and compare what alternative solutions offer:
- Cloud monitoring: Gives you visibility into your cloud services alongside on-prem systems.
- Network performance monitor: Lets you detect, diagnose, and resolve network issues.
- Server and application monitor: Helps you track server health and app performance.
- Configuration management: Lets you back up and manage device configs across your network.
- IP address manager: Helps your team track and manage IP addresses automatically.
- NetFlow traffic analyzer: Shows where your network traffic is coming from and going.
- Virtualization manager: Monitors and manages virtual machines in your infrastructure.
- Log analyzer: Helps you collect and search logs for faster troubleshooting.
- Alerting system: Sends real-time alerts when performance drops or issues pop up.
- Custom dashboards: Lets you create visual views to track the data that matters most.
Summary
In conclusion, selecting the best SolarWinds alternative necessitates a clear understanding of your own specific requirements and how these align with the features and capabilities offered by various IT monitoring solutions.
- Consider your Environment: Remember to factor in the specific needs of your IT infrastructure. Whether you have a small-scale environment or a large-scale one, a hybrid or a cloud-native infrastructure, there's a tool out there perfectly suited for your requirements.
- Evaluate Core Functionalities and Features: It's essential to focus on the tool's ability to deliver robust monitoring, alerting, and reporting capabilities. AI-driven operations, predictive analytics, and service management functionalities could greatly enhance your IT monitoring effectiveness.
- Don't Overlook Usability and Pricing: A complex tool with a steep learning curve might not be the best choice for a small team. Look for intuitive, user-friendly platforms that align with your budget. Even if a tool offers advanced features, it won't be of much use if the tool itself is difficult to navigate. Additionally, ensure to choose a tool with transparent and flexible pricing.
Choosing the right IT monitoring solution can significantly streamline your operations, enhance performance, and ultimately ensure smoother, more reliable experiences for your end users.
What Do You Think?
As the IT monitoring landscape continues to evolve, I’m always eager to learn about other impressive tools. If you have any suggestions for SolarWinds or Nagios alternatives that you believe should have made this list, please feel free to share them. Your insights and experiences are invaluable to me and other readers, and I'd love to hear from you.