10 Migliori Strumenti di Profilazione per Potenziare le Prestazioni nel 2026

10 Shortlist dei migliori strumenti di profiling


Gli strumenti di profiling ti aiutano a misurare e analizzare le prestazioni del tuo software, così puoi individuare rallentamenti e risolverli.
Se hai mai provato a diagnosticare ritardi, perdite di memoria o picchi di CPU fissando i log, sai quanto può essere frustrante. Questi strumenti ti danno una visione chiara di ciò che accade davvero dietro le quinte, così non dovrai andare a tentativi.
Ho lavorato sia con profiler open-source che commerciali su diversi stack tecnologici e so cosa rende uno strumento utile in scenari reali. In questa guida, condividerò gli strumenti di cui mi fido e spiegherò perché vale la pena considerarli.
Perché Fidarti delle Nostre Recensioni Software
Testiamo e recensiamo software dal 2023. Come leader tecnologici, sappiamo quanto sia cruciale e difficile prendere la decisione giusta nella scelta di un software.
Investiamo in una ricerca approfondita per aiutare il nostro pubblico a effettuare scelte migliori di acquisto software. Abbiamo testato oltre 2.000 strumenti per diversi casi d’uso tecnologici e scritto più di 1.000 recensioni complete. Scopri come restiamo trasparenti e la nostra metodologia di recensione del software.
Riepilogo dei migliori strumenti di profiling
| Tool | Best For | Trial Info | Price | ||
|---|---|---|---|---|---|
| 1 | Ideale per analisi dettagliate sulle prestazioni | Piano gratuito + prova gratuita + demo gratuita disponibili | Da $26/mese (fatturato annualmente) | Website | |
| 2 | Ideale per il monitoraggio delle prestazioni applicative | Piano gratuito disponibile | A partire da $15/utente/mese (fatturati annualmente). | Website | |
| 3 | Ideale per la gestione e l'integrazione dei dati dei clienti | Piano gratuito disponibile | A partire da $120/utente/mese (fatturato annualmente). | Website | |
| 4 | Ideale per la profilazione di memoria e CPU in Python | Not available | Prezzo su richiesta. | Website | |
| 5 | Il migliore per la visualizzazione dello stack di chiamate in Python | Not available | Prezzi su richiesta. | Website | |
| 6 | Ideale per utility di profiler a campionamento in Python | Not available | Dal momento che py-spy è uno strumento open-source, le sue funzionalità principali sono gratuite. | Website | |
| 7 | Ideale per il monitoraggio delle prestazioni con tracciamento degli errori | Not available | Da $26/utente/mese (fatturato annualmente). | Website | |
| 8 | Ideale come strumento per debug e sviluppo PHP | Not available | Prezzo su richiesta. | Website | |
| 9 | Ideale per la profilazione di prodotti industriali | Not available | Prezzo su richiesta. | Website | |
| 10 | Ideale per il tracciamento live del codice su workstation di sviluppo | Not available | Prezzo su richiesta. | Website |
-

TestDevLab
Visit Website -
Site24x7
Visit WebsiteThis is an aggregated rating for this tool including ratings from Crozdesk users and ratings from other sites.4.7 -
GitHub Actions
Visit WebsiteThis is an aggregated rating for this tool including ratings from Crozdesk users and ratings from other sites.4.8


Recensioni dei migliori strumenti di profiling
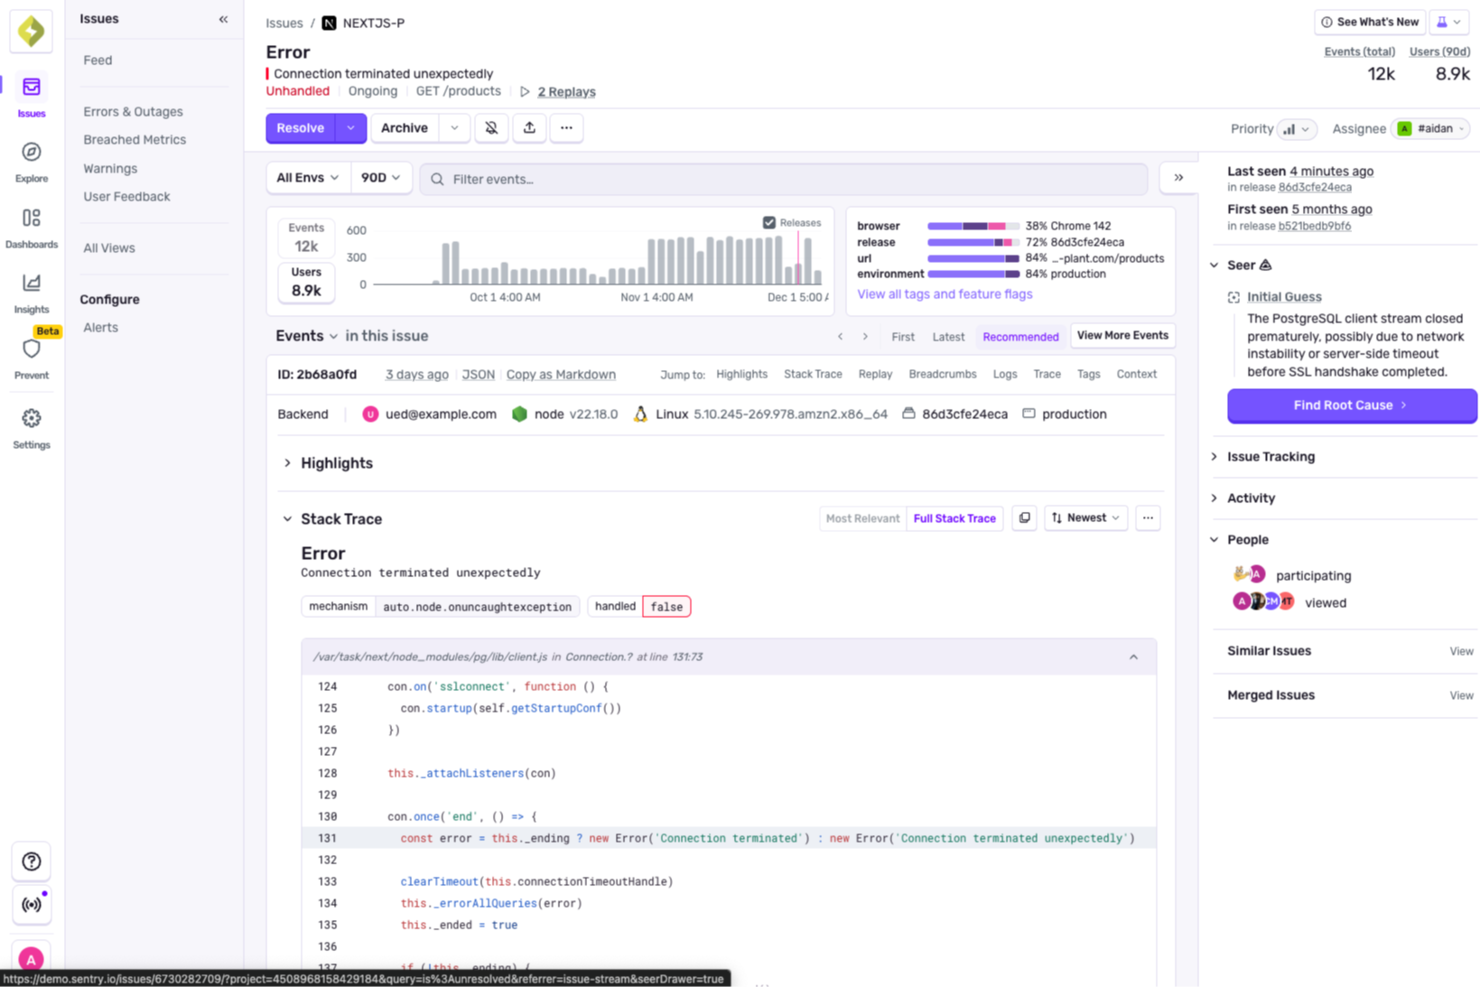
Per gli sviluppatori che cercano una soluzione affidabile per migliorare le prestazioni delle applicazioni, Sentry offre un approccio integrato al monitoraggio degli errori e al profiling. Si rivolge a sviluppatori web e mobile, fornendo strumenti per individuare colli di bottiglia nelle prestazioni e semplificare il processo di debug. Affrontando sfide quali il tracciamento degli errori e le analisi delle prestazioni, Sentry garantisce un'esperienza di sviluppo più fluida.
Perché ho scelto Sentry
Ho scelto Sentry per la sua capacità unica di fornire dettagliate analisi sulle prestazioni grazie alla funzione di profiling. Catturando chiamate di funzione e tempi di esecuzione, Sentry ti permette di individuare e risolvere problemi di prestazioni senza la necessità di una strumentazione personalizzata. L'integrazione senza soluzione di continuità con GitHub e Slack supporta ulteriormente il tuo flusso di lavoro di sviluppo fornendo contesto per le correzioni e facilitando una collaborazione più fluida. Questo rende Sentry una scelta ideale per i team che vogliono ottimizzare le prestazioni delle applicazioni e ridurre i tempi di debug.
Caratteristiche principali di Sentry
Oltre alle sue capacità di profiling, Sentry offre diverse funzionalità che ne aumentano l'utilità come strumento di profiling:
- Monitoraggio errori: Cattura automaticamente gli errori nella tua applicazione, fornendo report dettagliati per aiutarti a eseguire il debug in modo efficiente.
- Riproduzione delle sessioni: Ti consente di visualizzare le sessioni degli utenti per comprendere il contesto degli errori e migliorare l'esperienza utente.
- Debugger AI (Seer): Analizza log e tracce per identificare le cause alla radice dei malfunzionamenti, offrendo suggerimenti guidati dall'intelligenza artificiale per le correzioni.
- Tracing: Fornisce informazioni su richieste lente e colli di bottiglia nelle prestazioni, aiutandoti a ottimizzare la velocità della tua applicazione.
Integrazioni Sentry
Le integrazioni includono GitHub, Slack, Jira, GitLab, Bitbucket, Trello, Azure DevOps, Vercel e AWS Lambda.
Pros and Cons
Pros:
- L'IA segnala problemi nelle pull request
- Generazione automatica di unit test
- Monitoraggio errori in produzione in tempo reale
Cons:
- La configurazione iniziale può essere complessa
- I suggerimenti dell'IA possono richiedere revisione
New Product Updates from Sentry

Sentry Adds Heatmaps to Application Metrics
Sentry introduced heatmaps for Application Metrics to visualize metric value distributions over time, helping teams spot patterns like latency bursts and use heatmaps in Custom Dashboards. For more information, visit Sentry's official site.
 .
.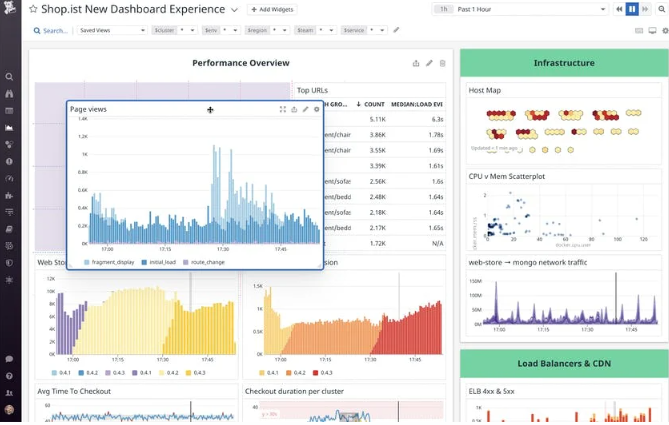
Datadog è una solida piattaforma di monitoraggio su scala cloud che centralizza i dati provenienti da applicazioni, infrastrutture e log. Progettata specificamente per gli ambienti cloud moderni, offre approfondimenti dettagliati sulle prestazioni delle applicazioni, garantendo un uptime ottimale e una rapida individuazione dei problemi.
Perché ho scelto Datadog: La scelta di Datadog è stata influenzata dal suo approccio olistico al monitoraggio delle prestazioni. Rispetto ad altri strumenti, Datadog ha costantemente dimostrato la capacità di fornire approfondimenti dettagliati senza compromettere la facilità d'uso. Ritengo che, per le aziende che danno priorità al monitoraggio delle prestazioni applicative, Datadog sia indubbiamente un leader di settore.
Funzionalità distintive e integrazioni:
Datadog si distingue per funzionalità come dashboard in tempo reale, rilevamento di anomalie e valori anomali e tracciamento completo delle richieste. Potenti strumenti di visualizzazione ne migliorano le capacità di monitoraggio. Sul fronte delle integrazioni, Datadog vanta compatibilità con diverse piattaforme, tra cui AWS, Docker, Slack e molte altre, facilitando un'esperienza di monitoraggio completa.
Pros and Cons
Pros:
- Monitoraggio completo di applicazioni, infrastrutture e log
- Ampia gamma di integrazioni con le piattaforme più diffuse
- Rilevamento efficace delle anomalie e sistemi di avviso
Cons:
- Potrebbe presentare una curva di apprendimento per i nuovi utenti
- Alcune funzionalità avanzate hanno un costo aggiuntivo
- La configurazione iniziale può richiedere tempo per infrastrutture complesse.
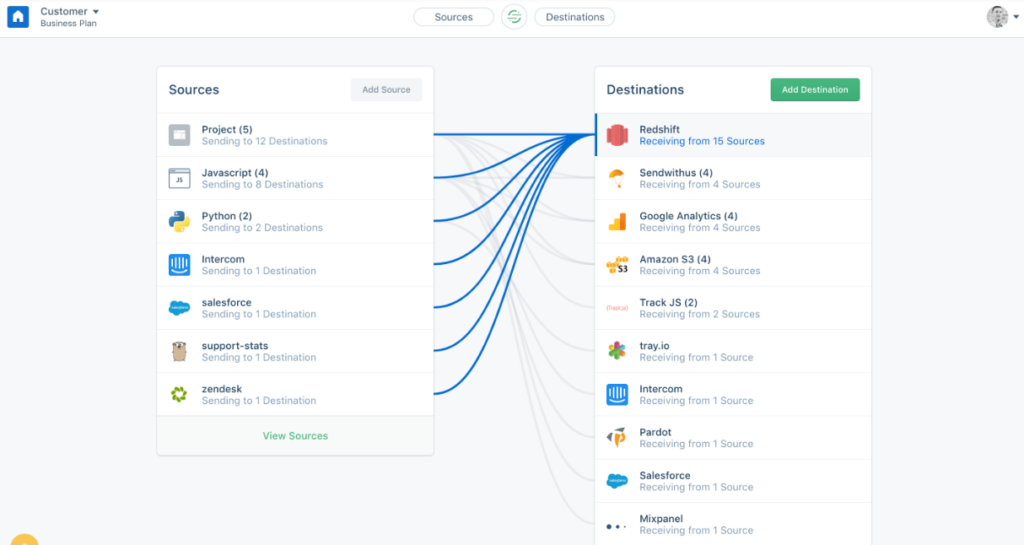
Segment offre una piattaforma che consolida, gestisce e integra i dati dei clienti provenienti da diversi punti di contatto. Progettata per unificare le fonti di dati, rappresenta una soluzione ideale per le aziende che desiderano un approccio semplificato alla gestione e integrazione dei dati dei clienti.
Perché ho scelto Segment: Ho selezionato Segment per questo elenco dopo un ampio confronto con piattaforme simili. La mia decisione è stata influenzata dalla sua solida architettura, che si concentra non solo sulla raccolta dei dati, ma anche sulla loro validazione e precisione. Per le aziende che cercano una soluzione completa per la gestione dei dati dei clienti accompagnata da un'integrazione totale, Segment si distingue.
Caratteristiche principali & integrazioni:
Le principali funzionalità di Segment includono la raccolta in tempo reale dei dati da diversi canali e strumenti di validazione che garantiscono l'integrità dei dati raccolti. Inoltre, i suoi data pipeline sono progettati per consolidare e instradare i dati in modo efficiente. In tema di integrazioni, Segment collabora con molte piattaforme, tra cui ma non solo strumenti di analisi, software di automazione del marketing e sistemi CRM.
Pros and Cons
Pros:
- Raccolta efficiente dei dati da molteplici punti di contatto
- Strumenti di validazione che garantiscono l'integrità dei dati
- Ampia gamma di integrazioni con strumenti aziendali essenziali
Cons:
- Potrebbe essere eccessivo per piccole aziende o startup
- Richiede un certo livello di competenza per un utilizzo completo
- Il prezzo potrebbe essere elevato per le aziende con budget limitato.
Scalene è uno degli strumenti migliori per gli sviluppatori Python che desiderano analizzare l'utilizzo di CPU e memoria.
Perché ho scelto Scalene: Ho scoperto Scalene mentre cercavo uno strumento di profilazione efficiente, principalmente per Python. Confrontando le sue funzionalità con quelle di altri concorrenti, Scalene si è distinto per l'elevata precisione nell'individuare l'uso della memoria e della CPU. Ho stabilito che è il migliore per la profilazione di memoria e CPU in Python perché unisce in modo unico queste due metriche, consentendo agli sviluppatori di avere una visione completa delle prestazioni della propria applicazione.
Caratteristiche e integrazioni principali:
Scalene è particolarmente abile nel fornire metriche di performance dettagliate senza un carico eccessivo. La sua unicità risiede nella capacità di profilare l'utilizzo della memoria a ogni riga di codice, caratteristica rara tra gli altri strumenti. Scalene offre compatibilità con applicazioni Java per l'integrazione, risultando così versatile per progetti che utilizzano sia Python sia Java.
Pros and Cons
Pros:
- Profilazione precisa dell'utilizzo della memoria a livello di riga di codice
- Compatibile con applicazioni Java
- Rileva in modo efficiente sia i parametri di memoria che di CPU
Cons:
- Può presentare una curva di apprendimento più ripida per i principianti
- Supporto limitato per la profilazione SQL e API rispetto agli strumenti specializzati
- Alcune funzionalità avanzate possono risultare complesse per utenti occasionali
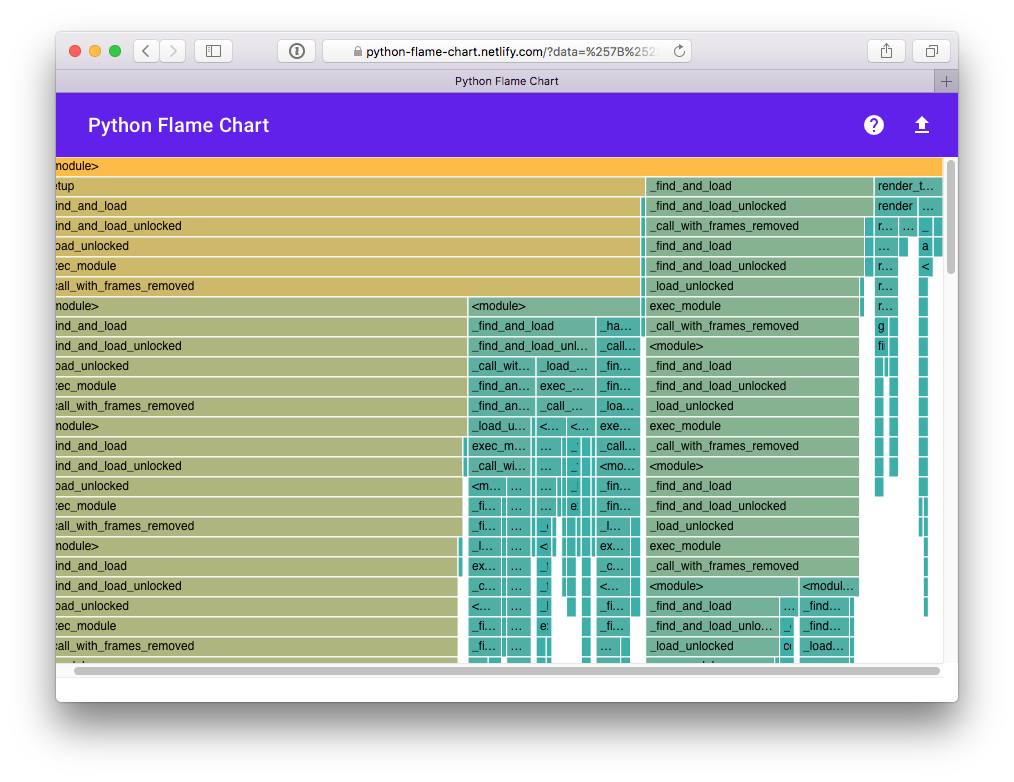
Pyinstrument è un profiler Python progettato per fornire agli sviluppatori una visualizzazione chiara e dettagliata dello stack di chiamate del loro programma. Grazie alla sua capacità di rappresentare visivamente gerarchie di chiamate complesse, è evidente che eccelle nella visualizzazione dello stack di chiamate in Python.
Perché ho scelto Pyinstrument: Ho scelto Pyinstrument dopo averlo confrontato accuratamente con altri strumenti della sua categoria. La sua abilità unica di rappresentare visivamente gerarchie di chiamate complesse ha catturato la mia attenzione. L'ho giudicato superiore nella presentazione degli stack di chiamate Python, rafforzando la mia opinione che sia il miglior strumento per visualizzare le strutture di chiamata in Python.
Caratteristiche e integrazioni principali:
Pyinstrument offre un'interfaccia utente ricca per la visualizzazione dello stack di chiamate, facilitando le attività di business intelligence. I suoi dashboard forniscono agli sviluppatori una panoramica completa del comportamento del loro codice. Oltre alle sue funzionalità principali, Pyinstrument si integra bene con strumenti di pulizia e riconciliazione dei dati, aumentando la sua versatilità per progetti data-driven.
Pros and Cons
Pros:
- Visualizzazione dettagliata dello stack di chiamate che potenzia i processi di business intelligence
- Dashboard completi offrono una visione globale delle prestazioni del codice
- Integrazioni efficaci con strumenti di pulizia e riconciliazione dei dati
Cons:
- Potrebbe non essere adatto al profiling in tempo reale
- Richiede configurazione manuale per alcune funzionalità avanzate
- Supporto limitato per linguaggi non-Python

py-spy è uno strumento progettato per profilare le applicazioni Python campionandone l'esecuzione. Si distingue come una risorsa per gli sviluppatori che mirano a un'analisi dettagliata della memoria senza interferire con il normale funzionamento delle loro app Python.
Perché ho scelto py-spy: Quando ho valutato i migliori strumenti per il profiling in Python, py-spy è stata una scelta naturale. Ciò che ha catturato il mio interesse è stato il suo approccio non intrusivo al profiling della memoria e la capacità di estrarre metadati in modo efficiente. Rispetto ad altri strumenti, è apparso evidente che py-spy si distingueva per le sue capacità, consolidando la sua posizione come miglior strumento per utility di profiler a campionamento per Python.
Caratteristiche di rilievo e integrazioni:
Una delle caratteristiche fondamentali di py-spy è la possibilità di effettuare il profiling della memoria senza richiedere modifiche al codice o il riavvio dell'applicazione. Lo strumento è inoltre abile nel catturare metadati dettagliati dai campioni di profiling, aumentando la profondità delle analisi ottenute. Anche se py-spy si concentra principalmente su Python, va sottolineato il suo carattere open source con integrazioni di dati che garantiscono flessibilità e trasparenza.
Pros and Cons
Pros:
- Permette un profiling della memoria non intrusivo
- Cattura e fornisce efficacemente metadati approfonditi
- Grazie ai dati open source, garantisce trasparenza e miglioramenti supportati dalla community
Cons:
- Alcune funzionalità avanzate possono richiedere una curva di apprendimento ripida per i principianti
- Essendo progettato specificamente per Python, la versatilità su più linguaggi è limitata
- Manca di un sistema di supporto dedicato, basandosi principalmente sull'assistenza della community.
Ideale per il monitoraggio delle prestazioni con tracciamento degli errori

Sentry Profiling è uno strumento progettato per aiutare gli sviluppatori a monitorare le prestazioni delle applicazioni mentre tengono simultaneamente traccia degli errori. Questa combinazione supporta gli sviluppatori nell'identificare i colli di bottiglia nel codice sorgente, garantendo così un'esperienza utente fluida.
Perché ho scelto Sentry Profiling: Nell'immenso panorama degli strumenti di profilazione, Sentry Profiling ha attirato la mia attenzione. La mia decisione si basa sulla sua duplice capacità di offrire monitoraggio delle prestazioni mantenendo sotto controllo anche gli errori. Dopo averlo confrontato con altri strumenti, Sentry Profiling è davvero il più adatto a chi dà priorità al monitoraggio delle prestazioni combinato con il tracciamento degli errori.
Caratteristiche distintive & integrazioni:
Una delle principali caratteristiche di Sentry Profiling è la sua capacità di approfondire il codice sorgente, permettendo una risoluzione efficiente dei problemi. Inoltre, il suo meccanismo integrato di tracciamento degli errori assicura che gli sviluppatori individuino anomalie prima che incidano sull’esperienza utente. Per quanto riguarda le integrazioni, Sentry si integra con molte piattaforme, tra cui GitHub, Slack e Jira, garantendo agli sviluppatori un ecosistema coeso.
Pros and Cons
Pros:
- Analisi dettagliata del codice sorgente per una risoluzione efficiente dei problemi
- Doppia funzione: monitoraggio delle prestazioni e tracciamento degli errori
- Ampia gamma di integrazioni che aumentano l’utilità dello strumento
Cons:
- Potrebbe risultare troppo complesso per piccoli progetti o principianti
- La fatturazione annuale potrebbe non essere preferita da tutti gli utenti
- Alcuni utenti segnalano una curva di apprendimento più ripida rispetto ad altri strumenti di profilazione.
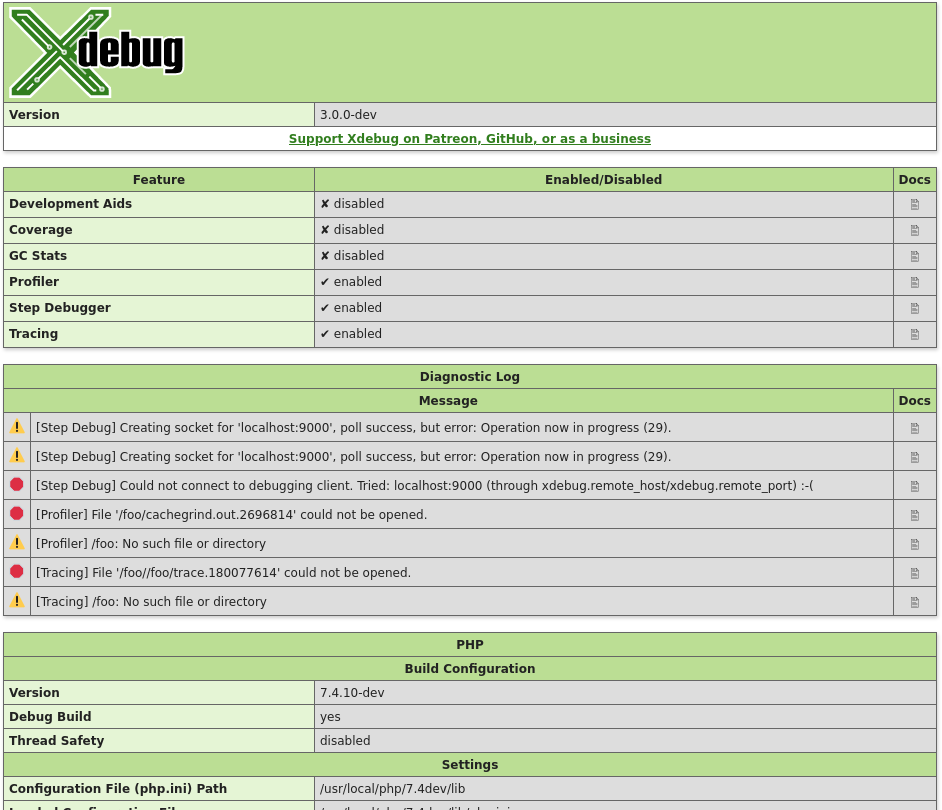
Xdebug, progettato specificamente per PHP, è uno strumento indispensabile con capacità di debug dettagliate. Affrontando le sfide incontrate durante lo sviluppo PHP, consolida la sua posizione come scelta principale per chi necessita di una soluzione di debug e sviluppo specifica per PHP.
Perché ho scelto Xdebug: Nella selezione degli strumenti per il debug di PHP, Xdebug si è sempre distinto come uno dei migliori nelle mie valutazioni. La sua precisione nell'identificare problemi di performance e l'approfondita analisi dell'ambiente di runtime PHP lo differenziano nettamente. Ho riconosciuto queste qualità e ho determinato con sicurezza che Xdebug è il migliore per il debug e lo sviluppo PHP.
Caratteristiche principali & integrazioni:
Xdebug eccelle per la sua capacità di individuare rapidamente i problemi di performance, permettendo agli sviluppatori di risolverli in modo efficace. Le sue funzionalità forniscono informazioni sulla distribuzione delle risorse in fase di esecuzione, garantendo un uso efficiente delle risorse. Inoltre, la compatibilità con numerosi plugin assicura un'esperienza di sviluppo più fluida e integrata.
Pros and Cons
Pros:
- Individua con precisione i problemi di performance nelle applicazioni PHP
- Approfondita analisi dell'allocazione delle risorse in runtime
- Integrazione con numerosi plugin
Cons:
- Curva di apprendimento più ripida per i principianti
- Potrebbe introdurre overhead su server in produzione
- La configurazione può essere complessa per applicazioni articolate
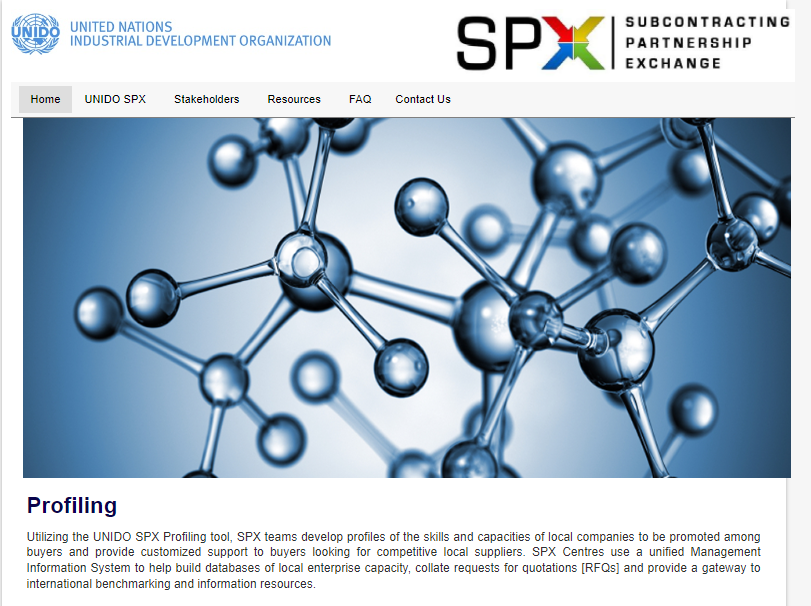
SPX, uno strumento innovativo per il data profiling, è progettato principalmente per soddisfare le esigenze specifiche della profilazione di prodotti industriali. Date le complessità di questo settore, SPX è in una posizione unica per offrire capacità di profilazione approfondite, rafforzando il suo status di prodotto 'ideale per' la profilazione di prodotti industriali.
Perché ho scelto SPX: Durante il mio rigoroso processo di selezione, SPX si è distinto come un punto di riferimento. Confrontando vari strumenti, l'approccio su misura di SPX per i prodotti industriali lo ha fatto emergere. Il suo impegno per la qualità dei dati e le sue capacità di profilazione complete mi hanno portato a stabilire che, nel campo della profilazione industriale, SPX non ha rivali.
Caratteristiche principali & integrazioni:
SPX vanta robuste funzionalità per la qualità dei dati che assicurano una profilazione affidabile e utilizzabile. Il supporto per IDE (Ambiente di Sviluppo Integrato) lo rende versatile e facile da usare. Inoltre, offre integrazioni con diverse piattaforme .NET, ampliando la sua utilità e rendendolo compatibile con svariate applicazioni aziendali.
Pros and Cons
Pros:
- Focus dedicato sulla profilazione di prodotti industriali
- Forte attenzione alla qualità dei dati
- Si integra bene con le piattaforme .NET
Cons:
- Potrebbe non essere adatto alla profilazione non industriale
- Richiede competenze specifiche per sfruttarne appieno il potenziale
- Può essere percepito come di nicchia, data l'attenzione specifica all'industria

Prefix offre agli sviluppatori una visione chiara del comportamento del loro codice in tempo reale. Progettato specificamente per le workstation di sviluppo, mette a disposizione funzionalità di tracciamento del codice live, rendendolo uno strumento prezioso per chi cerca una prospettiva in tempo reale sulle prestazioni del proprio codice, in perfetta sintonia con la sua affermazione 'migliore per'.
Perché ho scelto Prefix: Prefix si è distinto tra la moltitudine di strumenti che ho esaminato. Il suo focus unico sul tracciamento live del codice, pensato in particolare per gli ambienti di sviluppo, ha attirato la mia attenzione. Permette agli sviluppatori di tracciare il codice in tempo reale sulle proprie workstation, perciò l'ho ritenuto il migliore per questo uso specifico.
Funzionalità e integrazioni principali:
Il punto di forza di Prefix è la sua funzione di profilazione del codice live, che fornisce feedback immediati sul comportamento del codice. Le sue capacità di analisi big data aiutano inoltre gli sviluppatori a comprendere grandi moli di dati in tempo reale. Per quanto riguarda le integrazioni, Prefix si inserisce facilmente in diversi workflow di automazione, soddisfacendo le esigenze dei cicli di sviluppo moderni.
Pros and Cons
Pros:
- Tracciamento live del codice direttamente su workstation di sviluppo
- Potenti capacità di analisi big data
- Integrazione efficiente con varie piattaforme di automazione
Cons:
- Potrebbe essere meno adatto al monitoraggio in ambienti di produzione
- Richiede una certa familiarità con la profilazione del codice per sfruttarne appieno il potenziale
- Meno completo nelle funzionalità rispetto ad alcuni strumenti di profilazione dedicati
Altri strumenti di profiling degni di nota
Di seguito trovi un elenco di ulteriori strumenti di profiling che ho selezionato ma che non sono entrati nella top 10. Vale comunque la pena darci un’occhiata.
- Pyroscope
Ideale per il profiling continuo in tempo reale
- Bubbleprof
Ideale per la visualizzazione delle operazioni async di Node.js
- Orbit Profiler
Ideale per lo sviluppo di videogiochi e applicazioni grafiche


Recensioni correlate
- Software per la qualità dei dati
- Strumenti di monitoraggio delle prestazioni
- Strumenti di monitoraggio delle applicazioni
Criteri di selezione degli strumenti di profiling
Nella scelta dei migliori strumenti di profiling da includere in questa lista, ho considerato le esigenze comuni degli acquirenti e i punti dolenti come l'identificazione dei colli di bottiglia delle prestazioni e l'integrazione con gli ambienti di sviluppo esistenti. Ho inoltre utilizzato il seguente schema per mantenere la mia valutazione strutturata ed equa:
Funzionalità di base (25% del punteggio totale)
Per essere inclusa in questa lista, ogni soluzione doveva soddisfare questi casi d'uso comuni:
- Analizzare l'utilizzo della CPU
- Monitorare l'allocazione della memoria
- Individuare i colli di bottiglia delle prestazioni
- Profilare applicazioni multithread
- Generare report dettagliati
Funzionalità distintive aggiuntive (25% del punteggio totale)
Per restringere ulteriormente la selezione, ho cercato anche funzionalità uniche come:
- Analisi dei dati in tempo reale
- Integrazione con pipeline CI/CD
- Supporto a sistemi distribuiti
- Dashboard personalizzabili
- Strumenti avanzati di visualizzazione
Usabilità (10% del punteggio totale)
Per valutare l'usabilità di ogni sistema, ho considerato i seguenti aspetti:
- Interfaccia utente intuitiva
- Navigazione semplice
- Curva di apprendimento ridotta
- Impostazioni personalizzabili
- Design reattivo
Onboarding (10% del punteggio totale)
Per valutare l'esperienza di onboarding per ogni piattaforma, ho considerato i seguenti aspetti:
- Disponibilità di video formativi
- Tour interattivi del prodotto
- Accesso a template
- Assistenza tramite chatbot
- Webinar dal vivo
Assistenza clienti (10% del punteggio totale)
Per valutare i servizi di assistenza clienti offerti da ciascun fornitore di software, ho considerato quanto segue:
- Disponibilità 24/7
- Molteplici canali di supporto
- Tempo di risposta
- Personale competente
- Disponibilità di FAQ
Rapporto qualità-prezzo (10% del punteggio totale)
Per valutare il rapporto qualità-prezzo di ciascuna piattaforma, ho tenuto conto di:
- Prezzi competitivi
- Opzioni di abbonamento a livelli
- Disponibilità di prova gratuita
- Costo rispetto alle funzionalità offerte
- Sconti per piani annuali
Recensioni dei clienti (10% del punteggio totale)
Per avere un’idea della soddisfazione generale dei clienti, ho valutato i seguenti aspetti leggendo le recensioni:
- Punteggio di soddisfazione complessiva
- Pro e contro più frequentemente menzionati
- Frequenza degli aggiornamenti
- Problemi segnalati dagli utenti
- Testimonianze da industrie simili
Come scegliere gli strumenti di profilazione
È facile perdersi tra lunghe liste di funzionalità e strutture di prezzo complesse. Per aiutarti a restare focalizzato durante il tuo processo di selezione del software, ecco una checklist di fattori da tenere in considerazione:
| Fattore | Cosa considerare |
|---|---|
| Scalabilità | Lo strumento può crescere insieme al tuo team? Valuta se gestisce carichi di dati e numeri di utenti crescenti senza sacrificare le prestazioni. Assicurati che sia adatto alle esigenze attuali e future. |
| Integrazioni | Si collega facilmente ai sistemi già in uso? Verifica la compatibilità con gli ambienti di sviluppo e con gli altri strumenti utilizzati quotidianamente dal team. Evita soluzioni che richiedono workaround complessi per l’integrazione. |
| Personalizzazione | Puoi adattare lo strumento al tuo flusso di lavoro? Cerca la possibilità di personalizzare dashboard, report e avvisi. Garantisciti che si adatti ai processi del team senza richiedere configurazioni estese. |
| Facilità d’uso | Lo strumento è intuitivo per tutti i membri del team? Una curva di apprendimento ripida può ridurre la produttività. Privilegia navigazione semplice e istruzioni chiare. Prova l’interfaccia per assicurarti che sia accessibile anche ai nuovi utenti. |
| Implementazione e onboarding | Quanto velocemente il team può iniziare a usarlo? Considera la disponibilità di risorse formative e supporto durante la fase di configurazione. Un onboarding fluido può fare la differenza nell’adozione ed efficacia dello strumento. |
| Costo | Il prezzo rientra nel budget? Valuta il costo totale, inclusi eventuali costi nascosti per funzionalità aggiuntive o supporto. Confronta i piani di abbonamento e prendi in considerazione la sostenibilità economica nel lungo termine. |
| Tutela della sicurezza | I dati e le operazioni sono protetti? Verifica la conformità agli standard di protezione dei dati e cerca funzionalità come crittografia e controlli di accesso. Non compromettere la sicurezza per risparmiare. |
| Disponibilità dell’assistenza | L’assistenza è disponibile quando serve? Controlla orari e canali di supporto del fornitore. Tempi di risposta rapidi e assistenza competente possono influenzare molto l’esperienza del team con lo strumento. |
Che cos’è uno strumento di profilazione?
Gli strumenti di profilazione sono software che ti aiutano a misurare le prestazioni del tuo codice così da individuare funzioni lente, problemi di memoria o un uso inefficiente delle risorse. Sono utilizzati principalmente da sviluppatori e ingegneri che hanno bisogno di comprendere il comportamento delle loro applicazioni durante l’esecuzione e scoprire dove si nascondono i problemi di prestazioni.
Grafici delle chiamate, monitoraggio dell’uso della memoria e campionamento della CPU aiutano a individuare i colli di bottiglia, comprendere il carico di sistema e migliorare i tempi di risposta. Questi strumenti facilitano l’ottimizzazione delle applicazioni senza andare alla cieca per capire cosa le rallenta.
Caratteristiche
Quando selezioni strumenti di profilazione, presta attenzione alle seguenti caratteristiche chiave:
- Analisi dell'utilizzo della CPU: Aiuta a identificare quali parti dell'applicazione consumano più potenza di elaborazione, favorendo l'ottimizzazione.
- Monitoraggio dell'allocazione della memoria: Traccia l'utilizzo della memoria per rilevare perdite e inefficienze, garantendo prestazioni più fluide.
- Rilevamento dei colli di bottiglia delle prestazioni: Individua le aree lente nel codice, consentendo miglioramenti mirati.
- Capacità di integrazione: Si collega senza problemi agli ambienti di sviluppo esistenti, migliorando il flusso di lavoro.
- Cruscotti personalizzabili: Permette agli utenti di personalizzare viste e report secondo esigenze specifiche, migliorando l'usabilità.
- Analisi dei dati in tempo reale: Fornisce informazioni immediate sulle prestazioni dell'applicazione, facilitando decisioni rapide.
- Strumenti avanzati di visualizzazione: Offre rappresentazioni grafiche dei dati, rendendo più comprensibili informazioni complesse.
- Garanzie di sicurezza: Garantisce la protezione dei dati tramite crittografia e controlli di accesso, mantenendo la fiducia degli utenti.
- Tour prodotti interattivi: Guida i nuovi utenti nelle funzioni, migliorando l'esperienza di onboarding.
- Disponibilità di supporto 24/7: Fornisce assistenza continua per risolvere tempestivamente le problematiche, aumentando la soddisfazione degli utenti.
Benefici
L'implementazione di strumenti di profilazione offre diversi vantaggi per il tuo team e la tua azienda. Eccone alcuni a cui puoi guardare con aspettativa:
- Prestazioni migliorate: Identificando i problemi di utilizzo di CPU e memoria, questi strumenti aiutano a ottimizzare velocità ed efficienza dell'applicazione.
- Debug potenziato: Il rilevamento dei colli di bottiglia delle prestazioni consente agli sviluppatori di individuare e risolvere rapidamente le sezioni di codice problematiche.
- Migliore gestione delle risorse: Il monitoraggio dell'allocazione della memoria assicura un uso efficiente delle risorse di sistema, prevenendo sprechi e migliorando la stabilità.
- Produttività aumentata: L'analisi dei dati in tempo reale e i cruscotti personalizzabili ottimizzano il flusso di lavoro, permettendo ai team di concentrarsi sui compiti critici.
- Maggiore sicurezza: Funzionalità come la crittografia e i controlli di accesso proteggono i dati sensibili, garantendo conformità e fiducia.
- Onboarding semplificato: I tour prodotti interattivi e le risorse formative rendono più facile per i nuovi utenti acquisire rapidamente familiarità.
- Supporto affidabile: Con una disponibilità 24/7, il supporto clienti garantisce che le problematiche vengano risolte rapidamente, minimizzando i tempi di inattività.
Costi e Tariffe
La scelta degli strumenti di profilazione richiede una comprensione dei diversi modelli e piani di prezzo disponibili. I costi variano in base alle funzionalità, alla dimensione del team, agli extra e altro ancora. La tabella qui sotto riassume i piani più comuni, i loro prezzi medi e le caratteristiche tipiche incluse nelle soluzioni di strumenti di profilazione:
Tabella comparativa dei piani per strumenti di profilazione
| Tipo di Piano | Prezzo Medio | Funzionalità Comuni |
|---|---|---|
| Piano Gratuito | $0 | Monitoraggio base di CPU e memoria, reportistica limitata e supporto dalla community. |
| Piano Personale | $10-$30/user/month | Analisi avanzata delle prestazioni, cruscotti personalizzabili e supporto via email. |
| Piano Business | $50-$100/user/month | Analisi dati in tempo reale, capacità di integrazione, funzionalità di sicurezza avanzate e supporto prioritario. |
| Piano Enterprise | $150-$300/user/month | Monitoraggio completo, account manager dedicato, opzioni di sicurezza avanzate e supporto premium 24/7. |
Domande più comuni sugli strumenti di profilazione (FAQ)
In che modo gli strumenti di profilazione aiutano nell’ottimizzazione delle prestazioni?
Gli strumenti di profilazione analizzano il tuo codice per individuare i colli di bottiglia delle prestazioni, consentendoti di ottimizzare e migliorare l’efficienza. Forniscono informazioni sull’utilizzo della CPU, sull’allocazione della memoria e su altri parametri che possono rallentare la tua applicazione. Utilizzando questi strumenti, puoi apportare miglioramenti mirati.
Come gestiscono gli strumenti di profilazione le applicazioni su larga scala?
Gli strumenti di profilazione progettati per uso aziendale possono gestire applicazioni su larga scala offrendo analisi dettagliate e approfondimenti di alto livello. Sono in grado di gestire carichi di dati e numeri di utenti elevati senza compromettere le prestazioni. Se lavori con applicazioni di grandi dimensioni, verifica la presenza di funzionalità come il supporto ai sistemi distribuiti.
In che modo gli strumenti di profilazione migliorano il mio processo di sviluppo?
Gli strumenti di profilazione possono migliorare il tuo processo di sviluppo identificando e risolvendo rapidamente i problemi di prestazioni. Offrono dati in tempo reale e report personalizzabili, aiutandoti a prendere decisioni consapevoli. Questo porta a un codice più efficiente e a un ciclo di sviluppo più fluido.
Vale la pena investire in uno strumento di profilazione premium?
Mentre gli strumenti gratuiti possono essere efficaci per progetti più piccoli o per esigenze di profilazione di base, investire in uno strumento premium diventa essenziale per applicazioni più grandi e complesse. Gli strumenti premium offrono spesso funzionalità avanzate, miglior supporto e opzioni di scalabilità, risultando preziosi per garantire prestazioni ottimali dell’applicazione.
Gli strumenti di profilazione possono essere usati con qualsiasi linguaggio di programmazione?
La maggior parte degli strumenti di profilazione supporta diversi linguaggi di programmazione, ma non tutti supportano ogni linguaggio. Prima di scegliere uno strumento, è fondamentale verificarne la compatibilità con i linguaggi specifici utilizzati nella tua applicazione.
E ora?
Se sei alla ricerca di strumenti di profilazione, contatta gratuitamente un consulente SoftwareSelect per ricevere consigli personalizzati.
Compila un modulo e avrai una breve chiamata in cui approfondiranno le tue esigenze specifiche. Riceverai quindi una lista ristretta di software da valutare. Ti supporteranno anche durante tutto il processo d’acquisto, incluse le negoziazioni sul prezzo.