

Gli strumenti di monitoraggio delle API aiutano a tenere sotto controllo le prestazioni e lo stato delle API, così da poter individuare tempestivamente i problemi e mantenere i servizi sempre operativi.
Molti team iniziano a cercare questi strumenti quando si trovano ad affrontare problemi come periodi di inattività che non sono riusciti a rilevare in tempo, errori causati da modifiche alle API esterne o lacune nel monitoraggio tra i diversi ambienti. Senza la soluzione giusta, è facile non notare i segnali di avvertimento finché gli utenti non iniziano a lamentarsi.
Ho testato questi strumenti sia in configurazioni locali sia in ambienti cloud, prestando particolare attenzione alla loro capacità di gestire il traffico e gli avvisi del mondo reale. In questa guida condividerò gli aspetti che si sono distinti, le carenze riscontrate e come trovare uno strumento adatto al proprio insieme di tecnologie e al proprio flusso di lavoro.
Perché fidarsi dei nostri consigli sui software
6,700+
Reviews
20
Industry experts
16+
Evaluation factors
14
Years
Il nostro team testa e recensisce software dal 2012. In quanto leader tecnologici noi stessi, sappiamo quanto sia difficile — e importante — scegliere il software giusto.
Per questa guida, abbiamo valutato gli strumenti attraverso test praticie ricerche indipendenti, assegnando un punteggio agli strumenti in base ai nostri criteri di selezione.
Le nostre recensioni riflettono il nostro giudizio editoriale umano, non un discorso di vendita.
Revisori esperti:
- Paulo Gardini MiguelDirettore tecnico
 Tim FisherVP dell'IA
 Gabriel RosasTech Lead e architetto software
 Christhian GruhnTech Lead e architetto della piattaforma

Riepilogo dei migliori strumenti di monitoraggio delle API
| Tool | Best For | Trial Info | Price | ||
|---|---|---|---|---|---|
| 1 | Ideale per il monitoraggio sintetico su scala cloud | Prova gratuita di 14 giorni | Da $31/utente/mese (fatturato annualmente) | Website | |
| 2 | Ideale per il rilevamento anomalie tramite IA per API | Prova gratuita di 30 giorni | Da $200/mese (fatturazione annuale) | Website | |
| 3 | Ideale per il monitoraggio API su più gateway | Demo gratuita disponibile | Prezzo su richiesta | Website | |
| 4 | Ideale per il monitoraggio delle transazioni multi-step | Prova gratuita di 30 giorni + demo gratuita disponibile | Da $10/mese (fatturato annualmente) | Website | |
| 5 | Ideale per il monitoraggio dell'uptime e report dettagliati | Prova gratuita di 30 giorni + demo disponibile | Da $10/utente/mese | Website | |
| 6 | Ideale per intuizioni operative con notifiche intelligenti | Versione di prova gratuita disponibile | Da $69/utente/mese (fatturazione annuale) | Website | |
| 7 | Ideale per ottenere informazioni sulle prestazioni delle API in tempo reale | Piano gratuito disponibile | Da $77/mese (fatturati annualmente) | Website | |
| 8 | Ideale per la gestione del ciclo di vita delle API a livello enterprise | Prova gratuita di 30 giorni + demo gratuita disponibile | Prezzo su richiesta | Website | |
| 9 | Ideale per la visualizzazione dei dati in tempo reale e le capacità di ricerca | Prova gratuita di 7 giorni disponibile | Da $45/utente/mese | Website | |
| 10 | Ideale per il testing e il monitoraggio delle API a misura di sviluppatore | Piano gratuito disponibile | A partire da $15/utente/mese | Website |


Recensioni dei migliori strumenti di monitoraggio delle API
 Ideale per il monitoraggio sintetico su scala cloud
- Prova gratuita di 14 giorni
- Da $31/utente/mese (fatturato annualmente)
Visit WebsiteCustomer Rating:4.5/5This rating combines scores from multiple user review sites to reflect overall customer sentiment about the product.
Dashboard globale delle prestazioni dello strumento di monitoraggio API di Datadog Datadog offre una piattaforma impressionante, incentrata principalmente sul monitoraggio cloud. La sua funzione di monitoraggio sintetico si distingue, aiutando le aziende a simulare le interazioni degli utenti e a tracciare le prestazioni di applicazioni e API su scala cloud.
Perché ho scelto Datadog: Nella mia ricerca di soluzioni di monitoraggio focalizzate sul cloud, le capacità di Datadog erano difficili da ignorare. Il suo focus sul monitoraggio sintetico su scala cloud e l'ampiezza delle sue funzionalità lo hanno reso una scelta ovvia. Ritengo che Datadog sia la scelta migliore per le aziende che devono simulare e monitorare le prestazioni negli ambienti cloud.
Funzionalità e integrazioni principali:
Il monitoraggio sintetico di Datadog può simulare interazioni da località globali, garantendo la coerenza delle prestazioni a livello mondiale. Le visualizzazioni dello strumento, inclusi i flame graph, offrono una visione approfondita delle prestazioni delle applicazioni.
Per quanto riguarda le integrazioni, Datadog supporta una miriade di piattaforme tra cui AWS, Azure, Google Cloud e numerose integrazioni di terze parti.
Pros and Cons
Pros:
- Capacità avanzate di monitoraggio sintetico
- Ampia gamma di integrazioni cloud
- Strumenti di visualizzazione potenti per l'analisi delle prestazioni
Cons:
- Può risultare costoso per le organizzazioni più piccole
- La vastità delle funzionalità può spaventare i principianti
- Alcune configurazioni possono richiedere competenze tecniche avanzate
 Ideale per il rilevamento anomalie tramite IA per API
- Prova gratuita di 30 giorni
- Da $200/mese (fatturazione annuale)
Visit WebsiteCustomer Rating:4.6/5This rating combines scores from multiple user review sites to reflect overall customer sentiment about the product.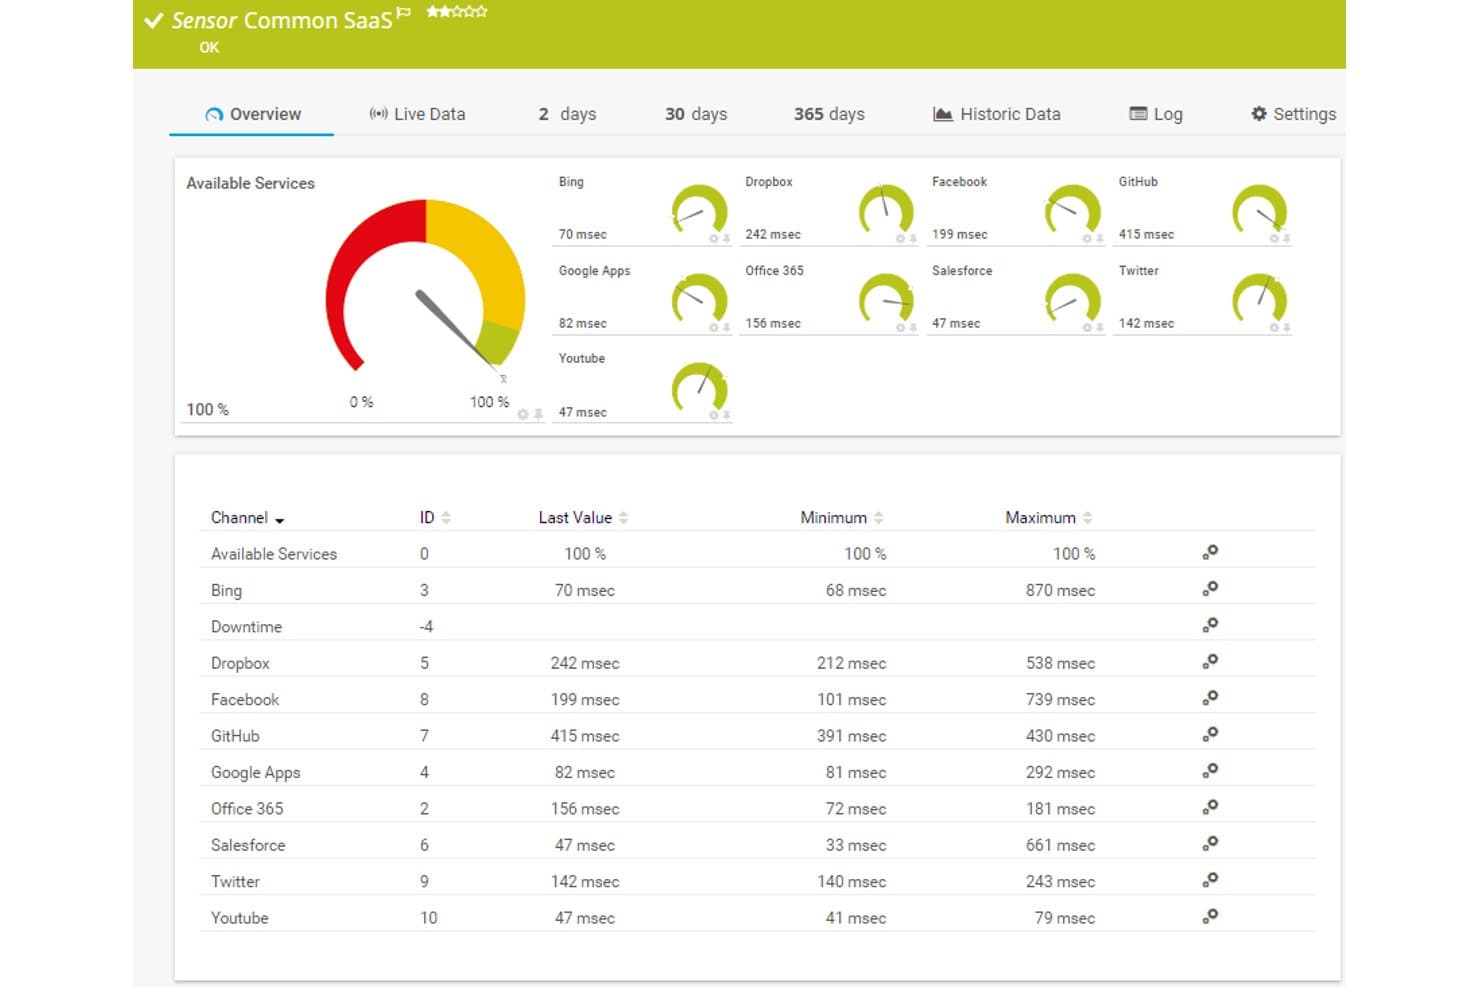
Paessler PRTG offre una dashboard SaaS comune che mostra in tempo reale i tempi di risposta e la disponibilità per servizi cloud come Dropbox, Office 365, Salesforce e GitHub. Paessler PRTG è una piattaforma unificata per il monitoraggio dell'infrastruttura IT che tiene traccia di endpoint API, dispositivi di rete, server e applicazioni utilizzando sensori per protocolli REST API, SNMP, WMI e HTTP.
Per chi è più adatto Paessler PRTG?
PRTG è particolarmente indicato per i team infrastrutturali e delle operazioni IT di aziende di medie e grandi dimensioni che devono monitorare le API insieme all'intero ambiente di rete e server.
Perché ho scelto Paessler PRTG
Ho scelto Paessler PRTG perché il suo rilevamento delle anomalie basato su intelligenza artificiale va oltre le soglie statiche. La piattaforma apprende il comportamento di base per ogni sensore API, quindi quando tempi di risposta o tassi di errore si discostano dai modelli normali, PRTG lo segnala automaticamente. Apprezzo in particolare come il sensore REST Custom v2 mappi i valori di risposta JSON su singoli canali, offrendo al motore di rilevamento delle anomalie dati dettagliati e specifici per metrica da analizzare anziché trattare una chiamata API intera come unico punto dati.
Funzionalità chiave di Paessler PRTG
- Sensore REST Custom v2: Monitora qualsiasi endpoint REST API e mappa i campi JSON o XML restituiti come canali di monitoraggio personalizzati.
- Regole di avviso personalizzate: Attiva notifiche tramite email, SMS o push in base a stati e soglie dei sensori completamente configurabili.
- Opzioni di implementazione flessibili: Offre SaaS (PRTG Hosted Monitor), installazione on-premise e ibrida per ambienti aziendali e sensibili alla sicurezza.
- Ampio supporto ai protocolli: Supporta SNMP, WMI, NetFlow, MQTT, OPC UA e altro per monitorare una vasta gamma di endpoint IT e OT.
Integrazioni Paessler PRTG
Paessler PRTG offre integrazioni native con PagerDuty, Opsgenie, AWS CloudWatch, Azure Monitor e dispone di un'API per integrazioni personalizzate.
Pros and Cons
Pros:
- Rilevamento anomalie tramite IA senza configurazione manuale delle soglie
- Supporta il deployment on-premise per ambienti air-gapped
- Mappatura JSON per canale che offre approfondimenti dettagliati sulle API
Cons:
- Test nativi deboli per workflow API multi-step sintetici
- La configurazione basata sui sensori richiede tempo manuale
Learn more about Paessler PRTG: Ideale per il monitoraggio API su più gateway
- Demo gratuita disponibile
- Prezzo su richiesta

DigitalAPI offre visibilità sulla qualità delle API, sull'utilizzo e sulle prestazioni dei gateway in tutto il tuo patrimonio API. DigitalAPI offre una piattaforma versatile per le aziende che desiderano migliorare la gestione delle API, coprendo tutti gli aspetti dalla scoperta alla monetizzazione. Progettato tenendo conto di settori regolamentati come quello sanitario e bancario, mette a disposizione un sistema di controllo unificato e un portale per sviluppatori che semplifica il deployment delle API. Questo lo rende una soluzione solida per le imprese che necessitano di una forte governance e sicurezza nelle operazioni API.
Perché ho scelto DigitalAPI
Ho scelto DigitalAPI per la sua governance centralizzata delle API e le analisi dettagliate, entrambe essenziali per un monitoraggio efficace. Il sistema di controllo unificato permette di gestire le API su diversi gateway mantenendo coerenza e sicurezza. Le sue analisi offrono una chiara visibilità sulle prestazioni delle API, facilitando l'individuazione e la risoluzione rapida dei problemi. Queste funzionalità rendono DigitalAPI una scelta valida per i team che puntano a migliorare il monitoraggio delle API.
Funzionalità chiave di DigitalAPI
Oltre alle sue capacità di governance e analytics, ho trovato utili anche diverse altre funzionalità per il monitoraggio delle API:
- Marketplace API: Consente la monetizzazione delle API tramite una piattaforma esterna, contribuendo ad ampliare le opportunità di guadagno.
- Portale sviluppatori: Propone un hub centrale dove gli sviluppatori possono accedere alle API, rendendo l'integrazione e la gestione più immediate.
- Deployment con un clic: Semplifica il deployment delle API su più gateway, riducendo tempi e carico operativo.
- Integrazione AI: Aggiunge funzionalità di intelligenza artificiale alle API, supportando funzionalità avanzate e automazione.
Integrazioni DigitalAPI
Attualmente, DigitalAPI non indica integrazioni native disponibili.
Pros and Cons
Pros:
- Governance centralizzata su più gateway
- Analisi dettagliate delle prestazioni API
- Helix Gateway supporta l'intero ciclo di vita
Cons:
- Nessuna integrazione nativa elencata
- Dettagli sui prezzi non disponibili pubblicamente
Learn more about DigitalAPI: Ideale per il monitoraggio delle transazioni multi-step
- Prova gratuita di 30 giorni + demo gratuita disponibile
- Da $10/mese (fatturato annualmente)
Visit WebsiteCustomer Rating:4.7/5This rating combines scores from multiple user review sites to reflect overall customer sentiment about the product.
Site24x7 monitora le transazioni API multi-step per tracciare tempi di risposta ed errori. Site24x7 è una soluzione ideale per le aziende che desiderano garantire il funzionamento fluido e affidabile delle proprie API, grazie al supporto per il monitoraggio delle transazioni multi-step che permette di tracciare i flussi di lavoro API in modo più efficace. Se operi in un settore in cui le prestazioni costanti delle applicazioni sono fondamentali, gli strumenti di monitoraggio delle API di Site24x7 ti aiutano a osservare e risolvere in tempo reale il comportamento delle API, affrontando i problemi prima che influiscano sugli utenti. Sfruttando queste funzionalità, puoi mantenere la disponibilità del servizio e consentire al tuo team di concentrarsi sulla fornitura di esperienze digitali affidabili.
Perché ho scelto Site24x7
Ho scelto Site24x7 per il suo monitoraggio delle transazioni multi-step, che aiuta a tracciare i flussi di lavoro API attraverso richieste sequenziali. La piattaforma supporta anche il monitoraggio di API REST, SOAP, gRPC e WebSocket, permettendo di osservare i tempi di risposta e i tassi di errore. Il sistema di allerta segnala quando si verificano problemi di prestazioni, aiutando i team a intervenire tempestivamente. Queste funzionalità rendono Site24x7 utile per le aziende che dipendono da integrazioni API stabili.
Caratteristiche principali di Site24x7
Oltre al monitoraggio delle transazioni multi-step, Site24x7 offre:
- Monitoraggio da posizioni globali: Con oltre 130 località in tutto il mondo, puoi assicurarti che le tue API funzionino in modo ottimale per gli utenti ovunque si trovino.
- Validazione dei contenuti: Site24x7 verifica che la risposta dell’API contenga i contenuti previsti, assicurando l’integrità dei dati.
- Notifiche istantanee: Ricevi avvisi immediati per eventuali problemi di prestazioni delle API, così puoi rispondere rapidamente e mantenere la qualità del servizio.
Integrazioni di Site24x7
Le integrazioni includono ServiceNow, PagerDuty, Jira, Slack, Microsoft Teams, AWS, Azure, Kubernetes e altro ancora.
Pros and Cons
Pros:
- Monitoraggio flessibile che si integra facilmente con molteplici componenti dell'infrastruttura
- Monitoraggio full-stack basato su AI che supporta la gestione di infrastrutture multicloud
- Procedura di configurazione rapida che copre il monitoraggio di siti web e risorse cloud
Cons:
- Bug negli avvisi causano problemi quando si aggiungono nuove configurazioni di monitoraggio
- Configurazione complessa che rallenta l'avvio e la comprensione della piattaforma
Learn more about Site24x7: Ideale per il monitoraggio dell'uptime e report dettagliati
- Prova gratuita di 30 giorni + demo disponibile
- Da $10/utente/mese
Visit WebsiteCustomer Rating:4.5/5This rating combines scores from multiple user review sites to reflect overall customer sentiment about the product.
Monitoraggio dell'uptime degli strumenti API di Pingdom Pingdom è principalmente riconosciuto per la sua efficacia nel monitoraggio dell'uptime, garantendo che API e siti web rimangano operativi. A ciò si aggiunge la sua capacità di generare report approfonditi, offrendo agli utenti una comprensione dettagliata delle prestazioni delle loro API.
Perché ho scelto Pingdom: Nella mia ricerca di strumenti di monitoraggio affidabili, la dedizione di Pingdom al monitoraggio dell'uptime, insieme alla reportistica dettagliata, è stata indiscutibile. Ho apprezzato il suo approccio diretto nel fornire informazioni tempestive su eventuali periodi di inattività. Per i team che danno priorità a un uptime costante e a report completi, Pingdom è chiaramente lo strumento di riferimento.
Caratteristiche e integrazioni in evidenza:
Pingdom eccelle grazie al suo monitoraggio in tempo reale che notifica immediatamente gli utenti in caso di downtime. La sua analisi delle cause profonde aiuta a risolvere rapidamente i problemi.
Per quanto riguarda le integrazioni, Pingdom si integra con piattaforme come Slack, Opsgenie e PagerDuty.
Pros and Cons
Pros:
- Monitoraggio dell'uptime in tempo reale e preciso
- Analisi dettagliata delle cause profonde
- Sistema di avvisi flessibile
Cons:
- Le app mobili possono talvolta subire rallentamenti
- Funzionalità avanzate disponibili solo nei piani superiori
- La conservazione dei dati storici varia a seconda del piano tariffario
Learn more about Pingdom: Ideale per intuizioni operative con notifiche intelligenti
- Versione di prova gratuita disponibile
- Da $69/utente/mese (fatturazione annuale)
Visit WebsiteCustomer Rating:2/5This rating combines scores from multiple user review sites to reflect overall customer sentiment about the product.
Dashboard di Smartbear Smartbear si è affermato nel mondo delle API come uno strumento sofisticato che offre analisi approfondite unite a meccanismi di allerta avanzati. Unendo monitoraggio di livello superiore a notifiche intelligenti, aiuta i team non solo a identificare i problemi, ma anche ad agire prontamente su di essi in modo efficiente.
Perché ho scelto Smartbear: Nella mia ricerca dei migliori strumenti di monitoraggio, la capacità di Smartbear di offrire intuizioni realmente utilizzabili ha attirato la mia attenzione. In fase di scelta, ho apprezzato il suo solido sistema di notifiche, che va oltre l’ordinario, distinguendosi rispetto agli altri. Per me è chiaro che Smartbear è la scelta ottimale per quei team che danno priorità alle informazioni operative supportate da notifiche intelligenti.
Caratteristiche principali e integrazioni:
Smartbear offre un monitoraggio avanzato delle prestazioni, che include controlli di uptime delle API, funzionalità e validazione dei dati. Inoltre, il suo monitoraggio sintetico può simulare scenari utente complessi su vari endpoint.
Per quanto riguarda le integrazioni, Smartbear si collega in modo efficace a piattaforme come Slack, JIRA e PagerDuty.
Pros and Cons
Pros:
- Analisi approfondite
- Meccanismi di notifica robusti e tempestivi
- Simula facilmente percorsi utente complessi
Cons:
- Curva di apprendimento leggermente ripida per i principianti
- Funzionalità limitate nel piano base
- Alcuni utenti potrebbero trovare l'interfaccia poco intuitiva
Learn more about SmartBear: Ideale per ottenere informazioni sulle prestazioni delle API in tempo reale
- Piano gratuito disponibile
- Da $77/mese (fatturati annualmente)
Visit WebsiteCustomer Rating:4.5/5This rating combines scores from multiple user review sites to reflect overall customer sentiment about the product.
Gli utenti possono visualizzare le informazioni sulle API in tempo reale direttamente dalla dashboard di Treblle. Treblle è una piattaforma APIOps end-to-end progettata per aiutare i team di ingegneria e di prodotto a gestire in modo efficiente le proprie API REST. Offre strumenti completi per l'osservabilità, la governance, l'analisi e la sicurezza delle API.
Perché ho scelto Treblle: Offre il monitoraggio in tempo reale delle API, che consente di ottenere informazioni sulle prestazioni e sull'attività delle API. Questo permette ai team di identificare e risolvere rapidamente i problemi man mano che si presentano, riducendo al minimo i tempi di inattività e garantendo un'esperienza utente fluida. Le capacità avanzate di logging e tracciamento degli errori di Treblle potenziano ulteriormente il monitoraggio, segnalando ai team gli errori generati dal codice.
Funzionalità e integrazioni principali:
Tra le caratteristiche chiave figura la possibilità di analizzare oltre 40 punti dati specifici per ogni richiesta API e strumenti collaborativi come il tracciamento delle richieste, l'assegnazione di tag e i commenti per promuovere il lavoro di squadra e agevolare il debug. Inoltre, la funzionalità di sviluppo API automatizzato garantisce che la documentazione e i dati degli endpoint siano sempre aggiornati.
Le integrazioni includono PHP, Laravel, Lumen, Symfony, JavaScript, Node.js, Express, Fastify, Koa, AdonisJS, NestJS, Strapi, .NET, Python, Django, Flask, Ruby, Java e Spring.
Pros and Cons
Pros:
- Offre funzionalità di monitoraggio in tempo reale
- Dispone di una dashboard dettagliata e completa
- Automatizza il processo di documentazione
Cons:
- Opzioni di personalizzazione limitate per alcune funzionalità
- Potrebbe offrire migliori integrazioni per gli avvisi
Learn more about Treblle: Ideale per la gestione del ciclo di vita delle API a livello enterprise
- Prova gratuita di 30 giorni + demo gratuita disponibile
- Prezzo su richiesta

La dashboard di IBM API Connect IBM API Connect è una soluzione completa pensata per le aziende che richiedono una gestione a livello enterprise del ciclo di vita delle API. Facilita la creazione, il deployment, la gestione e il monitoraggio delle API, con un chiaro focus sulle necessità delle grandi imprese.
Perché ho scelto IBM API Connect: Nel valutare gli strumenti per la gestione del ciclo di vita delle API, IBM API Connect si è distinto chiaramente grazie alle sue funzionalità robuste progettate per operazioni su larga scala. La mia decisione è stata influenzata dalla sua reputazione come scelta affidabile per le aziende. A mio giudizio, per le organizzazioni che necessitano di un controllo end-to-end sul ciclo di vita delle API con solidità a livello enterprise, IBM API Connect eccelle.
Funzionalità principali & integrazioni:
IBM API Connect offre una dashboard unificata che fornisce una panoramica sulla salute, l’utilizzo e le prestazioni complessive delle API. Il portale integrato per gli sviluppatori favorisce l’adozione e la collaborazione sulle API.
Per quanto riguarda le integrazioni, supporta la connettività con i servizi IBM Cloud, Watson AI e database aziendali.
Pros and Cons
Pros:
- Gestione completa del ciclo di vita delle API
- Portale sviluppatori integrato per aumentare la collaborazione
- Strumenti di analisi e monitoraggio avanzati
Cons:
- Potrebbe essere troppo impegnativo per le piccole realtà
- La struttura dei prezzi può risultare complessa per alcuni utenti
- La configurazione iniziale e l’integrazione possono richiedere tempo
Learn more about IBM API Connect: Ideale per la visualizzazione dei dati in tempo reale e le capacità di ricerca
- Prova gratuita di 7 giorni disponibile
- Da $45/utente/mese

Dashboard panoramica di Kibana per la scheda di monitoraggio Kibana, una creazione dell'Elastic Stack, svolge un ruolo cruciale nella visualizzazione dei dati di Elasticsearch. La sua abilità nella visualizzazione dei dati in tempo reale, abbinata a potenti capacità di ricerca, aiuta i team tecnologici ad approfondire i propri dati come mai prima d'ora.
Perché ho scelto Kibana: Tra la moltitudine di strumenti di monitoraggio delle API, Kibana ha attirato la mia attenzione grazie alle sue visualizzazioni intuitive e dinamiche. Ho selezionato questo strumento per la sua forza unica nell’aiutare gli utenti a comprendere e agire sui propri dati.
Valutando i suoi meriti, è apparso chiaro che Kibana è davvero la scelta migliore per chi dà valore alla visualizzazione dei dati in tempo reale e a potenti meccanismi di ricerca.
Funzionalità e integrazioni principali:
La dashboard di Kibana offre uno spazio di lavoro personalizzabile per visualizzare, navigare e analizzare dati complessi. La funzione Lens introduce capacità di drag-and-drop per la visualizzazione dei dati. Inoltre, Kibana si integra con Elasticsearch, Logstash e Beats, ampliando notevolmente la sua utilità.
Pros and Cons
Pros:
- Visualizzazione dinamica dei dati in tempo reale
- Integrazione profonda con Elastic Stack
- Ricerca potente su grandi insiemi di dati
Cons:
- Potrebbe risultare complesso per i principianti
- Richiede la configurazione dell'Elastic Stack per ottenere il massimo beneficio
- Le funzionalità avanzate richiedono una curva di apprendimento più ripida
Learn more about Kibana: 10Ideale per il testing e il monitoraggio delle API a misura di sviluppatore
Postman
- Piano gratuito disponibile
- A partire da $15/utente/mese

Dashboard di reportistica del tool di monitoraggio API di Postman Postman si è affermato nel settore tecnologico come il compagno fidato degli sviluppatori per il testing delle API. Con il suo design intuitivo, facilita sia il testing che il monitoraggio, assicurando che le API funzionino come previsto.
Perché ho scelto Postman: La selezione degli strumenti per questa lista ha richiesto un occhio attento all’utilità, e l’approccio orientato agli sviluppatori di Postman era difficile da ignorare. L’ho scelto per il suo design user-friendly che semplifica il complesso mondo del testing delle API. A mio giudizio, per chi cerca una combinazione di semplicità ed efficienza nel testing e nel monitoraggio delle API, Postman rimane una delle migliori scelte.
Caratteristiche principali e integrazioni:
Le collection run di Postman permettono di automatizzare i test, mentre i suoi mock server simulano le risposte delle API senza bisogno di un backend. Lo strumento si integra perfettamente anche con le piattaforme CI/CD più diffuse, garantendo il testing nelle pipeline di sviluppo. Le integrazioni principali includono piattaforme come Jenkins, Travis CI e CircleCI.
Pros and Cons
Pros:
- Interfaccia orientata allo sviluppatore
- Strumenti di testing completi inclusi mock server
- Integrazione robusta con piattaforme CI/CD
Cons:
- Le funzioni di monitoraggio risultano basilari rispetto a strumenti specializzati
- Collezioni di grandi dimensioni possono rallentare l’app
- Le funzionalità avanzate possono richiedere un periodo di apprendimento
Learn more about Postman:
Altri strumenti di monitoraggio delle API
Di seguito è riportato un elenco di ulteriori strumenti di monitoraggio delle API che ho selezionato, ma che non sono rientrati tra i primi 10. Vale sicuramente la pena prenderli in considerazione.
- 11CatchpointIdeale per ottenere insight sull’esperienza applicativa
- 12MoesifIdeale per analisi comportamentale sull'utilizzo delle API
- 13AsteraIdeale per una gestione e integrazione API olistica
- 14APImetricsIdeale per approfondimenti completi sulle prestazioni delle API
- 15UptrendsIdeale per una prospettiva globale con molteplici checkpoint
- 16Dotcom MonitorIdeale per il monitoraggio API a più passaggi
Come Valuto gli Strumenti di Monitoraggio delle API
Divido la mia valutazione in due livelli: le capacità di base che ogni strumento deve offrire—come controlli da più regioni, monitoraggio della latenza e asserzioni—e i fattori differenzianti che distinguono le opzioni migliori.
Funzionalità Principali (Requisiti Fondamentali per Questa Lista)
Quando seleziono gli strumenti per la mia lista, valuto ognuno su una scala da 0 (non offre la funzionalità) a 5 (eccelle in quest'area) per ogni funzione principale elencata di seguito. Quindi, calcolo il punteggio totale dello strumento in percentuale. Ogni strumento deve raggiungere un punteggio totale minimo del 65% per essere considerato per l'inclusione.
- Monitoraggio del Tempo di Attività & Disponibilità: Controllo se lo strumento esegue test HTTP/HTTPS da più regioni globali, dato che un solo checkpoint non rileverebbe interruzioni regionali o problemi con la CDN.
- Monitoraggio delle Prestazioni & Latenza: Oltre ai tempi di risposta grezzi, cerco scomposizioni a cascata (DNS, TLS, TTFB) e dati storici di tendenza che aiutano a individuare un degrado lento prima che gli utenti se ne accorgano.
- Test Sintetici delle API: Valuto il supporto per tutti i metodi HTTP standard, header personalizzati, flussi di autenticazione e intervalli programmati—pensa a refresh di token OAuth o chiamate POST con payload dinamici.
- Monitoraggio di Flussi di Lavoro Multi-Step: Il concatenamento delle richieste è importante. Cerco la possibilità di passare variabili tra i passaggi, come estrarre un token di sessione da una chiamata di login e iniettarlo nelle richieste successive.
- Avvisi & Notifiche: Considero la varietà dei canali (email, Slack, SMS, PagerDuty, webhook) e se lo strumento supporta le politiche di escalation affinché il giusto tecnico reperibile venga avvisato per primo.
- Validazione delle Risposte & Asserzioni: Valuto la profondità delle asserzioni—i codici di stato sono il minimo indispensabile, ma il matching tramite JSON path, controlli regex e validazione dello schema individuano quei problemi sottili di payload che possono interrompere le integrazioni.
Dopo aver ottenuto un elenco di strumenti che soddisfano questi criteri, considero cosa distingue ciascuna piattaforma.
Fattori Differenzianti (Cosa Distingue i Fornitori)
Ecco come confronto e metto a confronto i diversi fornitori:
Funzionalità Distintive
Gli strumenti che possono importare specifiche OpenAPI o raccolte Postman fanno risparmiare ore di configurazione manuale dei monitor, specialmente quando si coprono decine di endpoint. Valuto anche la presenza di plugin nativi per CI/CD—eseguire controlli delle API all'interno di una pipeline GitHub Actions o GitLab consente di individuare cambiamenti interruttivi prima che arrivino in produzione. L'integrazione con il tracing distribuito è un altro elemento da valutare, visto che collegare un monitor fallito a una specifica traccia tra microservizi trasforma un avviso vago in una causa radice concretamente azionabile.
Oltre le Funzionalità
La flessibilità di distribuzione è importante—se il tuo team monitora API interne dietro a un firewall, serve il supporto per agenti privati, non solo controlli ospitati sul cloud. Valuto inoltre quanto bene ogni strumento si integra con gli stack di osservabilità esistenti, verificando la presenza di integrazioni native con piattaforme come Datadog, Grafana e PagerDuty. Un altro fattore che considero è la sicurezza, in particolare RBAC, archiviazione criptata delle credenziali e conformità SOC 2, poiché i monitor API gestiscono spesso token di produzione e flussi di autenticazione sensibili.
Come scegliere gli strumenti di monitoraggio delle API
È facile perdersi in lunghi elenchi di funzionalità e strutture tariffarie complesse. Per aiutarti a rimanere concentrato mentre affronti il tuo specifico processo di selezione del software, ecco una lista di fattori da tenere a mente:
| Fattore | Cosa considerare |
|---|---|
| FattoreScalabilità | Cosa considerareLo strumento è in grado di gestire la crescita prevista delle chiamate API e degli utenti? Cerca un'architettura scalabile per evitare colli di bottiglia con l'espansione delle tue esigenze. |
| FattoreIntegrazioni | Cosa considerareSi integra facilmente con i sistemi esistenti, come le pipeline CI/CD o gli strumenti di avviso? Verifica la compatibilità con il tuo insieme di tecnologie. |
| FattorePersonalizzazione | Cosa considerarePuoi adattare lo strumento a esigenze o flussi di lavoro di monitoraggio specifici? Cerca pannelli di controllo e avvisi personalizzabili in base ai tuoi requisiti. |
| FattoreFacilità d'uso | Cosa considerareL'interfaccia è intuitiva per il tuo team? Una curva di apprendimento ripida può rallentare l'adozione, quindi dai priorità a un design intuitivo e a una navigazione chiara. |
| FattoreImplementazione e avvio | Cosa considerareIn quanto tempo il tuo team può iniziare a utilizzare lo strumento? Considera la disponibilità di risorse formative e supporto durante la fase di configurazione. |
| FattoreCosto | Cosa considerareIl prezzo rientra nel tuo budget? Confronta i piani di abbonamento e verifica la presenza di costi nascosti. Cerca prove gratuite per effettuare un test prima di impegnarti. |
| FattoreMisure di sicurezza | Cosa considerareOffre la crittografia e la conformità agli standard di sicurezza? Assicurati che lo strumento protegga i dati sensibili e soddisfi i tuoi requisiti di sicurezza. |
Cosa sono gli strumenti di monitoraggio delle API?
Gli strumenti di monitoraggio delle API sono software che tengono traccia delle prestazioni, della disponibilità e dello stato delle API. Vengono utilizzati da sviluppatori, ingegneri DevOps e team QA per assicurarsi che le API funzionino come previsto e individuare i problemi prima che se ne accorgano gli utenti.
Gli avvisi, i registri e le funzionalità di report aiutano a individuare i periodi di inattività, a eseguire il debug delle risposte lente e a confermare il rispetto degli SLA. Questi strumenti semplificano la manutenzione di servizi affidabili e aiutano a evitare problemi che danneggiano l'esperienza degli utenti.
Funzionalità
Quando selezioni gli strumenti di monitoraggio delle API, presta attenzione alle seguenti funzionalità chiave:
- Monitoraggio del tempo di attività: Tiene traccia della disponibilità delle API per garantire che siano accessibili e funzionino correttamente.
- Monitoraggio del tempo di risposta: Misura la velocità con cui le API rispondono alle richieste, aiutando a identificare i colli di bottiglia delle prestazioni.
- Notifiche degli avvisi: Invia avvisi quando vengono rilevati problemi, consentendo di intervenire immediatamente in caso di potenziali difficoltà.
- Pannelli di controllo personalizzabili: Fornisce visualizzazioni personalizzate delle metriche sulle prestazioni delle API, adatte a specifiche esigenze di monitoraggio.
- Capacità di integrazione: Si connette facilmente ai sistemi esistenti, come le pipeline CI/CD e gli strumenti di avviso, per un'integrazione fluida del flusso di lavoro.
- Conformità alla sicurezza: Garantisce la protezione dei dati aderendo agli standard di sicurezza del settore e ai protocolli di crittografia.
- Analisi in tempo reale: Offre informazioni immediate sulle prestazioni delle API, consentendo una gestione proattiva delle prestazioni.
- Test multiregione: Simula richieste API da località diverse per valutare le prestazioni e la latenza a livello globale.
- Informazioni basate sull'IA: Utilizza l'intelligenza artificiale per rilevare anomalie e prevedere potenziali problemi prima che si verifichino.
Vantaggi
L'implementazione di strumenti di monitoraggio delle API offre diversi vantaggi al tuo team e alla tua azienda. Ecco alcuni dei risultati che puoi aspettarti:
- Maggiore affidabilità: Monitorando il tempo di attività, questi strumenti aiutano a garantire che le API siano costantemente disponibili e affidabili.
- Risoluzione più rapida dei problemi: Le notifiche degli avvisi consentono al team di affrontare rapidamente i problemi, riducendo al minimo i periodi di inattività e le interruzioni del servizio.
- Prestazioni migliorate: Il monitoraggio del tempo di risposta aiuta a identificare e correggere i colli di bottiglia delle prestazioni, garantendo operazioni efficienti delle API.
- Processo decisionale consapevole: Le analisi in tempo reale forniscono informazioni sull'utilizzo e sulle prestazioni delle API, supportando decisioni basate sui dati.
- Maggiore sicurezza: La conformità agli standard di sicurezza aiuta a proteggere i dati sensibili e a mantenere la fiducia degli utenti.
- Valutazione della portata globale: I test multiregione consentono al team di valutare le prestazioni delle API in diverse aree geografiche.
- Gestione proattiva: Le informazioni basate sull'IA aiutano a prevedere e affrontare i potenziali problemi prima che abbiano un impatto sugli utenti.
Costi e prezzi
La selezione degli strumenti di monitoraggio delle API richiede la comprensione dei vari modelli di prezzo e dei piani disponibili. I costi variano in base alle funzionalità, alle dimensioni del team, ai componenti aggiuntivi e ad altri fattori. La tabella seguente riassume i piani più comuni, i relativi prezzi medi e le funzionalità generalmente incluse nelle soluzioni di strumenti di monitoraggio delle API:
Tabella comparativa dei piani per gli strumenti di monitoraggio delle API
| Tipo di piano | Prezzo medio | Funzionalità comuni |
|---|---|---|
| Tipo di pianoPiano gratuito | Prezzo medio$0 | Funzionalità comuniMonitoraggio di base del tempo di attività, notifiche degli avvisi limitate e analisi di base. |
| Tipo di pianoPiano personale | Prezzo medio$5-$25/utente/mese | Funzionalità comuniMonitoraggio del tempo di attività e del tempo di risposta, pannelli di controllo personalizzabili e avvisi via e-mail. |
| Tipo di pianoPiano aziendale | Prezzo medio$50-$150/utente/mese | Funzionalità comuniTest multiregione, capacità di integrazione, analisi in tempo reale e avvisi avanzati. |
| Tipo di pianoPiano aziendale | Prezzo medio$200+/utente/mese | Funzionalità comuniInformazioni basate sull'IA, conformità avanzata alla sicurezza, assistenza dedicata e completa personalizzazione. |
Domande frequenti sugli strumenti di monitoraggio delle API
Ecco alcune risposte alle domande più comuni sugli strumenti di monitoraggio delle API:
Come si monitora l'utilizzo delle API?
L’utilizzo delle API viene generalmente monitorato tenendo traccia della disponibilità, misurata come percentuale del tempo durante il quale l’API è disponibile. La maggior parte degli utenti punta a una disponibilità del 99.9% o superiore. Gli strumenti di monitoraggio possono avvisarti di eventuali periodi di inattività, aiutandoti a risolvere rapidamente i problemi.
Quali aspetti di un'API dovrebbero essere monitorati?
Gli aspetti principali da monitorare includono la gestione del controllo degli accessi, i servizi di sicurezza e la sicurezza del firewall di rete. Gli strumenti dovrebbero inoltre monitorare l’orchestrazione SSL/TLS e offrire funzionalità di gestione unificata per garantire una supervisione completa delle prestazioni e della sicurezza dell’API.
Con quale frequenza dovresti testare le tue API?
Eseguire test regolari è fondamentale e molti strumenti offrono controlli minuto per minuto. I test frequenti aiutano a individuare tempestivamente i problemi e a mantenere l’affidabilità. Valuta la possibilità di impostare il sistema di monitoraggio in modo che testi ogni API almeno ogni pochi minuti, così da garantire prestazioni costanti.
Perché le notifiche degli avvisi sono importanti nel monitoraggio delle API?
Le notifiche degli avvisi sono essenziali perché informano immediatamente della presenza di eventuali problemi, consentendo una risoluzione rapida. Senza avvisi tempestivi, i problemi possono passare inosservati, causando periodi di inattività prolungati e potenzialmente compromettendo l’esperienza degli utenti.
Perché i prezzi variano così tanto tra strumenti diversi?
Il costo di uno strumento di monitoraggio delle API è influenzato da diversi fattori: la profondità e l’ampiezza delle funzionalità, il pubblico di riferimento, la scalabilità, la reputazione del marchio e il livello di assistenza clienti offerto.
Prossimi passi:
Se stai cercando strumenti di monitoraggio delle API, mettiti in contatto gratuitamente con un consulente di SoftwareSelect per ricevere consigli.
Compilerai un modulo e farai una breve conversazione durante la quale verranno esaminate nel dettaglio le tue esigenze. Dopodiché riceverai una rosa ristretta di software da valutare. Ti accompagneranno inoltre durante l'intero processo di acquisto, comprese le negoziazioni sul prezzo.