Guide des 10 meilleurs outils de surveillance de 2026

10 Meilleure sélection d'outils de surveillance
Here's my pick of the 10 best software from the 19 tools reviewed.


Un logiciel de surveillance d’infrastructure vous aide à suivre la santé et la performance de vos systèmes, que vous gériez des serveurs, des réseaux, des applications ou des machines virtuelles.
Beaucoup d’équipes recherchent ces outils lorsqu’elles font face à des angles morts dans leur infrastructure, peinent à détecter les incidents à temps ou perdent du temps à jongler entre différents tableaux de bord. Choisir un mauvais outil ou compter sur un logiciel obsolète peut mener à des alertes manquées, des interruptions de service ou une visibilité limitée.
J’ai aidé des équipes à choisir et mettre en place des plateformes de surveillance adaptées à leurs besoins, qui simplifient réellement la résolution des problèmes au lieu de la compliquer. Ce guide repose sur cette expérience terrain afin que vous puissiez trouver un logiciel qui vous apporte de la clarté sans les tracas.
Why Trust Our Software Reviews
We’ve been testing and reviewing software since 2023. As tech leaders ourselves, we know how critical and difficult it is to make the right decision when selecting software.
We invest in deep research to help our audience make better software purchasing decisions. We’ve tested more than 2,000 tools for different tech use cases and written over 1,000 comprehensive software reviews. Learn how we stay transparent & our software review methodology.
Résumé des meilleurs outils de surveillance
Ce tableau comparatif résume les informations tarifaires de mes meilleures sélections d’outils de surveillance afin de vous aider à trouver celui qui correspond à votre budget et à vos besoins professionnels.
| Tool | Best For | Trial Info | Price | ||
|---|---|---|---|---|---|
| 1 | Idéal pour la détection proactive des problèmes | Essai gratuit de 30 jours + démo gratuite disponible | À partir de $149/technicien/mois (facturé annuellement) | Website | |
| 2 | Meilleure solution open source | Forfait gratuit disponible | Tarification sur demande | Website | |
| 3 | Idéal pour une visibilité réseau en temps réel | Essai gratuit de 14 jours disponible | Tarification sur demande | Website | |
| 4 | Idéal pour la supervision sur toutes les plateformes | Essai gratuit disponible | À partir de 2 149/an | Website | |
| 5 | Idéal pour le suivi des performances en temps réel | Essai gratuit de 30 jours + démo gratuite + offre gratuite disponible | À partir de 199 $/an | Website | |
| 6 | Idéal pour le suivi des erreurs applicatives en temps réel | Plan gratuit + démo gratuite disponible | À partir de $26/mois (facturé annuellement) | Website | |
| 7 | Idéal pour la surveillance en temps réel de la santé des bases de données | Essai gratuit de 30 jours disponible | À partir de $7/nœud/mois | Website | |
| 8 | Idéal pour une surveillance proactive | Démo gratuite + essai gratuit de 30 jours disponible | À partir de 9 $/mois (facturé annuellement) | Website | |
| 9 | Idéal pour la gestion centralisée des journaux | Essai gratuit de 30 jours + démo gratuite | Tarification sur demande | Website | |
| 10 | Idéal pour la détection d’anomalies assistée par IA | Démo gratuite + essai gratuit de 15 jours disponible | Tarification sur demande | Website |

-

Site24x7
Visit WebsiteThis is an aggregated rating for this tool including ratings from Crozdesk users and ratings from other sites.4.7 -
GitHub Actions
Visit WebsiteThis is an aggregated rating for this tool including ratings from Crozdesk users and ratings from other sites.4.8 -
Docker
Visit WebsiteThis is an aggregated rating for this tool including ratings from Crozdesk users and ratings from other sites.4.6


Avis sur les meilleurs outils de surveillance
Voici mes résumés détaillés des meilleurs outils de surveillance qui figurent dans ma sélection. Mes avis proposent une analyse approfondie des fonctionnalités clés, des avantages et inconvénients, des intégrations disponibles et des cas d’usage idéaux pour chaque outil afin de vous aider à choisir celui qui vous convient le mieux.
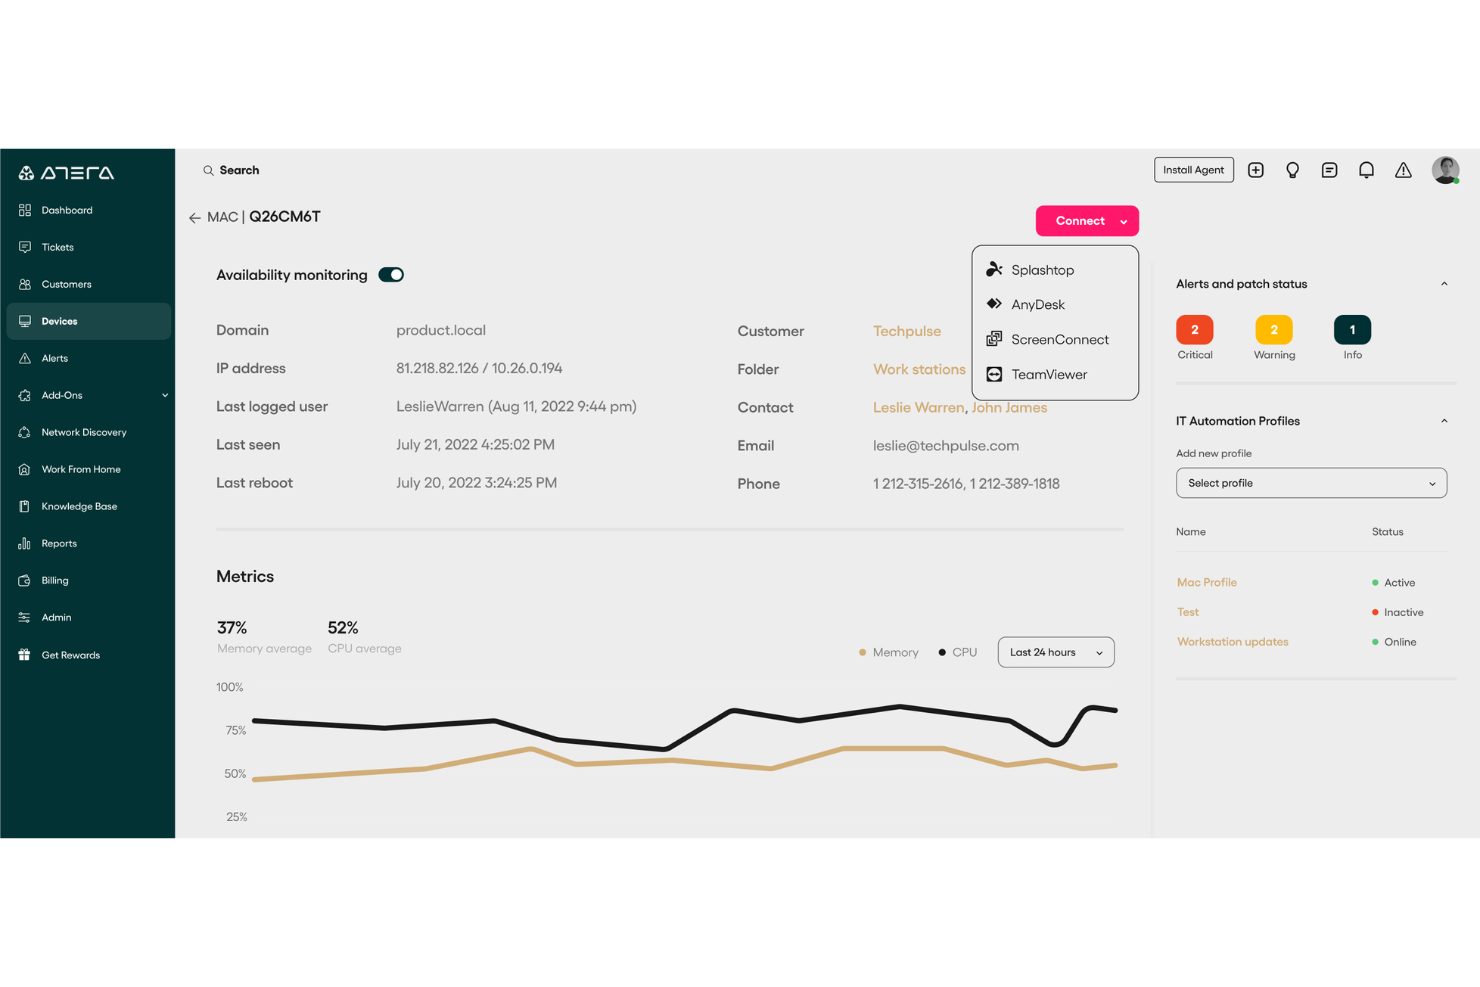
Atera est une plateforme de gestion informatique tout-en-un conçue pour les fournisseurs de services gérés (MSP) et les professionnels de l'informatique. Elle vous aide à surveiller, gérer et automatiser les opérations informatiques à travers les appareils et les réseaux, avec un fort accent sur la réduction du travail manuel grâce à l'IA et l'automatisation. Atera offre une visibilité en temps réel sur la performance du système, la santé du réseau et l'état des appareils, ce qui facilite la gestion proactive des environnements informatiques.
Pourquoi j'ai choisi Atera : J'ai sélectionné Atera car elle se distingue par ses capacités de surveillance et de gestion à distance (RMM), qui vous permettent de garder un œil sur les performances, la disponibilité et la santé du réseau en temps réel. Cela facilite la détection et la résolution des problèmes avant qu'ils ne s'aggravent. J'apprécie aussi les outils d'automatisation basés sur l'IA d'Atera, qui accélèrent la résolution des tickets et libèrent du temps pour un travail informatique plus stratégique. Ses tableaux de bord personnalisables renforcent encore l'utilisabilité en vous donnant un contrôle total sur la façon dont vous visualisez votre environnement.
Fonctionnalités et intégrations remarquables :
Les fonctionnalités d'Atera incluent la gestion des correctifs pour garantir que les systèmes restent sécurisés et à jour, ainsi que des outils de découverte réseau qui donnent une vue claire de tous les appareils connectés. Les rapports avancés vous aident à analyser les tendances de performance, tandis que son système de ticketing intégré centralise le suivi des incidents. Parmi les intégrations figurent Salesforce, HubSpot, Microsoft Teams, Zendesk, Jira Software Cloud, Acronis Cyber Protect Cloud, Asana, ServiceNow et les notifications WhatsApp, entre autres.
Pros and Cons
Pros:
- Tarification abordable facturée par technicien plutôt que par appareil
- Combine surveillance à distance, ticketing et automatisation
- Gestion informatique efficace et résolution des problèmes
Cons:
- Peut nécessiter un léger temps d'apprentissage
- Manque de certaines options avancées de personnalisation
New Product Updates from Atera

Atera Enhances IT Autopilot With Automation and File Support
Atera’s IT Autopilot gets three major boosts: you can now attach common files for deeper analysis, automate IT tasks with clear workflows, and choose how the system follows up when users go silent. These updates help streamline IT operations and improve resolution efficiency. For more information, visit Atera’s official site.
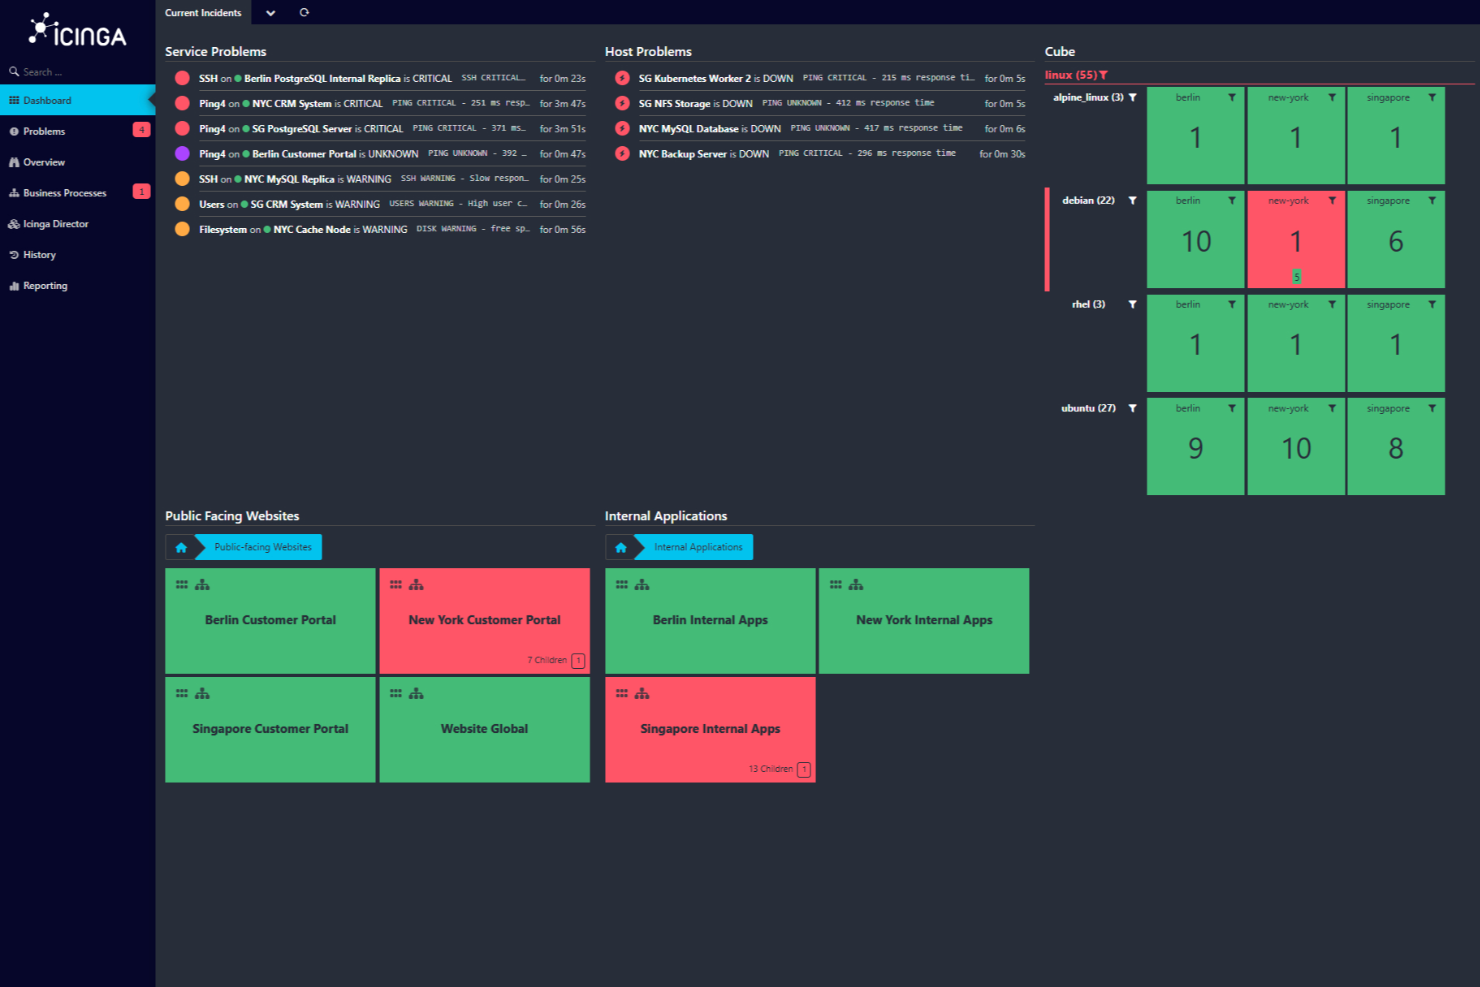
Icinga est une solution de surveillance open source qui vous aide à surveiller l’ensemble de votre infrastructure informatique. Elle est conçue pour gérer des environnements complexes, offrant un large éventail de fonctionnalités pour garantir le bon fonctionnement de vos systèmes.
Pourquoi j'ai choisi Icinga : Elle permet de surveiller tout, des serveurs et réseaux jusqu’aux applications et bases de données. Vous pouvez importer automatiquement des données de sources comme Active Directory ou de plateformes cloud telles qu’AWS et Azure, maintenant ainsi votre configuration de surveillance synchronisée avec votre infrastructure. J'apprécie également que Icinga propose l’automatisation de la surveillance, ce qui facilite la gestion des tâches répétitives. De plus, grâce à ses métriques et journaux, vous pouvez collecter et analyser des données pour obtenir des informations précieuses sur vos systèmes.
Fonctionnalités et intégrations remarquables :
D’autres fonctionnalités clés incluent la supervision distribuée et basée sur des agents pour assurer une couverture sur plusieurs sites, ainsi que des alertes et notifications personnalisables afin de résoudre rapidement les problèmes. Ses outils d’analyse permettent aussi de créer des tableaux de bord et rapports personnalisés, facilitant l’identification des goulets d’étranglement et le suivi de l’historique de disponibilité.
Parmi les intégrations d'Icinga figurent Grafana, AWS, Azure, Puppet, Ansible, Chef, Terraform, Jira, PagerDuty, ServiceNow, BigPanda et Stackstorm.
Pros and Cons
Pros:
- Hautement personnalisable pour divers besoins d’infrastructures IT
- Évolutif pour les petits comme les grands environnements
- Gratuit sans frais d'installation
Cons:
- La configuration et l'installation nécessitent un temps d'apprentissage
- Des problèmes de performance occasionnels signalés lors de charges élevées
New Product Updates from Icinga
Icinga Web Adds PHP 8.5 Support and New Packages
Icinga Web introduces PHP 8.5 support, icinga/zf1 and icinga-php-legacy packages, and module updates. These changes improve compatibility, modernize the codebase, and enhance overall system stability. For more information, visit Icinga's official site.
 .
.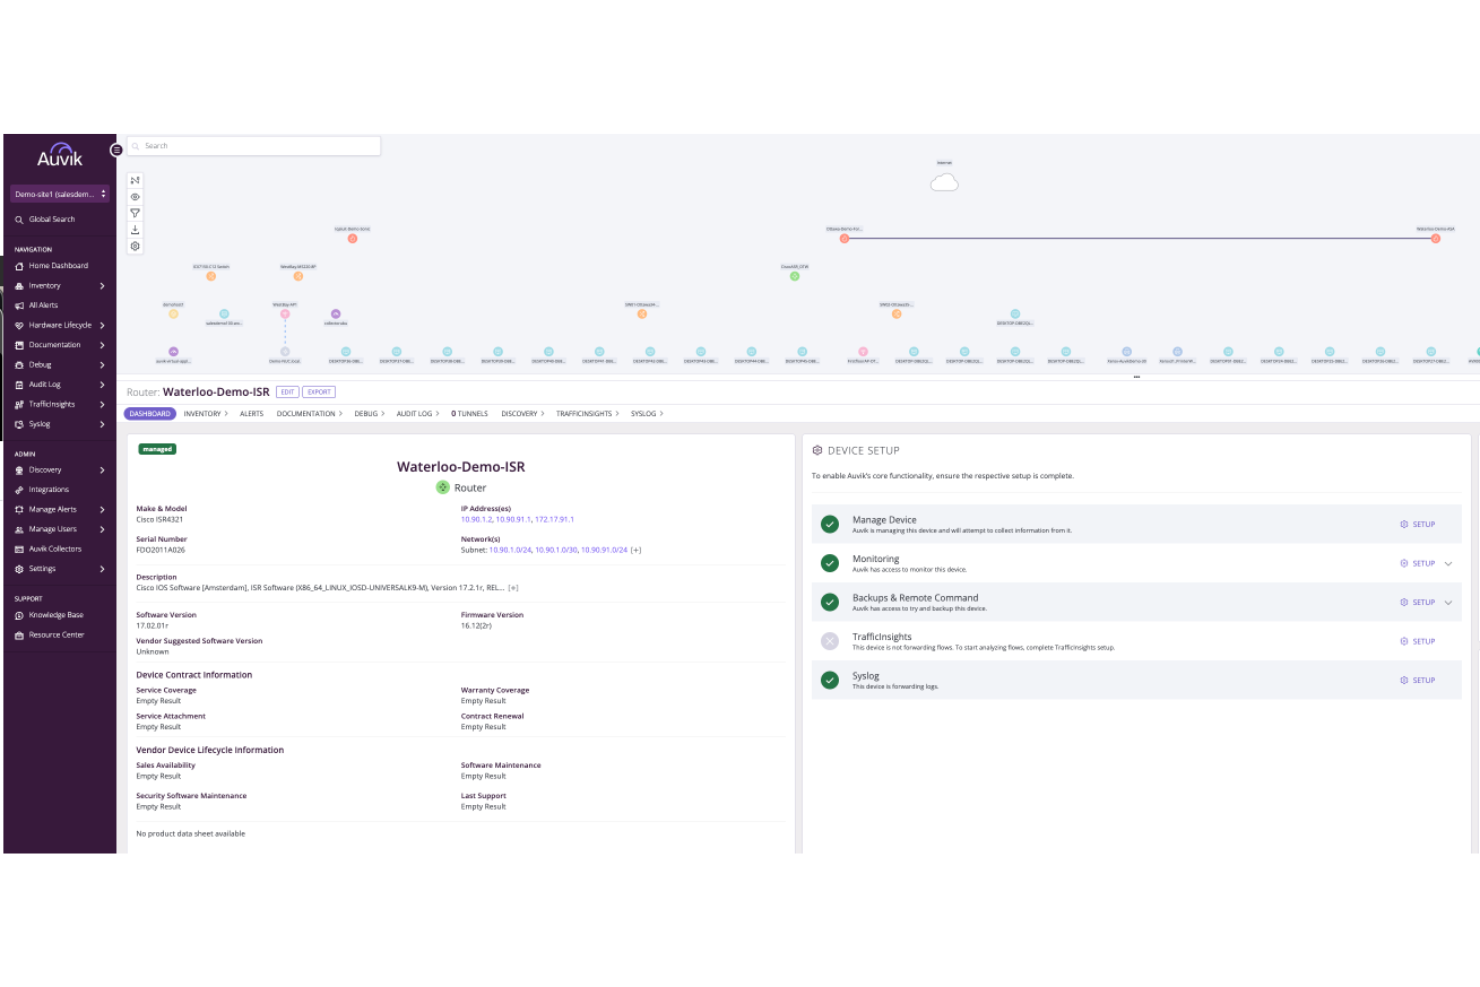
Auvik est une plateforme de gestion réseau qui améliore la visibilité et la performance de votre réseau. Elle propose des outils de surveillance pour vous aider à garder le contrôle de votre réseau et à assurer son bon fonctionnement.
Pourquoi j'ai choisi Auvik : L'une des raisons pour lesquelles j'ai sélectionné Auvik comme l'un des meilleurs outils de surveillance est sa capacité à fournir une surveillance des appareils en temps réel. Cette fonctionnalité vous permet de garder un œil constant sur la santé de votre réseau, garantissant ainsi que vous puissiez détecter et résoudre les problèmes dès qu'ils surviennent. Une autre fonctionnalité attrayante est la cartographie automatisée du réseau, qui représente visuellement la structure et les connexions de votre réseau. Cela vous aide à comprendre comment les différents appareils interagissent, rendant leur gestion et le dépannage plus faciles. Une autre caractéristique qui ressort est le suivi des indicateurs de performance. Grâce à cela, vous pouvez recueillir des données précieuses sur les performances de votre réseau et prendre des décisions éclairées pour optimiser son fonctionnement. La plateforme propose également des alertes personnalisables qui vous avertissent de tout problème potentiel, afin que vous puissiez y remédier avant qu'il ne s'aggrave.
Fonctionnalités et intégrations remarquables :
Les fonctionnalités incluent les sauvegardes de configurations qui garantissent de ne jamais perdre des paramètres critiques, la gestion à distance des appareils qui vous permet de contrôler les dispositifs où que vous soyez, ainsi que des paramètres d'alerte globale offrant une surveillance cohérente sur l'ensemble de votre réseau. Ces fonctionnalités fonctionnent de concert pour offrir une solution complète de gestion et de surveillance de votre réseau.
Les intégrations incluent Cisco, Datto, Microsoft Intune, Slack, ServiceNow, ConnectWise, Dell, Fortinet, Palo Alto Networks, Cisco Meraki, Okta et Jamf.
Pros and Cons
Pros:
- Visibilité en temps réel sur la performance du réseau
- Cartographie et découverte du réseau automatisées
- Sauvegardes des configurations et automatisation de la comparaison
Cons:
- Détails tarifaires non disponibles publiquement
- Capacités de gestion hors ligne limitées
New Product Updates from Auvik
Auvik Adds HA Pair Monitoring, Improves Ping Alerts, & Expands SaaS Integrations
Auvik introduces HA Pair Monitoring for Fortinet firewalls, improved Service Status alerts for Internal Ping Checks, and new SaaS integrations with ServiceNow, GitLab, ClickUp, and Notion. These updates improve network monitoring visibility and provide better insights into SaaS license usage. For more information, visit Auvik’s official site.
 .
.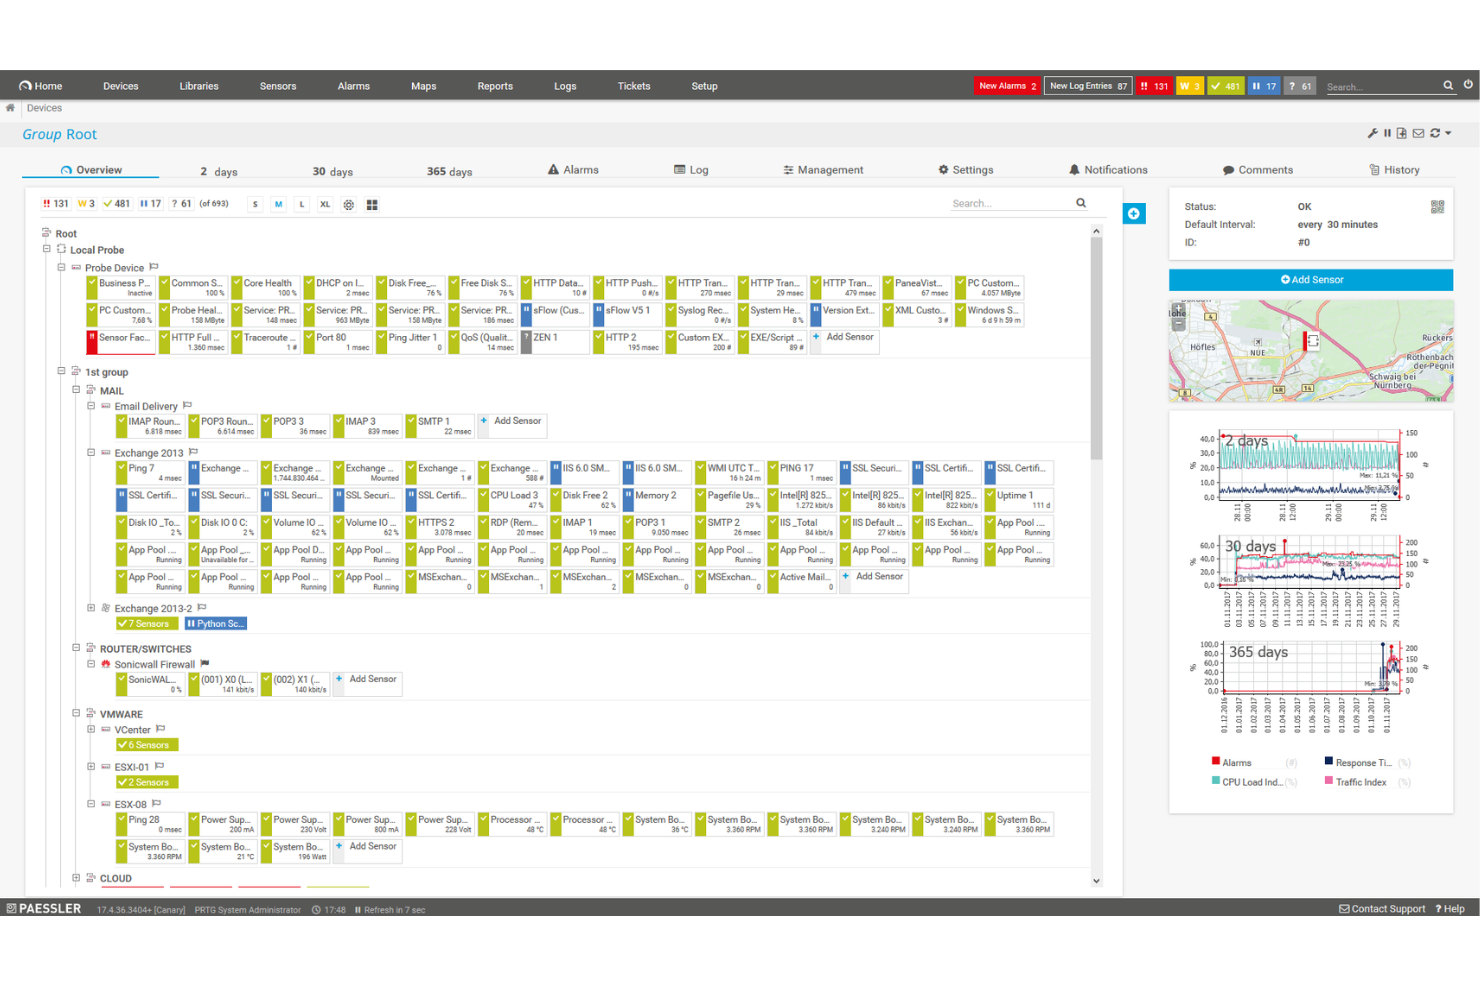
PRTG Network Monitor est un outil complet qui vous aide à surveiller l'ensemble de votre infrastructure informatique. Il surveille les systèmes, les appareils, le trafic et les applications, fournissant des informations en temps réel sur la santé de votre réseau. Avec PRTG, vous pouvez identifier et résoudre les problèmes avant qu'ils ne deviennent critiques.
Pourquoi j'ai choisi PRTG : J'ai choisi PRTG pour sa capacité à unifier la supervision de différentes technologies via des protocoles intégrés comme SNMP, WMI, SSH et bien d'autres. Cela signifie que vous pouvez superviser un large éventail de plateformes, de dispositifs et de systèmes au sein de votre réseau, en vous assurant que tous les composants fonctionnent correctement. De plus, PRTG propose des rapports personnalisables, vous permettant de générer des rapports détaillés adaptés à vos besoins. Un autre aspect précieux de PRTG est son système d'alerte en temps réel. Vous recevez des notifications immédiates sur les problèmes potentiels, ce qui vous permet de réagir rapidement et de limiter les interruptions.
Fonctionnalités et intégrations remarquables :
Parmi les autres fonctionnalités clés figurent des statistiques détaillées sur les applications fonctionnant dans votre réseau, ce qui vous aide à gérer efficacement les ressources. De plus, sa fonction de surveillance distribuée vous permet de superviser plusieurs réseaux situés à différents endroits, le tout depuis une interface unique. Il dispose également de cartes et de tableaux de bord en temps réel qui visualisent l'état de votre réseau, facilitant l'identification et la résolution des problèmes. Les intégrations incluent AWS, Cisco, Dell Technologies, HPE, VMware, ServiceNow, Check Point, Sonicwall, NetApp, Fujitsu, Lansweeper et Martello.
Pros and Cons
Pros:
- Offre une vue d'ensemble complète de l'infrastructure réseau
- Tableaux de bord personnalisables et alertes en temps réel
- Prend en charge plusieurs technologies de supervision
Cons:
- La configuration initiale peut être chronophage
- La tarification basée sur les capteurs peut devenir coûteuse pour les grands réseaux
New Product Updates from PRTG
PRTG Introduces New Monitoring Sensors In Beta
This week, PRTG introduces three BETA sensors that broaden your monitoring scope for Proxmox VE clusters and SIMATIC S7-300/400 PLCs, giving you deeper operational insights. For more information, visit PRTG’s official site.
 .
.Idéal pour le suivi des performances en temps réel
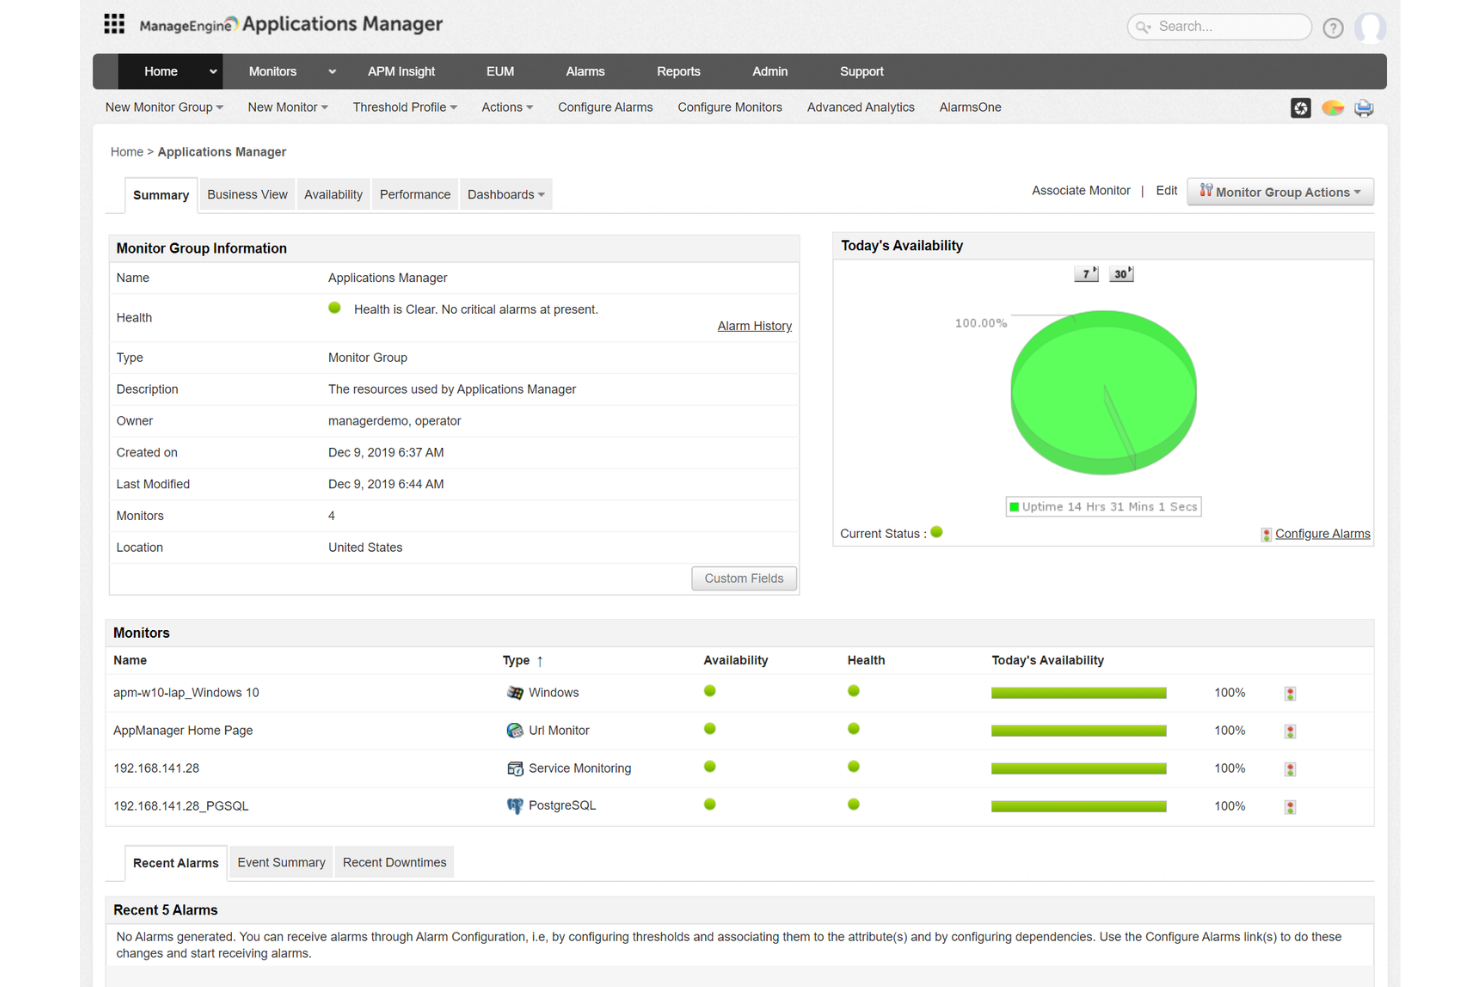
ManageEngine Applications Manager est un outil qui vous aide à surveiller les performances de vos applications et de votre infrastructure informatique. Il garde un œil sur divers composants tels que les serveurs, les bases de données et les services cloud afin de s'assurer qu'ils fonctionnent correctement. Ce faisant, il aide votre équipe à identifier et à résoudre les problèmes avant qu'ils n'affectent vos utilisateurs.
Pourquoi j'ai choisi ManageEngine Applications Manager : L'une des raisons pour lesquelles j'ai choisi ManageEngine Applications Manager est sa capacité à surveiller un large éventail de technologies. Il prend en charge plus de 150 technologies, y compris les serveurs d'applications, les bases de données et les plateformes cloud. Cela signifie que vous pouvez superviser l'ensemble de votre environnement informatique depuis une console unique, ce qui facilite la détection et la résolution des problèmes potentiels. Une autre fonctionnalité utile est sa surveillance des performances en temps réel. L'outil fournit des informations sur des indicateurs tels que l'utilisation du CPU et de la mémoire, les temps de réponse et les détails des transactions. Avec ces informations, votre équipe peut rapidement identifier les goulets d'étranglement de performance et prendre des mesures correctives pour maintenir des performances applicatives optimales.
Fonctionnalités remarquables et intégrations :
Les fonctionnalités incluent la surveillance synthétique des transactions, qui vous permet de simuler des interactions utilisateur avec vos applications afin d'identifier les problèmes potentiels avant qu'ils n'affectent les vrais utilisateurs. De plus, la supervision des utilisateurs réels fournit des informations sur les expériences réelles de vos utilisateurs, vous aidant à comprendre comment vos applications fonctionnent dans des conditions réelles.
Les intégrations incluent ManageEngine ServiceDesk Plus, ServiceNow, Site24x7, AlarmsOne, Slack, Prometheus, AWS, Google Cloud, Microsoft Azure, Oracle et MySQL.
Pros and Cons
Pros:
- Simplifie la gestion des applications et de leurs relations
- Le système d'alertes en temps réel aide les équipes à réagir rapidement aux incidents
- Surveille un large éventail d'applications et de composants d'infrastructure
Cons:
- L'outil peut être gourmand en ressources
- La configuration de l'outil pour répondre à des besoins spécifiques peut être complexe
New Product Updates from ManageEngine Applications Manager
ManageEngine Applications Manager Adds Veeam Monitoring
ManageEngine Applications Manager adds Veeam Enterprise Manager monitoring. This update enables tracking of backup infrastructure, job performance, and storage usage. For more information, visit ManageEngine’s official site.
 .
.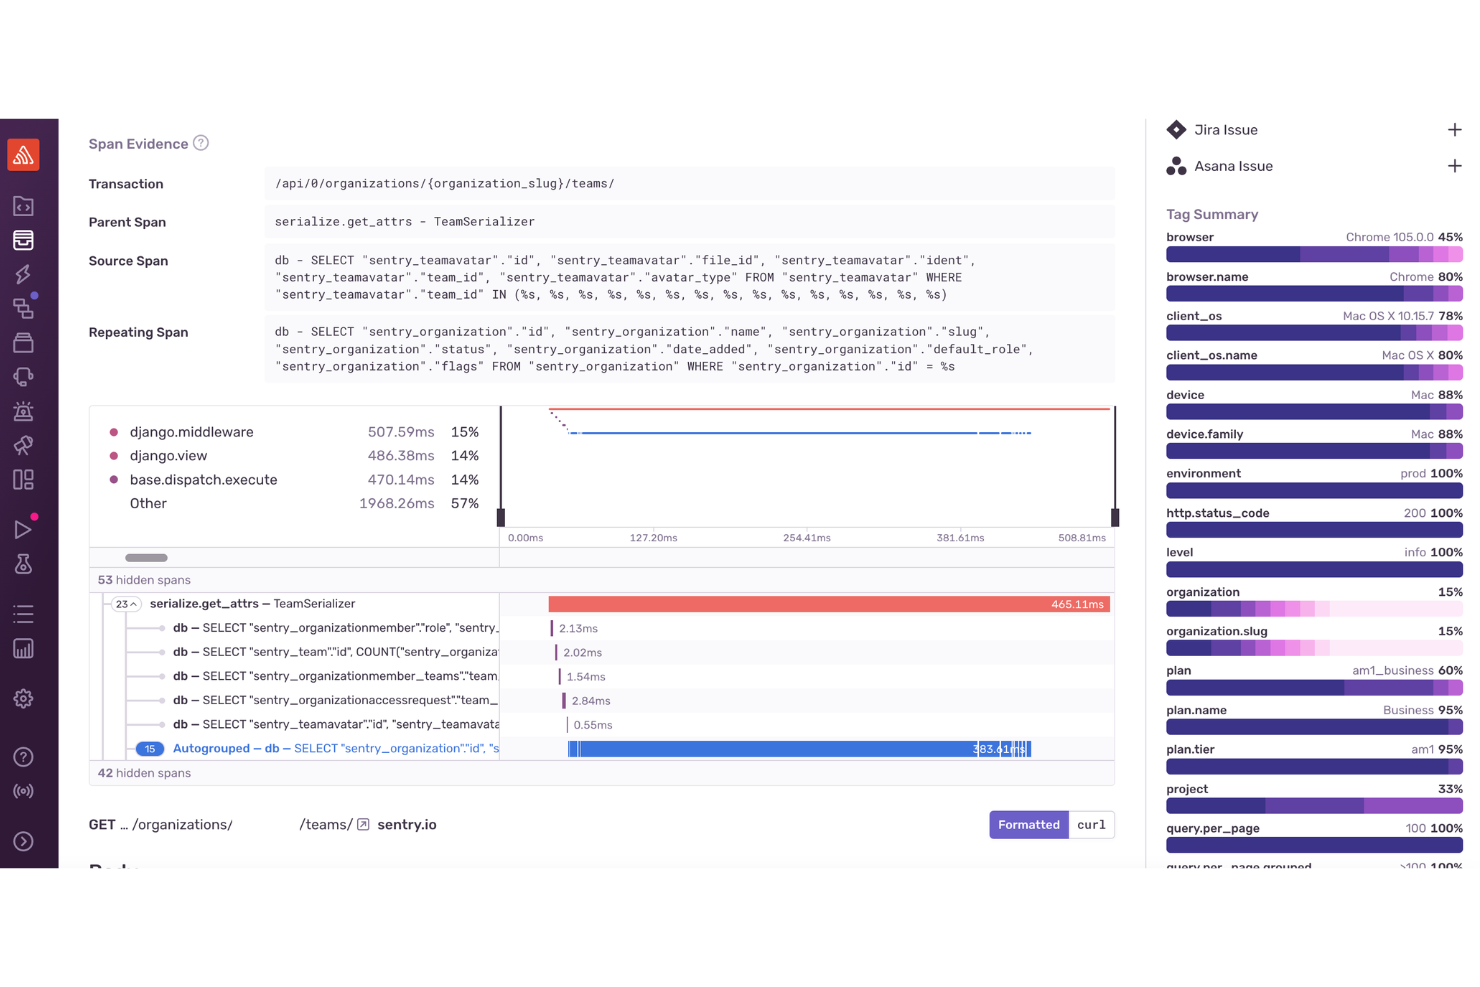
Pour les développeurs et les entreprises à la recherche d'un outil de surveillance offrant des informations immédiates sur les performances et les erreurs d'une application, Sentry s'impose comme une solution complète. Il est particulièrement attrayant pour les secteurs du développement web et mobile, du commerce électronique et de l'entreprise, car il répond au besoin crucial de suivi des erreurs en temps réel et d'optimisation des performances lors des pics d'affluence.
Pourquoi j'ai choisi Sentry
J'ai choisi Sentry pour ses solides capacités de surveillance des erreurs et de suivi des performances. L'outil excelle dans la détection des erreurs en temps réel, alertant immédiatement votre équipe afin de permettre une résolution rapide. La fonction de traçage distribué de Sentry offre une vue détaillée des performances des transactions, vous aidant à identifier et à optimiser les opérations lentes. De plus, la fonctionnalité de relecture des sessions fournit un contexte visuel pour le débogage, ce qui facilite la compréhension des interactions des utilisateurs et la résolution efficace des problèmes.
Fonctionnalités clés de Sentry
En plus du suivi en temps réel des erreurs d'application, Sentry propose :
- Rapports de crash des applications mobiles : Fournit des informations sur les plantages d'applications mobiles avec des traces de pile détaillées.
- Analytique pour les jeux : Propose une surveillance des performances adaptée aux applications de jeux, mettant en évidence la latence et les problèmes de fréquence d'image.
- Revue de code IA : Utilise l'IA pour suggérer des corrections potentielles aux problèmes détectés, rationalisant le processus de débogage.
- Sécurité et conformité : Garantit la protection des données utilisateurs grâce à des mesures de sécurité conformes aux normes du secteur, ce qui le rend adapté aux applications traitant des informations sensibles.
Intégrations Sentry
Sentry propose une large gamme d'intégrations natives pour renforcer l'efficacité du flux de travail, notamment GitHub, Bitbucket, GitLab, Slack, Microsoft Teams, Jira, Asana, Trello, Datadog et PagerDuty.
Pros and Cons
Pros:
- Le traçage distribué fournit une visibilité sur les performances au niveau des transactions
- Le groupement avancé des erreurs aide à prioriser les problèmes pour une résolution rapide
- Propose une détection des erreurs en temps réel sur les applications web, mobiles et backend
Cons:
- Toutes les intégrations ne sont pas natives, certaines reposant sur des APIs tierces
- Alertes et informations sur les applications limitées dans les offres d'entrée de gamme
New Product Updates from Sentry

Sentry Enhances Alerting Across Uptime and Metrics
Sentry introduces expanded alert configuration for Uptime Monitors and adds alerting support to its Metrics open beta. These updates improve issue detection by enabling more flexible monitoring conditions and proactive alerts. For more information, visit Sentry’s official site.
 .
.Idéal pour la surveillance en temps réel de la santé des bases de données
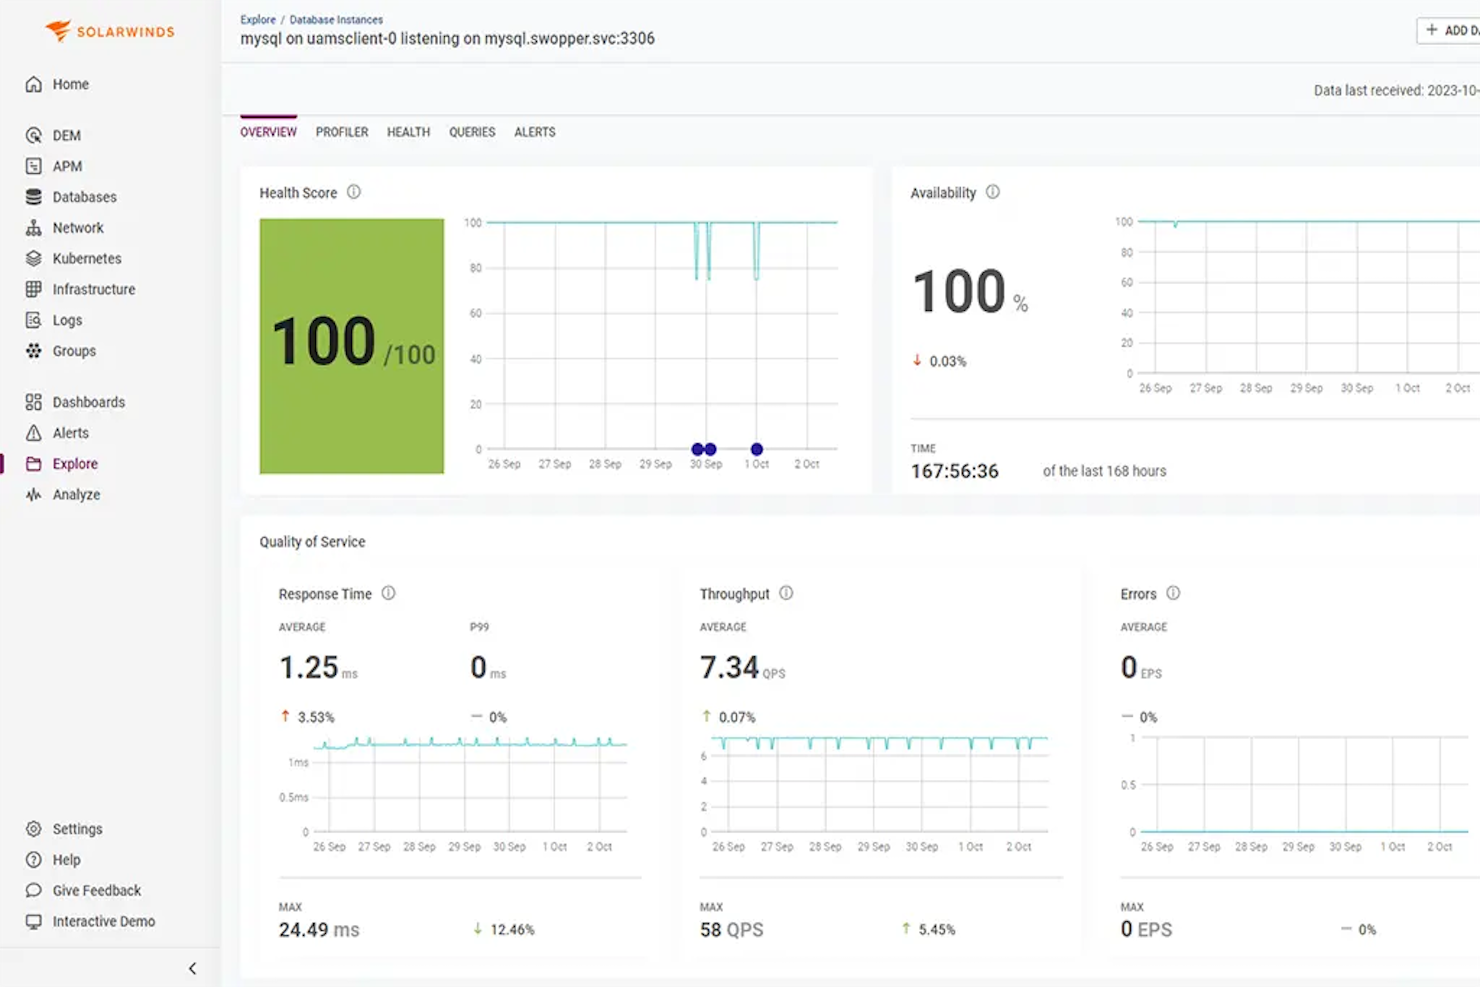
SolarWinds Observability SaaS est une plateforme de surveillance destinée aux équipes DevOps, aux opérations informatiques et aux opérations cloud. Elle fournit des informations en temps réel sur les performances des applications et de l’infrastructure. En intégrant des fonctionnalités telles que la surveillance des plantages d’applications et le contrôle de l’état des bases de données, elle permet aux équipes de gérer de façon proactive leurs environnements informatiques et d’optimiser les performances, améliorant ainsi l’expérience utilisateur finale.
Pourquoi j’ai choisi SolarWinds Observability SaaS
J’ai choisi SolarWinds Observability SaaS pour sa capacité à surveiller en temps réel la santé des bases de données, particulièrement utile pour les équipes ayant besoin d’une vigilance constante sur les performances de leur base de données. Cette fonctionnalité vous permet d’obtenir des informations sur les opérations des bases de données et de garantir leur bon fonctionnement. De plus, son système de surveillance des plantages d’applications est précieux pour détecter les problèmes potentiels avant qu’ils n’impactent la production, offrant ainsi une sécurité supplémentaire à vos applications. Ces caractéristiques en font un choix solide pour les organisations qui accordent la priorité à la disponibilité et à la fiabilité de leur infrastructure informatique.
Fonctionnalités clés de SolarWinds Observability SaaS
J’ai également relevé plusieurs autres fonctionnalités qui apportent une valeur ajoutée à vos efforts de surveillance :
- Surveillance des déploiements de code : Évalue l’impact des nouvelles versions de code, aidant votre équipe à identifier rapidement d’éventuels problèmes.
- Surveillance de Kubernetes : Optimise les processus de déploiement afin de garantir le bon fonctionnement de vos applications conteneurisées.
- Surveillance des ressources : Suit l’utilisation du CPU et de la mémoire pour les indicateurs clés de l’infrastructure, fournissant des informations sur l’utilisation des ressources.
- Surveillance des bases de données NoSQL : Améliore les capacités de dépannage en fournissant des informations précises sur les performances des bases de données NoSQL.
Intégrations de SolarWinds Observability SaaS
Les intégrations incluent Kubernetes, Amazon EC2, DynamoDB, Azure Virtual Machines, Google Compute Engine, Google Cloud Storage, Slack, Microsoft Teams, et plus encore.
Pros and Cons
Pros:
- La surveillance des déploiements de code aide à détecter rapidement les problèmes lors des mises en production
- La surveillance des bases NoSQL améliore la précision du dépannage
- La détection automatique des anomalies réduit l'effort de surveillance manuelle
Cons:
- La configuration du tableau de bord peut être complexe pour certains utilisateurs
- Les fonctionnalités de reporting peuvent ne pas répondre à toutes les attentes des utilisateurs
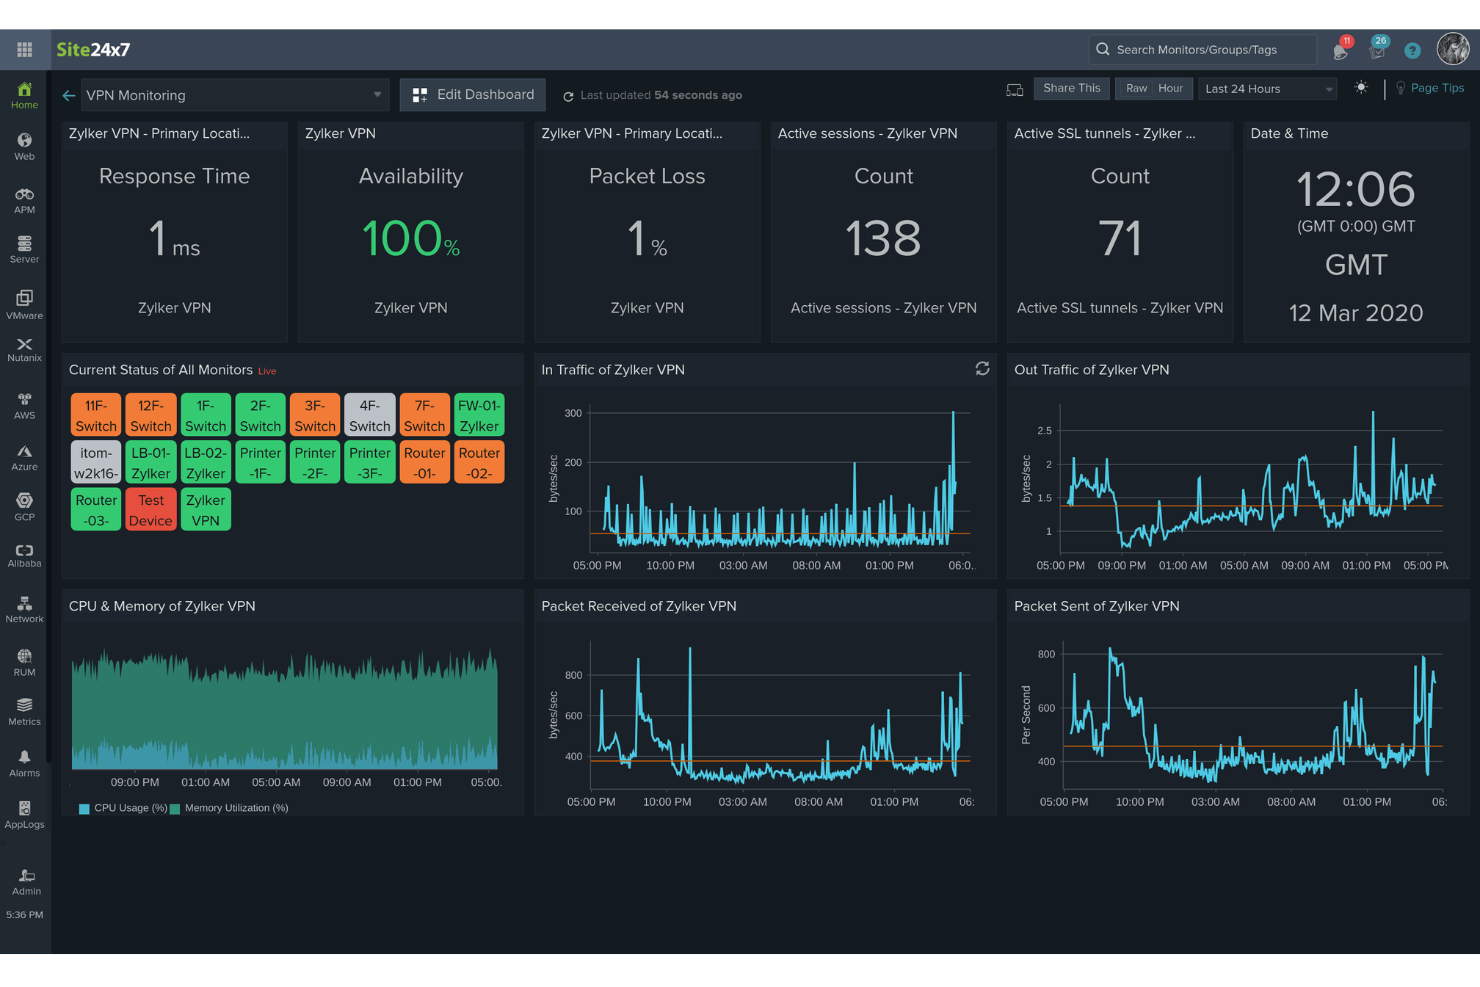
Site24x7 est une solution de surveillance basée sur le cloud, conçue pour les équipes DevOps et les opérations informatiques. Elle offre des capacités complètes de surveillance des sites web, serveurs, applications et dispositifs réseau, fournissant des informations en temps réel sur les performances et la disponibilité.
Pourquoi j’ai choisi Site24x7 : J’apprécie Site24x7 pour sa surveillance robuste des performances applicatives (APM). Il prend en charge divers langages de programmation, notamment Java, .NET, Ruby, PHP et Node.js. Un autre aspect notable est la surveillance réelle des utilisateurs (RUM) de Site24x7. Cette fonctionnalité vous permet d’analyser l’expérience réelle des utilisateurs qui interagissent avec votre site web ou vos applications web. En segmentant les données de performance par navigateur, plateforme, zone géographique, etc., vous pouvez obtenir des informations précieuses sur la façon dont différents facteurs influencent l’expérience utilisateur et prendre des décisions éclairées pour l’améliorer. Dans l’ensemble, ces fonctionnalités vous aident à surveiller de manière proactive divers composants de votre infrastructure informatique.
Fonctionnalités et intégrations remarquables :
D’autres fonctionnalités incluent la surveillance synthétique des transactions web, qui permet d’enregistrer et de simuler des interactions multi-étapes d’utilisateurs réels dans un navigateur, afin d’optimiser les parcours utilisateurs critiques comme les formulaires de connexion et les paniers d’achat. De plus, la gestion des journaux de Site24x7 consolide et indexe les journaux provenant de diverses sources, facilitant le dépannage et la résolution efficace des problèmes.
Les intégrations comprennent ServiceNow, PagerDuty, Opsgenie, Jira, ManageEngine AlarmsOne, ManageEngine ServiceDesk Plus, Slack, Microsoft Teams, Zoho Cliq, Amazon EventBridge, Zapier et Webhooks.
Pros and Cons
Pros:
- Options de personnalisation flexibles pour les tableaux de bord et rapports
- Alertes en temps réel fiables permettant une résolution rapide des problèmes
- Capacités complètes de surveillance de divers composants de l’infrastructure informatique
Cons:
- Options d’intégration limitées avec certains outils tiers
- La complexité de la configuration peut être difficile pour les nouveaux utilisateurs
New Product Updates from Site24x7

Site24x7 Enhances Network Monitoring With Device and Visibility Updates
Site24x7 introduces proactive hardware health monitoring, expanded device support, centralized network controls, and enhanced SD-WAN visualization to improve network monitoring and management. For more information, visit Site24x7’s official site.
 .
.
ManageEngine EventLog Analyzer est une solution complète de gestion des journaux et de conformité informatique conçue pour aider les organisations à surveiller, gérer et analyser les journaux d'événements provenant de diverses sources.
Pourquoi j'ai choisi ManageEngine EventLog Analyzer : Il offre des capacités d'audit de sécurité en temps réel et de gestion des incidents. Cela permet aux organisations d'identifier et de hiérarchiser efficacement les menaces de sécurité à haut risque. Le logiciel prend en charge une gestion extensive des journaux, y compris la collecte, le traitement et l'analyse des journaux provenant de différentes sources telles que Windows, Unix et les appareils réseau. Cette capacité centralisée de gestion des journaux améliore la visibilité sur les événements de sécurité du réseau, ce qui simplifie la détection et la réponse aux menaces.
Fonctionnalités et intégrations remarquables :
Les fonctionnalités clés incluent la surveillance en temps réel, la collecte des journaux, l'audit des applications, les rapports et analyses, la gestion de la conformité ainsi qu'une analyse avancée des menaces permettant d'améliorer la sécurité en identifiant les menaces provenant d'URL, d'adresses IP et de domaines malveillants, et en priorisant les actions de réponse à partir des scores de réputation. Les intégrations comprennent ADAudit Plus, Firewall Analyzer, SharePoint Manager Plus, M365 Security Plus, Cloud Security Plus, DataSecurity Plus, FileAnalysis, OpManager Plus et NetFlow Analyzer.
Pros and Cons
Pros:
- Options de reporting détaillées et personnalisables
- Fonctions d'audit approfondies
- Capacités étendues de gestion des journaux
Cons:
- Certains utilisateurs trouvent la configuration initiale complexe
- D'éventuels ralentissements lors du traitement de gros volumes de journaux
New Product Updates from ManageEngine OpManager
ManageEngine OpManager Vendor Templates and NCM XML Import
ManageEngine OpManager introduces enhanced vendor template integration and device template import for the NCM module using XML files. This update helps teams improve device classification and speed up configuration workflows. For more information, visit ManageEngine OpManager’s official site.
 .
.
Dynatrace est un outil de surveillance des performances conçu pour superviser l'ensemble d'un écosystème numérique. Ses capacités avancées en intelligence artificielle lui permettent non seulement de surveiller, mais aussi d'identifier de manière proactive les anomalies au sein d'un système.
Cette orientation particulière vers les analyses pilotées par l'IA le rend particulièrement adapté à ceux qui recherchent une solution de détection des anomalies.
Pourquoi j'ai choisi Dynatrace : Au cours de ma recherche de solutions de surveillance, Dynatrace a retenu mon attention grâce à son insistance marquée sur l'intelligence artificielle. La décision de le sélectionner a été influencée par la façon dont ses capacités uniques en IA permettent une détection rapide des anomalies, anticipant souvent les problèmes avant qu'ils ne s'aggravent.
Après avoir comparé divers outils, mon jugement m'a conduit à penser que Dynatrace est sans égal pour la détection d'anomalies assistée par l'IA.
Fonctionnalités clés & intégrations :
Dynatrace propose une détection des anomalies en temps réel et une identification des causes principales, des atouts essentiels pour la résolution rapide des problèmes. Sa surveillance de bout en bout, des applications à l'infrastructure, assure une couverture complète.
En ce qui concerne les intégrations, Dynatrace se connecte aux plateformes cloud, aux outils CI/CD et aux grandes plateformes d'opérations IT, ce qui le rend adaptable à divers environnements informatiques.
Pros and Cons
Pros:
- Fonctionnalités avancées en IA pour la détection d'anomalies en temps réel.
- Surveillance complète de bout en bout.
- Environnement d'intégration riche avec les plateformes cloud et opérations IT populaires.
Cons:
- Peut s'avérer complexe pour les utilisateurs non familiers avec les outils pilotés par IA.
- La vaste gamme de fonctionnalités peut nécessiter des sessions de formation dédiées.
- L'absence de transparence sur la tarification peut constituer un frein pour certains utilisateurs potentiels.
Autres outils de surveillance
Voici une liste d’outils de surveillance supplémentaires que j’ai présélectionnés, mais qui n’ont pas intégré le top 10. Ils valent toutefois le détour.
- Datadog
Idéal pour la surveillance à l'échelle du cloud
- New Relic
Idéal pour les analyses de performance applicative
- Nagios XI
Idéal pour la surveillance complète de l'infrastructure
- Prometheus
Idéal pour l'alerte en temps réel et la collecte de données multidimensionnelles
- Micro Focus SiteScope
Idéal pour la surveillance applicative sans agent
- Sensu
Idéal pour des flux de surveillance flexibles
- Observium
Idéal pour les contrôles de santé du matériel réseau et serveur
- Checkmk
Idéal pour des solutions de surveillance unifiées
- Dotcom Monitor
Idéal pour créer des scripts multi-étapes


Critères de sélection des outils de surveillance
Pour sélectionner les meilleurs outils de surveillance à inclure dans cette liste, j’ai pris en compte les besoins courants des acheteurs et des problématiques telles que la montée en charge ou la facilité d’intégration. J’ai également utilisé le cadre suivant pour garantir une évaluation structurée et équitable :
Fonctionnalités principales (25 % de la note globale)
Pour figurer dans cette liste, chaque outil devait couvrir ces cas d’usage courants :
- Surveillance des performances du système
- Alertes en temps réel
- Suivi de la disponibilité des applications
- Analyse du trafic réseau
- Génération de rapports détaillés
Fonctionnalités distinctives supplémentaires (25 % de la note globale)
Pour mieux départager les outils, j’ai également recherché des fonctionnalités uniques, telles que :
- Analyses prédictives
- Tableaux de bord personnalisables
- Analyses pilotées par l’IA
- Prise en charge multi-cloud
- Analyse automatisée de la cause racine
Facilité d’utilisation (10 % de la note globale)
Pour évaluer la prise en main de chaque système, j’ai examiné les points suivants :
- Interface intuitive
- Navigation aisée
- Courbe d’apprentissage réduite
- Options de personnalisation
- Visualisations claires
Intégration et démarrage (10 % de la note globale)
Pour juger l’expérience d’intégration de chaque plateforme, j’ai pris en compte les critères suivants :
- Disponibilité de vidéos de formation
- Visites guidées interactives du produit
- Modèles d'intégration
- Accès aux webinaires
- Chatbots d’assistance
Support client (10 % du score total)
Pour évaluer les services de support client de chaque fournisseur de logiciel, j'ai pris en compte les éléments suivants :
- Disponibilité d'un support 24h/24 et 7j/7
- Options de chat en direct
- Base de connaissances complète
- Temps de réponse rapides
- Support multilingue
Rapport qualité/prix (10 % du score total)
Pour estimer le rapport qualité/prix de chaque plateforme, j'ai pris en compte les critères suivants :
- Tarification compétitive
- Formules d’abonnement flexibles
- Caractéristiques incluses vs coût
- Réductions pour la facturation annuelle
- Période d’essai gratuite ou disponibilité d’une démo
Avis clients (10 % du score total)
Pour évaluer la satisfaction globale des clients, j'ai pris en compte les éléments suivants lors de la lecture des avis :
- Retours positifs réguliers
- Mention de la fiabilité des performances
- Facilité d’utilisation saluée
- Rapport qualité/prix mis en avant
- Service client réactif noté
Comment choisir des outils de supervision
Il est facile de se perdre dans des listes de fonctionnalités interminables et des structures tarifaires complexes. Pour vous aider à garder le cap lors de votre processus de sélection de logiciel, voici une liste de contrôle des facteurs à garder à l’esprit :
| Facteur | À considérer |
|---|---|
| Scalabilité | L’outil peut-il évoluer avec votre entreprise ? Pensez à vos besoins futurs et à la capacité de l’outil à gérer davantage de données et d’utilisateurs sans problèmes de performance. Privilégiez des options d’évolution flexibles. |
| Intégrations | S’intègre-t-il à vos systèmes existants ? Assurez-vous qu’il soit compatible avec votre pile technologique actuelle (CRM, ERP, services cloud, etc.), afin d’éviter les adaptations coûteuses. |
| Personnalisation | Pouvez-vous adapter l’outil à vos workflows ? Vérifiez si vous pouvez modifier tableaux de bord, alertes et rapports selon les besoins et processus de votre équipe. |
| Facilité d’utilisation | L’outil est-il intuitif pour votre équipe ? Évaluez la courbe d’apprentissage et la capacité de vos membres à l’adopter rapidement sans formation poussée. Optez pour une interface conviviale. |
| Mise en œuvre et intégration | La mise en place est-elle fluide ? Considérez le temps et les ressources nécessaires pour installer l’outil. Préférez les fournisseurs offrant un accompagnement et des ressources complètes pour l’onboarding. |
| Coût | Le tarif est-il adapté à votre budget ? Comparez le coût de l’outil à ses atouts et bénéfices. Attention aux frais cachés ou aux surcoûts par utilisateur ou pour certaines fonctionnalités. |
| Sécurité | Vos données sont-elles protégées ? Analysez les mesures de sécurité en place, comme le chiffrement ou le respect des normes réglementaires, pour garantir la sécurité de vos données. |
| Disponibilité du support | L’aide est-elle accessible au bon moment ? Vérifiez les types de support proposés (aide 24/7, chat en direct, gestionnaire de compte dédié) afin d’être assisté quand vous en avez besoin. |
Qu’est-ce qu’un outil de supervision ?
Les outils de supervision sont des logiciels qui surveillent la performance et l’état de santé des systèmes, réseaux et applications. Ils sont utilisés par les équipes informatiques, ingénieurs DevOps et administrateurs système pour détecter rapidement les problèmes, réduire les temps d’arrêt et assurer le bon fonctionnement des systèmes. Le suivi des métriques, les alertes et les tableaux de bord aident à identifier les tendances, résoudre les incidents et garder l’équipe informée. Les logiciels de supervision du matériel offrent aux équipes la visibilité nécessaire pour gérer sereinement leurs systèmes.
Fonctionnalités
Lorsque vous choisissez des outils de supervision, portez une attention particulière aux caractéristiques clés suivantes :
- Alertes en temps réel : Informez instantanément les utilisateurs lorsque des problèmes surviennent, permettant ainsi une réponse et une résolution rapides.
- Tableaux de bord personnalisables : Adaptez l'interface pour afficher les métriques et les données les plus pertinentes pour votre équipe.
- Capacités d'intégration : Connectez-vous sans effort aux systèmes et logiciels existants afin d'obtenir une vue unifiée des opérations.
- Analyse automatisée des causes racines : Identifiez la cause sous-jacente des problèmes sans intervention manuelle, ce qui permet d'économiser du temps et des efforts.
- Analytique prédictive : Anticipez les problèmes potentiels avant qu'ils ne surviennent, contribuant ainsi à maintenir la stabilité du système.
- Scalabilité : Adaptez-vous à l’augmentation des données et des besoins des utilisateurs, garantissant l'efficacité de l'outil à mesure que votre entreprise se développe.
- Mesures de sécurité : Protégez les données sensibles grâce au chiffrement et au respect des normes du secteur.
- Rapports complets : Générez des rapports détaillés pour analyser les tendances de performance et soutenir la prise de décision.
- Prise en charge multi-cloud : Surveillez les applications à travers différents environnements cloud, offrant une vue complète des opérations.
- Interface conviviale : Assurez une facilité d'utilisation, permettant à l'équipe de naviguer et d'utiliser l'outil efficacement.
Bénéfices
Mettre en place des outils de supervision en complément des outils de cartographie réseau offre de nombreux bénéfices pour votre équipe et votre entreprise. Voici quelques avantages auxquels vous pouvez vous attendre :
- Amélioration des performances du système : Les alertes en temps réel et l'analyse automatisée des causes racines vous permettent de résoudre rapidement les problèmes et d’assurer le bon fonctionnement des systèmes.
- Meilleure prise de décision : Des rapports complets et des analyses prédictives offrent des perspectives pour appuyer vos décisions stratégiques.
- Efficacité accrue : Les tableaux de bord personnalisables et les capacités d'intégration font gagner du temps en rendant les données pertinentes facilement accessibles.
- Scalabilité : À mesure que votre entreprise grandit, la scalabilité garantit que l'outil s’adapte à la hausse de la demande sans perte de performance.
- Sécurité des données : Les mesures de sécurité protègent vos informations sensibles et assurent la conformité aux normes du secteur.
- Réduction des coûts : La détection et la résolution précoces des problèmes diminuent les temps d’arrêt et les coûts associés, ce qui profite à vos résultats financiers.
- Visibilité multiplateforme : Le support multi-cloud permet une vue unifiée des opérations à travers différents environnements, offrant ainsi une transparence totale.
Coûts & Tarification
Le choix d'un outil de supervision implique de comprendre les différents modèles et formules tarifaires disponibles. Les coûts varient en fonction des fonctionnalités, de la taille de l’équipe, des modules complémentaires, et plus encore. Le tableau ci-dessous résume les formules les plus courantes, leurs prix moyens et les fonctionnalités typiques incluses dans les solutions de supervision :
Tableau comparatif des formules pour les outils de supervision
| Type de formule | Prix moyen | Fonctionnalités courantes |
|---|---|---|
| Forfait gratuit | $0/user/month | Surveillance basique, alertes limitées, et assistance communautaire. |
| Forfait personnel | $5-$25/user/month | Alertes en temps réel, tableaux de bord personnalisables et analyses de base. |
| Forfait entreprise | $30-$75/user/month | Rapports avancés, capacités d’intégration et accès multi-utilisateurs. |
| Forfait premium | $100-$300/user/month | Analytique prédictive, support 24/7 et options de personnalisation complète. |
FAQ sur les outils de surveillance
Voici des réponses aux questions courantes sur les outils de surveillance :
Comment fonctionne un outil de surveillance ?
Un outil de surveillance suit divers indicateurs comme la charge CPU, la bande passante réseau et l’espace disque. Il aide à détecter les problèmes et à alerter les administrateurs avant que les utilisateurs ne soient affectés. Ces outils garantissent le bon fonctionnement des systèmes en fournissant des informations sur les performances et les éventuels problèmes.
Quelles compétences sont nécessaires pour utiliser des outils de surveillance ?
Vous aurez besoin de compétences statistiques et analytiques pour collecter et analyser les données. Ces compétences vous aident à comprendre l’impact de la surveillance et à prendre des décisions éclairées. Être à l’aise avec l’interprétation des données et avoir une compréhension de base des systèmes informatiques seront également des atouts.
Comment choisir des outils de surveillance d’applications ?
Tenez compte du type et de la complexité de votre application. Évaluez la facilité de déploiement et de gestion de l’outil, et assurez-vous qu’il répond à vos exigences de sécurité. Recherchez des fonctionnalités qui correspondent à vos besoins spécifiques et qui offrent le plus de valeur à votre équipe.
Comment fonctionnent les outils de surveillance réseau ?
Les outils de surveillance réseau suivent des aspects comme le trafic, l’utilisation de la bande passante et la disponibilité. Ils détectent les appareils sur le réseau et fournissent des mises à jour de statut. Cela aide à gérer les performances du réseau et à identifier les problèmes potentiels avant qu’ils n’aient un impact sur les utilisateurs.
Quels sont les défis courants liés à l’utilisation des outils de surveillance ?
Les utilisateurs rencontrent souvent des défis tels que la surcharge de données, ce qui peut rendre difficile l’identification des problèmes clés. L’intégration avec les systèmes existants peut également être complexe. Il est important de configurer correctement les alertes pour éviter les notifications inutiles qui peuvent conduire à une fatigue face aux alertes.
Comment les outils de surveillance peuvent-ils améliorer les performances du système ?
Les outils de surveillance fournissent des informations en temps réel sur les performances du système, vous permettant d’identifier et de résoudre rapidement les problèmes. En analysant les tendances et en vous alertant des problèmes potentiels, ces outils aident à maintenir la santé optimale du système et à réduire les temps d’arrêt.
Et ensuite :
Si vous êtes en train de rechercher des outils de surveillance, contactez gratuitement un conseiller SoftwareSelect pour des recommandations personnalisées.
Vous remplissez un formulaire et avez une brève conversation pour détailler vos besoins. Ensuite, vous recevrez une liste restreinte de logiciels à examiner. Ils vous accompagneront même tout au long du processus d’achat, y compris lors des négociations tarifaires.