14 Mejores Alternativas a Netdata para 2026

Lista corta de alternativas a Netdata


Una alternativa sólida a Netdata ofrece monitoreo de aplicaciones en tiempo real, integraciones flexibles y visualizaciones claras para entornos complejos. Si buscas alternativas a Netdata, probablemente necesites un sistema de monitoreo escalable que soporte prácticas modernas de observabilidad y pueda crecer junto con tu infraestructura. Muchos equipos buscan plataformas todo en uno que ofrezcan monitoreo integral, funciones avanzadas e integraciones fluidas, siendo a la vez rentables y fáciles de desplegar. Esta lista compara las principales opciones para 2026, ayudándote a evaluar características, facilidad de uso y capacidades de monitoreo para que puedas elegir una solución amigable que se adapte a la infraestructura y necesidades operativas de tu equipo.
¿Qué es Netdata?
Netdata es una herramienta de monitoreo de aplicaciones de código abierto que proporciona información en tiempo real sobre el rendimiento del sistema, uso de recursos y estado de las aplicaciones. Recoge métricas de servidores, contenedores y aplicaciones, mostrándolas mediante paneles interactivos. Netdata es utilizado por especialistas de TI y equipos de operaciones para detectar anomalías, solucionar problemas y mantener una infraestructura confiable. Su diseño ligero e integraciones extensas lo hacen adecuado para monitorear entornos modernos y heredados.
Resumen de las mejores alternativas a Netdata
u003cspan style=u0022font-weight: 400;u0022u003eEsta tabla comparativa resume los detalles de precios de mis principales selecciones de alternativas a Netdata para ayudarte a encontrar la mejor para tu presupuesto y necesidades empresariales.u003c/spanu003e
| Tool | Best For | Trial Info | Price | ||
|---|---|---|---|---|---|
| 1 | Ideal para visibilidad de infraestructura multi-nube | Prueba gratuita de 14 días | Desde $15/host/mes (facturado anualmente) | Website | |
| 2 | Ideal para correlación entre frontend y backend | Prueba gratuita de 14 días + demo gratis disponible | Desde $49/host/mes (facturación anual) | Website | |
| 3 | Mejor para la monitorización de transacciones a escala empresarial | Prueba gratuita disponible | Precios bajo solicitud | Website | |
| 4 | Mejor para rastreo distribuido en tiempo real | Plan gratuito disponible | From $49/user/month | Website | |
| 5 | Ideal para la recopilación de métricas de series temporales | Uso gratuito | Sin costo de licencia | Website | |
| 6 | La mejor con integraciones de datos de código abierto | Prueba gratuita de 7 días + plan gratis disponible | Desde $99/mes | Website | |
| 7 | Ideal para visualizaciones avanzadas de paneles | Plan gratuito disponible | Desde $19/mes | Website | |
| 8 | Ideal para monitoreo nativo de recursos AWS | Prueba gratuita disponible | Precio bajo consulta | Website | |
| 9 | Ideal para soporte a entornos híbridos | Prueba gratuita de 30 días disponible | Desde $7/nodo/mes | Website | |
| 10 | Ideal para el seguimiento de errores en despliegues de código | Plan gratuito + prueba gratuita + demo gratuita disponible | Desde $26/mes (facturado anualmente) | Website |
Por qué confiar en nuestras reseñas de software
Llevamos probando y revisando software desde 2023. Como líderes tecnológicos, sabemos lo crítico y difícil que es tomar la decisión correcta al seleccionar software.
Invertimos en una investigación profunda para ayudar a nuestra audiencia a tomar mejores decisiones de compra de software. Hemos probado más de 2,000 herramientas para diferentes casos de uso tecnológicos y escrito más de 1,000 reseñas de software exhaustivas. Descubre cómo mantenemos la transparencia y nuestra metodología de revisión de software.
-

TestDevLab
Visit Website -
Site24x7
Visit WebsiteThis is an aggregated rating for this tool including ratings from Crozdesk users and ratings from other sites.4.7 -
GitHub Actions
Visit WebsiteThis is an aggregated rating for this tool including ratings from Crozdesk users and ratings from other sites.4.8


Reseñas de alternativas a Netdata
u003cspan style=u0022font-weight: 400;u0022u003eA continuación tienes mis resúmenes detallados de las mejores alternativas a Netdata que han pasado mi filtro. Mis reseñas ofrecen un análisis profundo de las características, integraciones y mejores casos de uso de cada plataforma de monitoreo para ayudarte a encontrar la que mejor se ajuste a tus necesidades.u003c/spanu003e
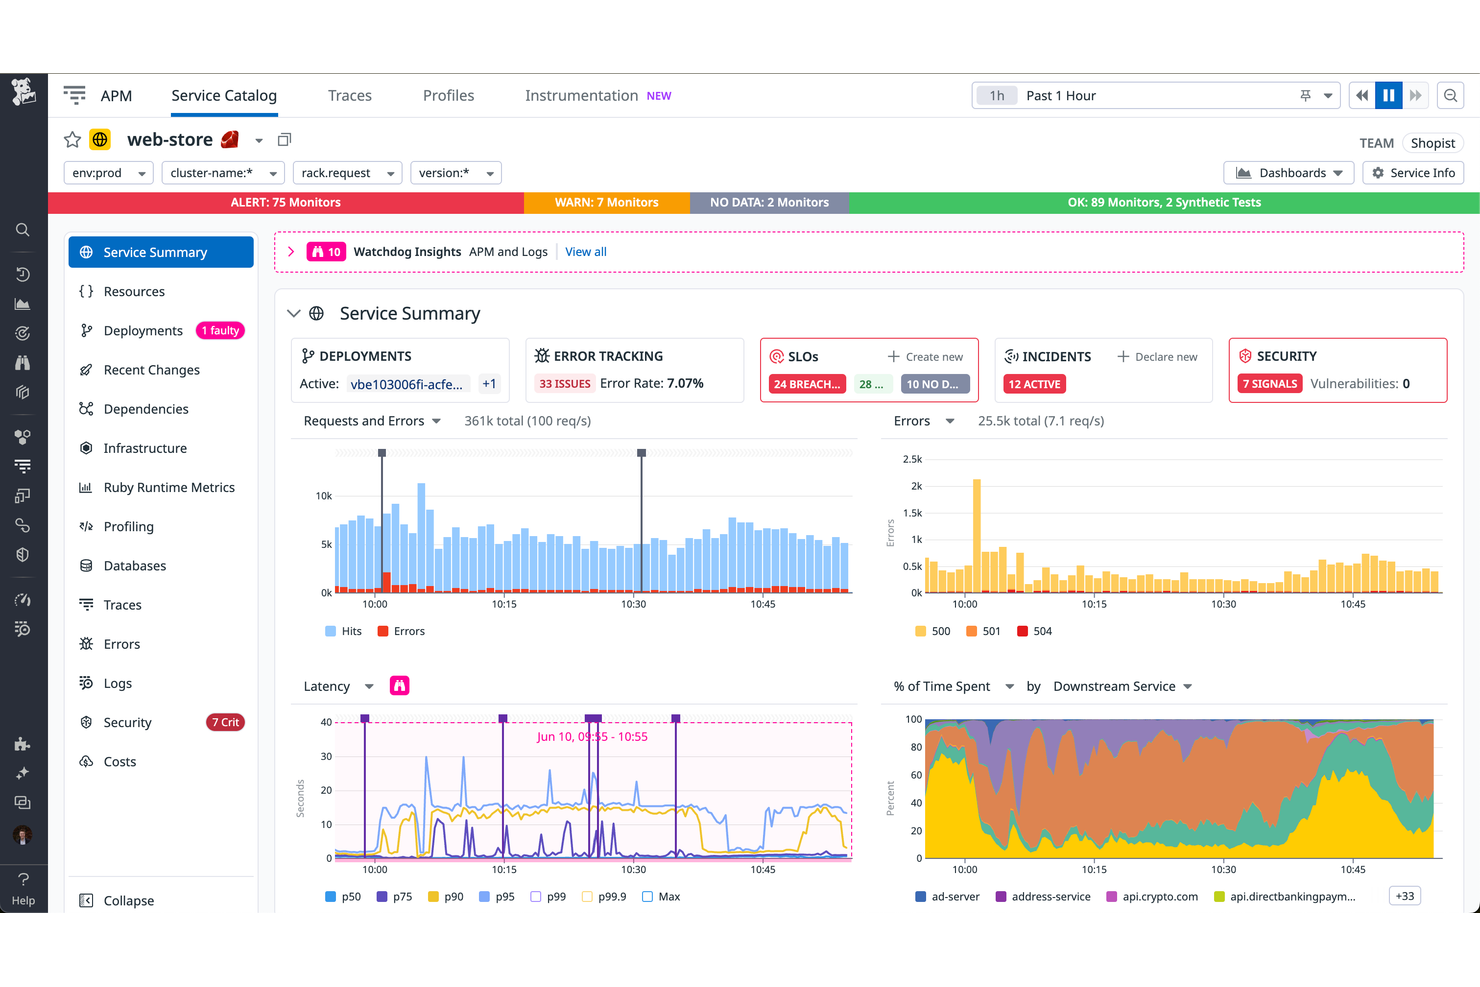
Datadog ayuda a los equipos a supervisar el rendimiento de la infraestructura y las métricas del sistema en tiempo real a través de infraestructuras, aplicaciones, servicios y dispositivos de red como routers. Datadog se destaca frente a Netdata por sus integraciones profundas, paneles personalizables y soporte para monitoreo de cambios de configuración (gestión de configuración) y sistemas distribuidos a gran escala.
Por Qué Datadog Es una Buena Alternativa a Netdata
Cuando busco una herramienta de monitoreo que sobresalga en visibilidad de infraestructura multi-nube, Datadog destaca. Su panel unificado te permite monitorizar recursos en AWS, Azure, Google Cloud y sistemas locales en un solo lugar. Las funciones de auto-descubrimiento y etiquetado de la plataforma facilitan el seguimiento de activos a medida que el entorno crece o cambia. Para equipos que gestionan infraestructuras híbridas o distribuidas, Datadog ofrece un nivel de visibilidad y control que va más allá de lo que proporciona Netdata.
Características Clave de Datadog
Otras funciones de Datadog lo convierten en una opción flexible para la monitorización de aplicaciones:
- Gestión de Registros en Tiempo Real: Recopila, busca y analiza registros de múltiples fuentes para identificar rápidamente problemas y tendencias.
- APM (Monitoreo de Rendimiento de Aplicaciones): Rastrea solicitudes a través de sistemas distribuidos e identifica cuellos de botella en el código de la aplicación.
- Monitorización Sintética: Simula interacciones de usuarios y monitoriza los endpoints de la aplicación para asegurar disponibilidad y rendimiento.
- Monitoreo de Seguridad: Detecta amenazas y configuraciones erróneas en tiempo real correlacionando señales de seguridad con datos de infraestructura y aplicación.
Integraciones de Datadog
Incluye integraciones con AWS, Azure, Google Cloud, Kubernetes, Docker, Slack, PagerDuty, GitHub, Jira, ServiceNow y más.
Pros and Cons
Pros:
- Ofrece paneles personalizables y en tiempo real
- Incluye funciones integradas de monitoreo de seguridad
- Se integra con las principales herramientas de DevOps y TI
Cons:
- La retención de registros es limitada en los niveles más bajos
- Requiere instalación de un agente en cada host supervisado
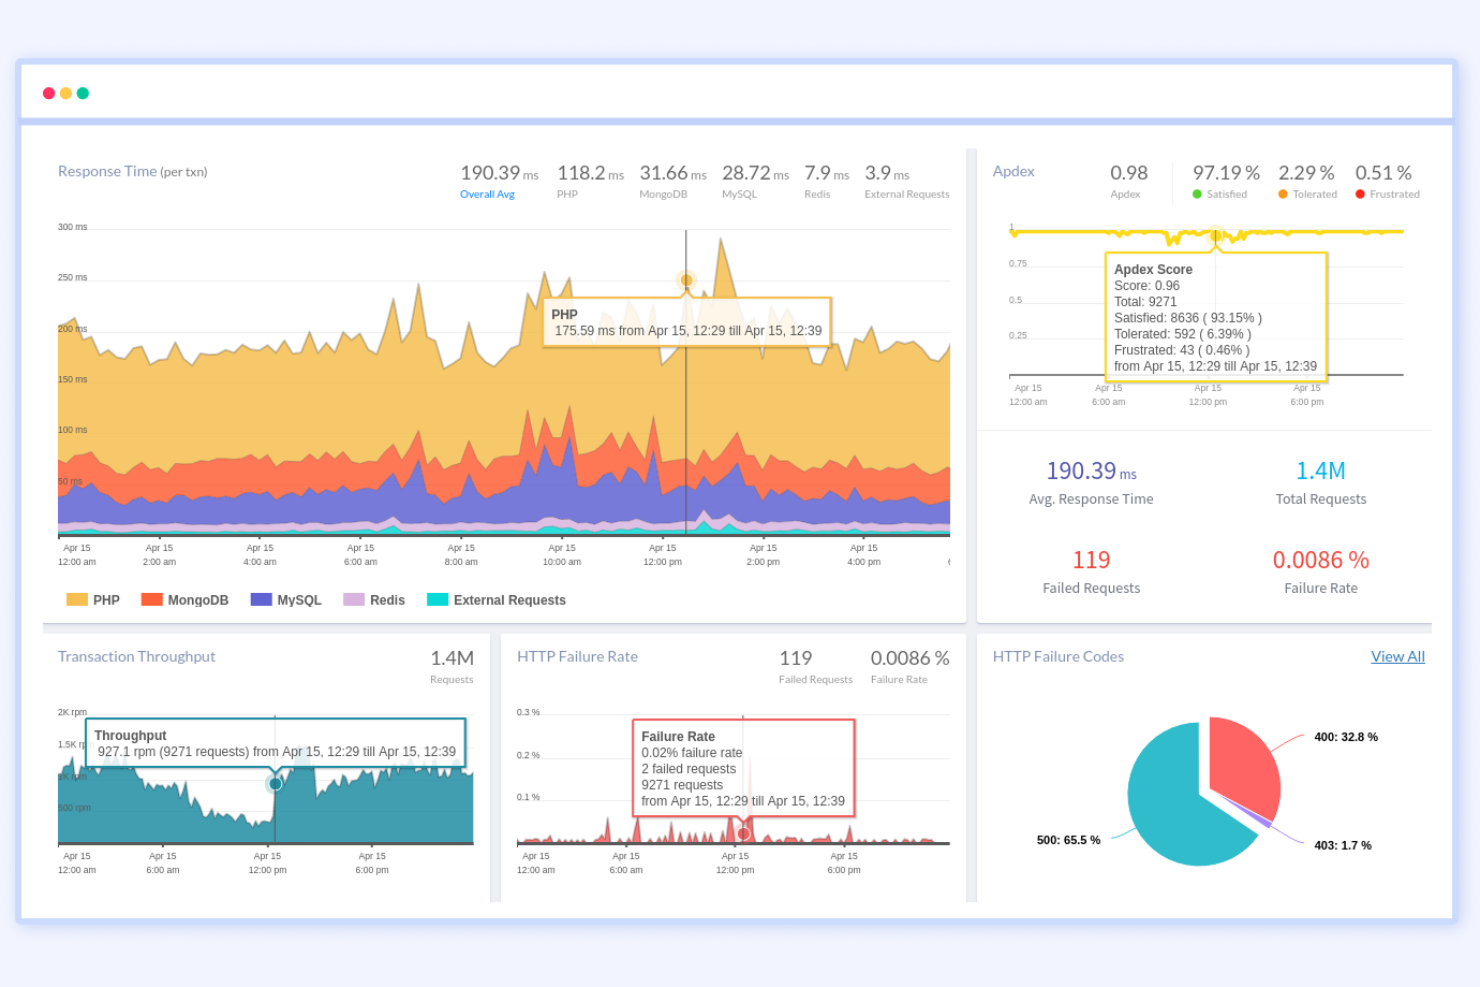
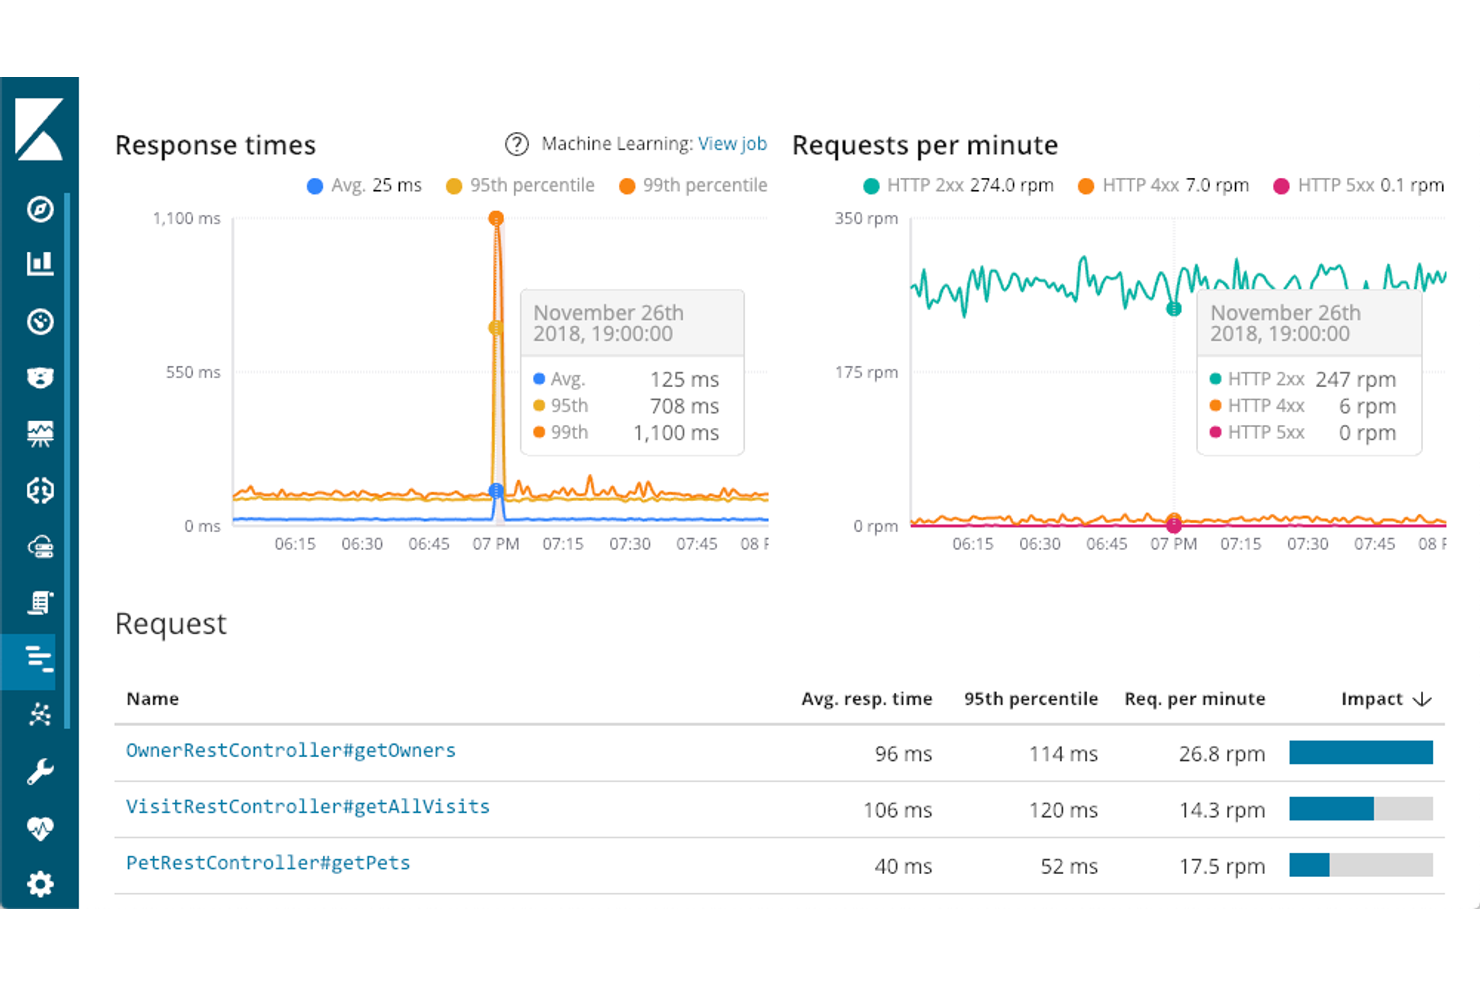
Si necesitas rastrear problemas tanto en los sistemas frontend como en los backend, Atatus está diseñado para ofrecer ese nivel de visibilidad. Esta herramienta atrae a los equipos de TI y desarrolladores que desean correlacionar los problemas de experiencia de usuario con los datos de rendimiento del backend en tiempo real. A diferencia de Netdata, Atatus conecta el monitoreo del navegador, las API y los servidores para que puedas identificar con exactitud dónde comienzan los problemas y cómo afectan a los usuarios.
Por qué Atatus es una buena alternativa a Netdata
A diferencia de Netdata, Atatus te ofrece una vista unificada del rendimiento tanto del frontend como del backend, lo que facilita rastrear problemas en toda la pila. Puedes monitorear errores del navegador, llamadas a API y métricas del servidor en un solo lugar, lo que ayuda a los equipos a conectar rápidamente los problemas de experiencia de usuario con sus causas en el backend. Valoro cómo Atatus visualiza toda la ruta de la transacción, para que puedas ver exactamente dónde se producen los cuellos de botella o fallos. Este nivel de correlación es especialmente útil para equipos de TI y desarrolladores que necesitan resolver incidentes complejos y de varios sistemas.
Características clave de Atatus
Otras funciones de Atatus permiten a los equipos cubrir una amplia gama de necesidades de monitoreo y solución de problemas:
- Monitoreo Real de Usuarios (RUM): Rastrea sesiones reales de usuarios y métricas de rendimiento desde los navegadores.
- Gestión de registros: Recoge, busca y analiza registros de múltiples fuentes en un panel unificado.
- Paneles personalizados: Te permite crear vistas personalizadas con widgets para las métricas más relevantes para tu equipo.
- Alertas y notificaciones: Envía alertas a través de canales como Slack, PagerDuty y correo electrónico cuando se superan los umbrales establecidos.
Integraciones de Atatus
Las integraciones incluyen Slack, Jira, Asana, PagerDuty, OpsGenie, VictorOps, BigPanda, Flowdock, HipChat, Campfire y más.
Pros and Cons
Pros:
- Gestión y búsqueda de registros integrada
- Admite alertas hacia múltiples herramientas de incidentes
- Paneles personalizados para métricas específicas del equipo
Cons:
- No dispone de opción de implementación on-premises
- No cuenta con plugins de comunidad de código abierto
Mejor para la monitorización de transacciones a escala empresarial
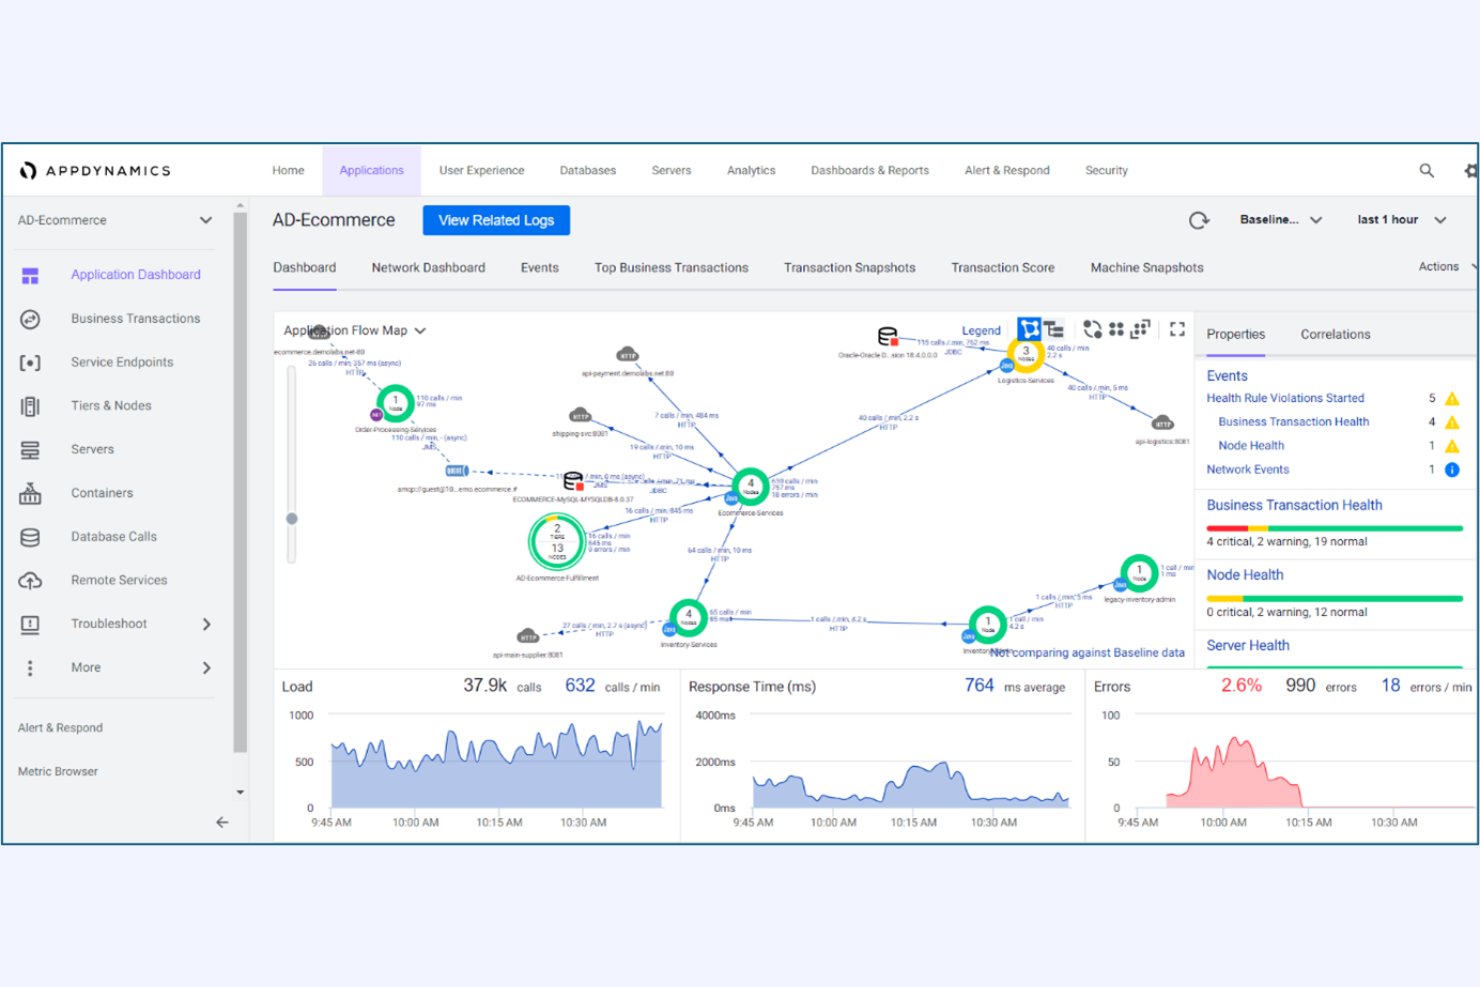
Para las organizaciones que necesitan una visibilidad profunda de las transacciones críticas para el negocio, AppDynamics ofrece monitorización y análisis a escala empresarial. Es una opción adecuada para equipos de TI en grandes empresas que necesitan rastrear transacciones complejas y distribuidas a través de múltiples servicios. A diferencia de Netdata, AppDynamics proporciona trazabilidad de transacciones de extremo a extremo y un análisis del impacto en el negocio para ayudar a los equipos a identificar y resolver rápidamente los cuellos de botella de rendimiento.
Por qué AppDynamics es una buena alternativa a Netdata
AppDynamics está diseñado específicamente para monitorizar transacciones complejas de nivel empresarial que abarcan múltiples aplicaciones y servicios. Su función de trazado de transacciones permite seguir cada paso de un proceso empresarial, desde la interacción del usuario hasta los sistemas backend, algo que Netdata no ofrece con este nivel de profundidad. Me gusta cómo AppDynamics correlaciona el rendimiento de la aplicación con los indicadores de negocio, permitiendo que los equipos de TI prioricen los problemas que afectan a los ingresos o a la experiencia del cliente. Esto lo convierte en una opción sólida para organizaciones que necesitan relacionar la monitorización técnica con los resultados empresariales.
Funciones clave de AppDynamics
Otras características de AppDynamics ayudan a los equipos a gestionar y optimizar sus entornos:
- Alertas de referencia dinámica: Establece automáticamente líneas base de rendimiento y genera alertas cuando las métricas se desvían de los patrones normales.
- Diagnóstico a nivel de código: Ofrece información detallada sobre la ejecución del código para ayudar a identificar métodos lentos y llamadas problemáticas a bases de datos.
- Cuadros de mando personalizados: Permite a los usuarios crear visualizaciones adaptadas para equipos, aplicaciones o unidades de negocio específicas.
- Monitorización nativa en la nube: Ofrece soporte de monitorización para Kubernetes, AWS, Azure y otras plataformas en la nube.
Integraciones de AppDynamics
Las integraciones incluyen Splunk Platform, Splunk Observability Cloud, Splunk IT Service Intelligence, ThousandEyes, Soluciones SAP, Log Observer Connect y más.
Pros and Cons
Pros:
- Correlación de impacto en el negocio para incidentes
- Diagnóstico a nivel de código para problemas de aplicaciones
- Líneas base dinámicas para la detección de anomalías
Cons:
- Soporte limitado para exportadores open-source
- La retención de métricas personalizadas está restringida según el plan
Si necesitas una visibilidad profunda y en tiempo real en aplicaciones distribuidas, New Relic está diseñado para ese desafío. Es una excelente opción para equipos de TI e ingenieros de fiabilidad de sitios que desean rastrear solicitudes a través de microservicios y entornos nativos en la nube. A diferencia de Netdata, New Relic se especializa en el rastreo distribuido de extremo a extremo y el análisis detallado de transacciones para arquitecturas modernas y complejas.
Por qué New Relic es una buena alternativa a Netdata
Para los equipos que necesitan seguir cada solicitud en tiempo real a lo largo de sistemas distribuidos, New Relic ofrece un nivel de rastreo que Netdata no iguala. Su función de rastreo distribuido te permite visualizar y analizar transacciones a medida que se mueven por microservicios, APIs y funciones sin servidor. Aprecio cómo los datos de rastreo de New Relic se vinculan directamente con registros y métricas, facilitando la identificación de la causa raíz de los problemas de rendimiento. Este enfoque en la visibilidad en tiempo real y de extremo a extremo es especialmente valioso para entornos modernos y nativos en la nube.
Funciones clave de New Relic
Otras funciones de New Relic complementan sus capacidades de monitoreo:
- Monitoreo de infraestructura: Supervisa la salud y el rendimiento de servidores, contenedores y recursos en la nube en tiempo real.
- Monitoreo sintético: Ejecuta pruebas automatizadas y simuladas de usuario para monitorear la disponibilidad de la aplicación y la capacidad de respuesta de los endpoints.
- Tableros personalizados: Crea y comparte visualizaciones utilizando una amplia gama de métricas y fuentes de datos.
- Alertas y gestión de incidentes: Configura políticas de alerta flexibles e integra herramientas de respuesta a incidentes para gestionar los problemas según surjan.
Integraciones de New Relic
Las integraciones incluyen AWS, Azure, Google Cloud, Kubernetes, Docker, Jenkins, PagerDuty, Slack, ServiceNow, Prometheus y más.
Pros and Cons
Pros:
- Rastreo distribuido en tiempo real a través de microservicios
- Análisis detallado de transacciones para aplicaciones nativas en la nube
- Monitoreo sintético automatizado para endpoints API
Cons:
- Límites de retención de datos en los planes de nivel inferior
- Las métricas de alta cardinalidad pueden aumentar los costos
Ideal para la recopilación de métricas de series temporales
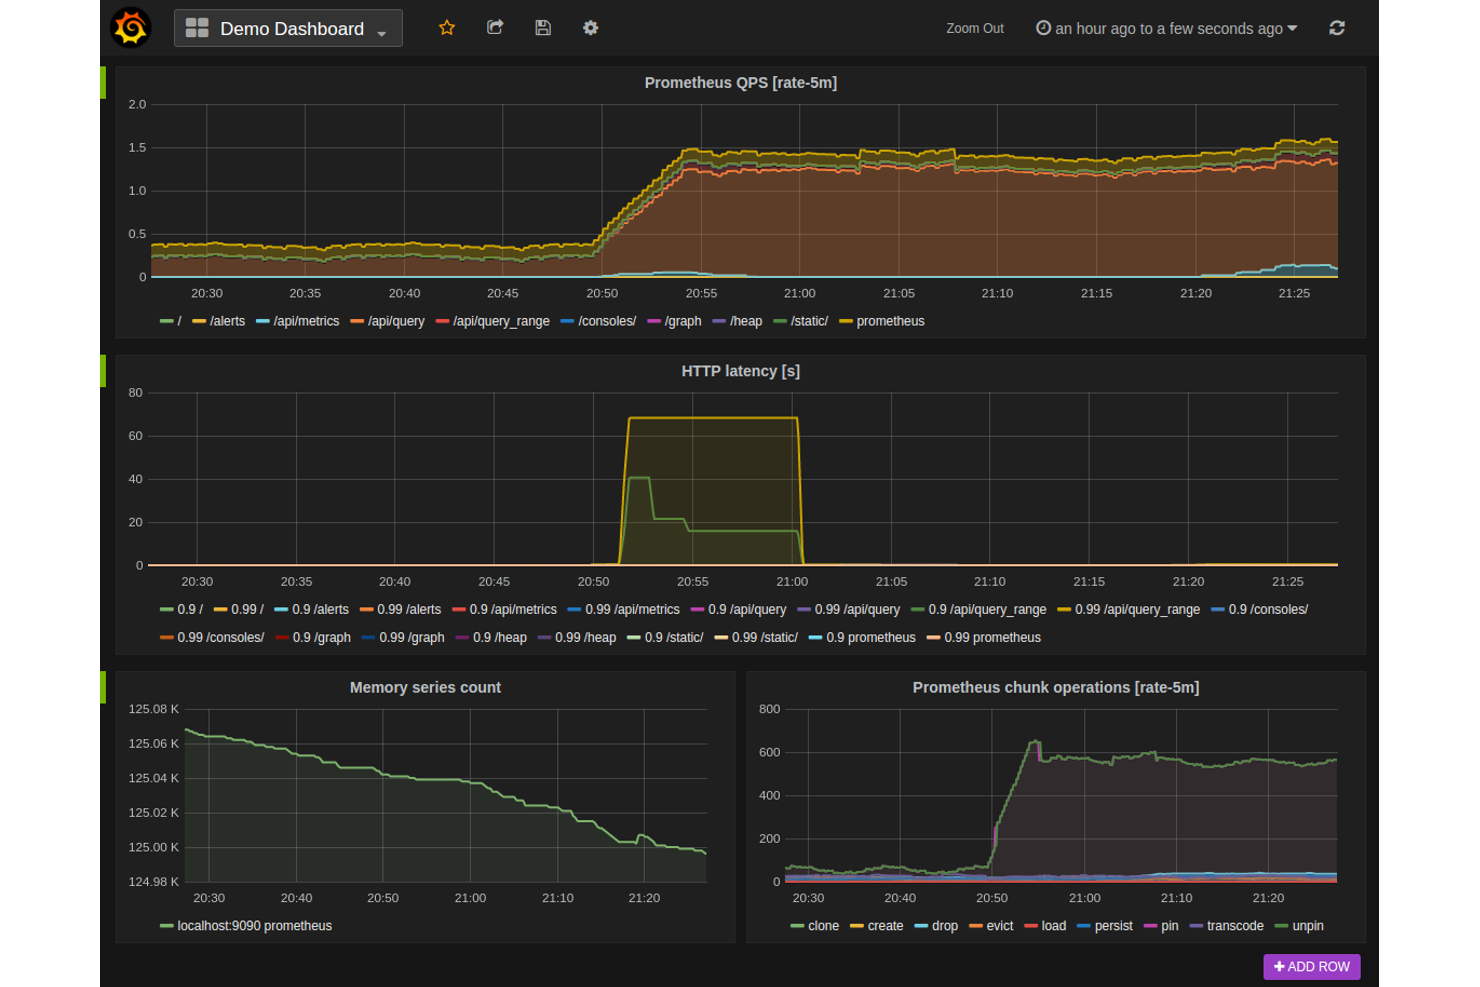
Prometheus está diseñado específicamente para equipos que necesitan recopilar y consultar métricas de series temporales a gran escala. Es especialmente popular entre especialistas en TI y SRE que buscan una solución de código abierto y flexible para monitorizar infraestructuras y aplicaciones. A diferencia de Netdata, Prometheus ofrece un potente lenguaje de consultas y soporte nativo para datos multidimensionales, lo que lo convierte en una opción sólida para entornos con necesidades complejas de métricas.
Por Qué Prometheus Es una Buena Alternativa a Netdata
Para equipos enfocados en recopilar y analizar métricas de series temporales, Prometheus ofrece un enfoque especializado que lo diferencia de Netdata. Elegí Prometheus porque utiliza un modelo de extracción (pull) para recopilar métricas, lo que te brinda un control preciso sobre qué datos recopilar y cuándo hacerlo. Su lenguaje de consultas PromQL te permite segmentar, agregar y visualizar métricas con un alto grado de flexibilidad. Esto hace que Prometheus sea especialmente útil para especialistas en TI que necesitan monitorizar entornos complejos y dinámicos, y desean crear paneles de control personalizados o reglas de alertas a medida.
Características Clave de Prometheus
Otras características de Prometheus ayudan a los equipos a gestionar y ampliar su sistema de monitorización:
- Integración con Alertmanager: Dirige alertas según reglas personalizadas y soporta silenciamiento e inhibición.
- Descubrimiento de Servicios: Detecta automáticamente objetivos en entornos dinámicos como Kubernetes o plataformas en la nube.
- Configuración de Retención de Datos: Te permite controlar cuánto tiempo se almacenan localmente las métricas.
- Ecosistema de Exportadores: Ofrece una amplia gama de exportadores para recopilar métricas de sistemas y servicios de terceros.
Integraciones de Prometheus
Las integraciones incluyen Kubernetes, Docker, Grafana, Alertmanager, Etcd, Consul, RabbitMQ, MySQL, Apache, HAProxy y más.
Pros and Cons
Pros:
- PromQL permite consultas avanzadas de métricas
- El modelo de extracción (pull) soporta entornos dinámicos
- Gran ecosistema de exportadores para sistemas de terceros
Cons:
- Carece de visualización en tiempo real y por segundo
- Se requieren herramientas externas para la creación de paneles
La mejor con integraciones de datos de código abierto
Para equipos que desean unificar la supervisión de aplicaciones con fuentes de datos de código abierto, Elastic Observability ofrece un enfoque flexible. Esta herramienta es ideal para especialistas en TI y equipos DevOps que necesitan ingerir, analizar y correlacionar datos de una amplia gama de fuentes abiertas y personalizadas. A diferencia de Netdata, Elastic Observability se integra profundamente con Elastic Stack, facilitando la combinación de registros, métricas y trazas de entornos diversos.
Por Qué Elastic Observability Es una Buena Alternativa a Netdata
Si necesitas reunir datos de herramientas de código abierto y fuentes personalizadas, Elastic Observability destaca por su flexibilidad. Elegí Elastic Observability porque te permite ingerir y correlacionar registros, métricas y trazas desde casi cualquier origen utilizando Elastic Stack. Puedes utilizar agentes e integraciones de código abierto para supervisar desde aplicaciones nativas en la nube hasta sistemas heredados. Este enfoque es especialmente útil para equipos de TI que buscan construir una plataforma de observabilidad unificada adaptada a su entorno.
Características Clave de Elastic Observability
Otras características en Elastic Observability ayudan a los equipos a gestionar y analizar el desempeño de aplicaciones a escala:
- Trazabilidad Distribuida: Visualiza los flujos de solicitudes de extremo a extremo a través de microservicios e infraestructura.
- Mapas de Servicios: Genera automáticamente mapas interactivos de dependencias y estado de los servicios.
- Detección de Anomalías: Utiliza aprendizaje automático para identificar patrones inusuales en el rendimiento de las aplicaciones.
- Paneles Personalizados: Permite crear y compartir paneles adaptados a las necesidades de supervisión de tu equipo.
Integraciones APM de Elastic Observability
Las integraciones incluyen Amazon CloudWatch, Azure Monitor, Google Cloud, Kubernetes, Prometheus, Jaeger, OpenTelemetry, PagerDuty, ServiceNow, Slack y más.
Pros and Cons
Pros:
- Admite agentes de código abierto y captura de datos
- Ofrece trazabilidad distribuida para microservicios
- Aprendizaje automático integrado para detección de anomalías
Cons:
- Requiere infraestructura separada para el autoalojamiento
- Uso de recursos más elevado que agentes ligeros

Grafana Cloud destaca para equipos que necesitan visualizaciones avanzadas y personalizables de paneles a través de múltiples fuentes de datos. Es una opción sólida para especialistas en TI, ingenieros DevOps y analistas que buscan unificar métricas, registros y trazas en un solo lugar. A diferencia de Netdata, Grafana Cloud te permite crear paneles altamente personalizados que recolectan información de una amplia variedad de herramientas de monitorización y observabilidad.
Por qué Grafana Cloud es una buena alternativa a Netdata
Si necesitas visualizaciones avanzadas de paneles que van más allá de lo que ofrece Netdata, Grafana Cloud es una opción sólida. Elijo Grafana Cloud porque te permite crear paneles altamente personalizables que combinan datos de múltiples fuentes, incluidas métricas, registros y trazas. Su editor de paneles es compatible con una amplia gama de tipos de visualización, desde gráficos de series temporales hasta mapas de calor y geomapas. Esta flexibilidad ayuda a los equipos de TI e ingenieros a crear vistas de monitorización que se adaptan a sus necesidades particulares de infraestructura y aplicaciones.
Características clave de Grafana Cloud
Otras características de Grafana Cloud ayudan a los equipos a ampliar sus capacidades de monitorización y visualización:
- Motor de alertas: Compatible con notificaciones multicanal y reglas de alerta personalizadas.
- Controles de acceso de usuarios: Permite gestionar permisos y roles para diferentes miembros del equipo.
- Mercado de complementos: Ofrece una amplia variedad de complementos para fuentes de datos y visualizaciones.
- Compartir instantáneas: Permite compartir estados de paneles con otros para colaboración o resolución de problemas.
Integraciones de Grafana Cloud
Las integraciones incluyen Prometheus, Loki, Tempo, Mimir, Graphite, InfluxDB, Elasticsearch, MySQL, AWS CloudWatch, Zabbix y más.
Pros and Cons
Pros:
- Ofrece un extenso mercado de complementos para ampliar funcionalidades
- Permite compartir paneles mediante enlaces de instantáneas
- Se integra nativamente con las principales herramientas de monitorización en la nube
Cons:
- No incluye monitorización integrada a nivel de procesos o sistema
- Retención limitada de datos históricos sin planes de pago
AWS CloudWatch está diseñado específicamente para equipos que ejecutan cargas de trabajo en AWS y que necesitan una visibilidad profunda y nativa de sus recursos en la nube. Es especialmente útil para especialistas en TI e ingenieros de la nube que desean monitorear, registrar y automatizar respuestas en EC2, Lambda, RDS y otros servicios de AWS. A diferencia de Netdata, CloudWatch ofrece integración directa con la infraestructura de AWS, lo que facilita el seguimiento de la salud y el rendimiento de los recursos sin configuración adicional.
Por qué AWS CloudWatch es una buena alternativa a Netdata
Para los equipos que gestionan infraestructura en AWS, CloudWatch ofrece monitoreo nativo estrechamente integrado con los servicios de AWS. Elegí CloudWatch porque recopila automáticamente métricas y registros de EC2, Lambda, RDS y otros recursos de AWS sin configuración extra. Su panel unificado te permite visualizar la salud de los recursos, configurar alarmas y automatizar acciones basadas en datos en tiempo real. Esta conexión directa con los servicios de AWS hace que CloudWatch sea una fuerte alternativa a Netdata para entornos centrados en la nube.
Características clave de AWS CloudWatch
Otras características de AWS CloudWatch ayudan a los equipos a gestionar y analizar su entorno AWS de forma más completa:
- Métricas personalizadas: Te permite publicar y monitorear tus propias métricas de aplicación o negocio junto con los datos de recursos de AWS.
- Log Insights: Ofrece un motor de consultas para buscar y analizar datos de registros en tiempo real.
- Detección de anomalías: Utiliza aprendizaje automático para detectar automáticamente patrones inusuales en las métricas.
- Compartir paneles: Permite compartir paneles interactivos con otros usuarios o equipos de AWS.
Integraciones de AWS CloudWatch
Las integraciones incluyen Amazon EC2, Amazon RDS, AWS Lambda, Amazon S3, Amazon ECS, Amazon EKS, Amazon DynamoDB, Amazon SNS, Amazon SQS, Amazon Kinesis y más.
Pros and Cons
Pros:
- Integración nativa con todos los servicios de AWS
- Recopilación automatizada de métricas y registros para recursos de AWS
- Admite detección de anomalías mediante aprendizaje automático
Cons:
- Visibilidad limitada en la infraestructura que no es de AWS
- Las métricas personalizadas pueden aumentar los costos mensuales
Los equipos de TI que gestionan infraestructuras tanto locales como en la nube encontrarán que SolarWinds Observability SaaS está diseñado para ofrecer visibilidad en entornos híbridos. La plataforma resulta atractiva para las organizaciones que necesitan monitorización unificada en servidores, contenedores y servicios en la nube sin tener que utilizar varias herramientas. A diferencia de Netdata, AppOptics ofrece monitorización de infraestructura y aplicaciones integrada, con soporte para trazabilidad distribuida en entornos mixtos.
Por qué SolarWinds Observability SaaS es una buena alternativa a Netdata
Para las organizaciones que operan tanto sistemas en la nube como en instalaciones locales, SolarWinds Observability SaaS destaca por su soporte a entornos híbridos. La herramienta proporciona monitorización unificada para servidores, contenedores y servicios nativos de la nube, algo que Netdata no gestiona de forma nativa en entornos mixtos. Me gusta que AppOptics incluya trazabilidad distribuida y monitorización de infraestructura en una sola plataforma, lo que facilita el seguimiento del rendimiento en toda la pila tecnológica. Este enfoque ayuda a los equipos de TI a mantener la visibilidad y solucionar problemas sin importar dónde se ejecuten las cargas de trabajo.
Principales características de SolarWinds Observability SaaS
Otras funciones de AppOptics ayudan a los equipos a sacar más provecho de su configuración de monitorización:
- Soporte de métricas personalizadas: Recoge y visualiza métricas personalizadas de aplicaciones y negocios junto a la telemetría estándar.
- Biblioteca de integraciones prediseñadas: Ofrece una amplia gama de integraciones listas para usar con bases de datos populares, servidores web y sistemas de mensajería.
- Perfilado de código en vivo: Proporciona información en tiempo real a nivel de código para ayudar a identificar cuellos de botella de rendimiento en producción.
- Reglas de alertas y notificaciones: Permite a los usuarios configurar políticas de alertas flexibles y enviar notificaciones por correo electrónico, Slack u otros canales.
Integraciones de SolarWinds Observability SaaS
Las integraciones incluyen AWS, Azure, Cisco, Slack, Java, MySQL, MongoDB, PostgreSQL, Amazon Aurora, Redis y más.
Pros and Cons
Pros:
- Ofrece perfilado de código en vivo para aplicaciones
- Incluye integraciones prediseñadas para las principales bases de datos
- Proporciona paneles e informes personalizados
Cons:
- No dispone de opción de despliegue solo en local
- Carece de funciones integradas de gestión de registros
Los desarrolladores y los equipos de ingeniería que buscan una visibilidad profunda de errores en sus despliegues de código suelen recurrir a Sentry. La plataforma se especializa en el rastreo de errores en tiempo real y el monitoreo del rendimiento de aplicaciones en múltiples lenguajes y frameworks. A diferencia de Netdata, Sentry identifica problemas a nivel de código y regresiones entre versiones, ayudando a los equipos a resolver errores antes de que impacten a los usuarios.
Por Qué Sentry Es una Buena Alternativa a Netdata
Si tu principal preocupación es detectar y resolver errores en los despliegues de código, Sentry ofrece una solución enfocada que Netdata no aborda. Sentry rastrea excepciones y problemas de rendimiento a nivel de código, proporcionándote trazas detalladas y seguimiento de versiones para identificar la causa raíz de las fallas. Me gusta cómo Sentry destaca los errores nuevos introducidos por lanzamientos recientes, lo que permite identificar rápidamente las regresiones. Esto lo convierte en una opción sólida para equipos que necesitan monitorear la salud de la aplicación desde la perspectiva del desarrollador.
Funciones Clave de Sentry
Otras funciones de Sentry ayudan a los equipos a sacar más provecho de sus flujos de monitoreo:
- Monitoreo de Rendimiento: Rastrea los tiempos de transacción y la latencia de la aplicación para ayudar a identificar ralentizaciones.
- Análisis de Impacto en el Usuario: Muestra qué usuarios se ven afectados por errores o problemas de rendimiento específicos.
- Seguimiento de la Salud de Lanzamientos: Supervisa la adopción, las sesiones sin fallos y la estabilidad de cada lanzamiento.
- Integraciones con Terceros: Se conecta con herramientas como GitHub, Jira y Slack para una gestión de incidencias más ágil.
Integraciones de Sentry
Las integraciones incluyen GitHub, Slack, Jira, GitLab, Azure DevOps, Vercel, Bitbucket, PagerDuty, Microsoft Teams, Datadog y más.
Pros and Cons
Pros:
- Rastrea errores hasta commits específicos de código
- Ofrece alertas en tiempo real para nuevas incidencias
- Proporciona métricas de salud de lanzamientos para los despliegues
Cons:
- La retención de datos de eventos depende del plan
- Requiere integración del SDK para cada aplicación
New Product Updates from Sentry

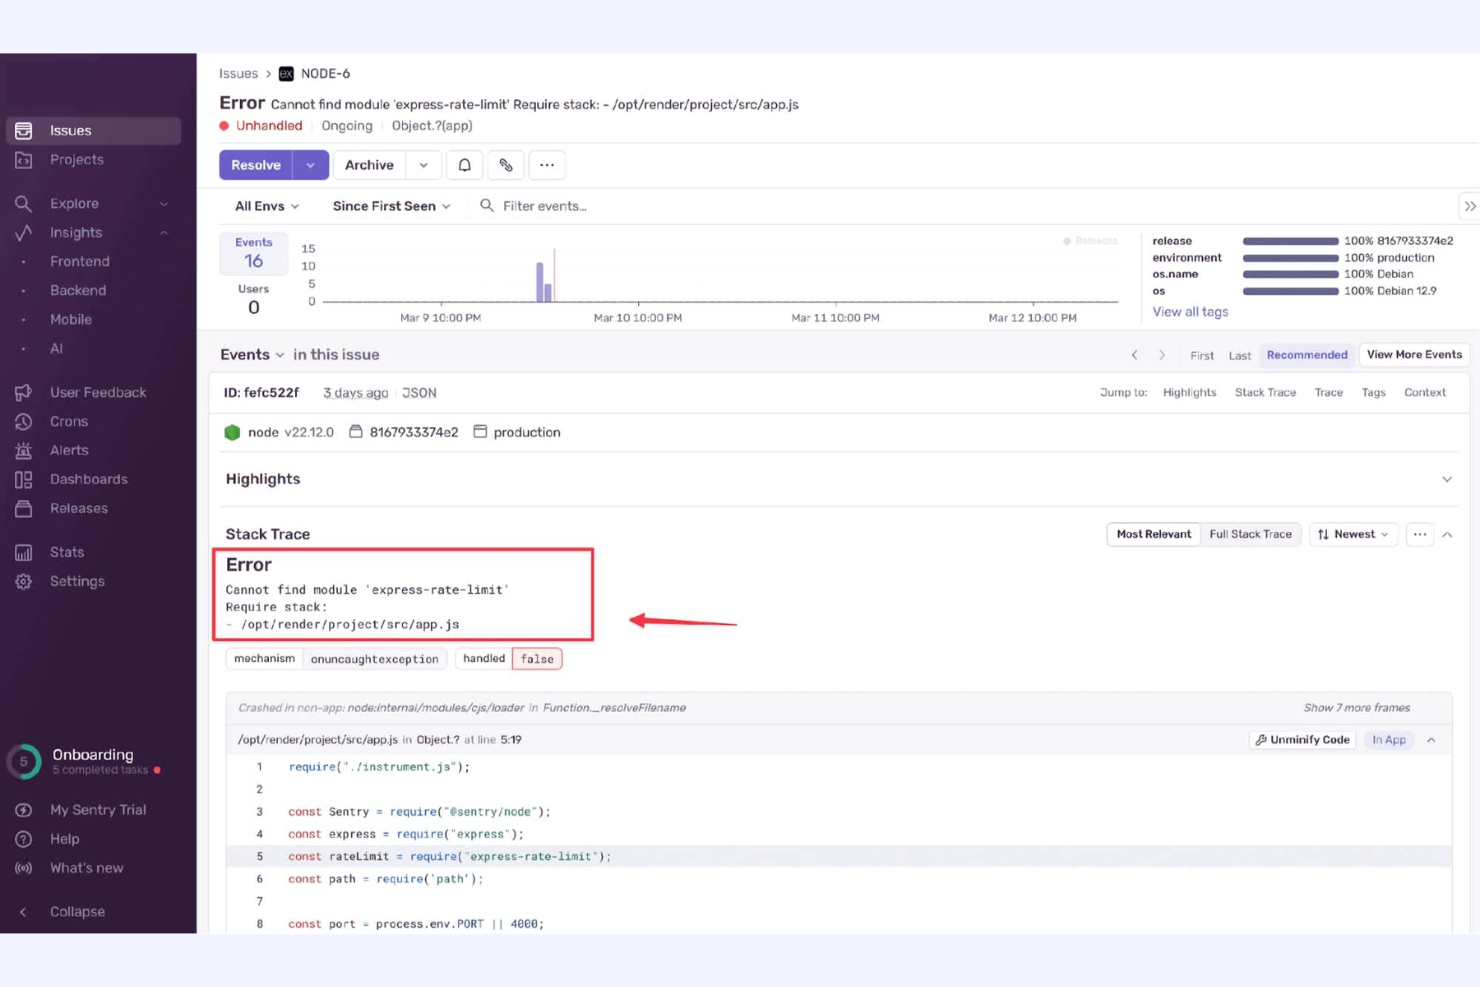
Sentry Adds Heatmaps to Application Metrics
Sentry introduced heatmaps for Application Metrics to visualize metric value distributions over time, helping teams spot patterns like latency bursts and use heatmaps in Custom Dashboards. For more information, visit Sentry's official site.
 .
.Otras alternativas a Netdata
Aquí tienes algunas alternativas a Netdata adicionales que no entraron en la lista corta, pero que siguen siendo opciones a considerar:
- Dynatrace
Ideal para la detección de anomalías mediante IA
- ManageEngine Applications Manager
Ideal para flujos de trabajo de alertas personalizables
- Riverbed
Ideal para obtener información sobre el rendimiento de la red


Criterios de selección de alternativas a Netdata
Al seleccionar las mejores alternativas a Netdata para incluir en esta lista, tuve en cuenta necesidades comunes de compradores y dificultades relacionadas con productos de monitoreo de aplicaciones, como el seguimiento de entornos en la nube distribuidos y la reducción de la fatiga por alertas. También utilicé el siguiente marco de referencia para mantener mi evaluación estructurada y justa:
Funcionalidad principal (25% de la puntuación total)
Para ser consideradas en esta lista, cada solución debía cumplir con los siguientes casos de uso comunes:
- Monitorizar la salud de aplicaciones e infraestructuras
- Recoger y visualizar métricas en tiempo real
- Generar y gestionar alertas
- Almacenar y buscar datos de logs
- Soportar integraciones con plataformas populares
Características destacadas adicionales (25% de la puntuación total)
Para seguir reduciendo la competencia, también busqué características únicas, como:
- Análisis automatizado de la causa raíz
- Detección de anomalías impulsada por IA
- Capacidades de trazabilidad distribuida
- Creación de métricas personalizadas y paneles
- Flujos de trabajo de respuesta a incidentes integrados
Facilidad de uso (10% de la puntuación total)
Para conocer la facilidad de uso de cada sistema, consideré lo siguiente:
- Navegación sencilla e intuitiva por el panel de control
- Opciones claras de visualización de datos
- Proceso lógico para la configuración de alertas
- Interfaz responsiva y accesible
- Mínimos pasos de configuración para las funciones principales
Onboarding (10% del puntaje total)
Para evaluar la experiencia de incorporación de cada plataforma, consideré lo siguiente:
- Disponibilidad de guías paso a paso para la configuración
- Acceso a videos de capacitación y documentación
- Recorridos interactivos por el producto o guías prácticas
- Plantillas prediseñadas para casos de uso comunes
- Soporte para migración de datos desde otras herramientas
Atención al cliente (10% del puntaje total)
Para evaluar los servicios de soporte al cliente de cada proveedor de software, consideré lo siguiente:
- Múltiples canales de soporte incluyendo chat y correo electrónico
- Tiempos de respuesta rápidos ante problemas técnicos
- Acceso a una base de conocimientos o centro de ayuda
- Disponibilidad de foros de comunidad o grupos de usuarios
- Opción de gestión de cuenta dedicada
Relación calidad-precio (10% del puntaje total)
Para evaluar la relación calidad-precio de cada plataforma, consideré lo siguiente:
- Estructura de precios transparente y predecible
- Planes flexibles para diferentes tamaños de equipo
- Funciones incluidas en los planes básicos
- Costo de ampliación con datos o usuarios adicionales
- Disponibilidad de prueba gratuita o plan gratuito
Reseñas de clientes (10% del puntaje total)
Para conocer la satisfacción general del cliente, tuve en cuenta lo siguiente al leer las reseñas de los usuarios:
- Consistencia en los comentarios positivos entre plataformas
- Informes sobre confiabilidad y tiempo de actividad
- Comentarios sobre experiencias de soporte y onboarding
- Opiniones de los usuarios sobre la utilidad de las funciones
- Frecuencia de actualizaciones y mejoras
¿Por qué buscar una alternativa a Netdata?
Si bien Netdata es una buena opción como herramienta de monitoreo de aplicaciones, hay varias razones por las que algunos usuarios buscan soluciones alternativas. Puede que estés buscando una alternativa a Netdata porque…
- Necesitas integración más profunda con AWS u otras plataformas en la nube
- Quieres soporte incorporado para rastreo distribuido
- Requieres detección avanzada de anomalías utilizando IA
- Necesitas monitoreo centralizado en entornos híbridos o multinube
- Deseas mayor retención de registros sin configuración adicional
- Requieres controles de acceso y características de cumplimiento de nivel empresarial
Si te identificas con alguna de estas necesidades, estás en el lugar correcto. Mi lista incluye varias opciones de herramientas de monitoreo de aplicaciones que se adaptan mejor a equipos que enfrentan estos retos con Netdata y buscan soluciones alternativas.
Principales características de Netdata
Aquí tienes algunas de las características clave de Netdata, para ayudarte a contrastar y comparar lo que ofrecen las soluciones alternativas:
- Monitoreo en tiempo real de métricas del sistema y aplicaciones
- Paneles interactivos con visualizaciones personalizables
- Detección automática de cientos de métricas y servicios
- Agente liviano para un consumo mínimo de recursos
- Monitoreo de estado con alarmas preconfiguradas
- Transmisión y almacenamiento a largo plazo de métricas
- Recolección distribuida de datos desde múltiples nodos
- Acceso por API para integraciones personalizadas
- Granularidad por segundo para datos de alta resolución
- Arquitectura de código abierto con apoyo activo de la comunidad