Leitfaden zu den 10 besten Überwachungs-Tools von 2026

10 Die beste Monitoring-Tools Shortlist
Here's my pick of the 10 best software from the 19 tools reviewed.


Infrastruktur-Monitoring-Software hilft dir dabei, den Zustand und die Leistung deiner Systeme zu überwachen, egal ob du Server, Netzwerke, Anwendungen oder virtuelle Maschinen verwaltest.
Viele Teams suchen nach solchen Tools, wenn sie blinde Flecken in ihrer Infrastruktur haben, Schwierigkeiten haben, Probleme frühzeitig zu erkennen, oder Zeit damit verschwenden, zwischen verschiedenen Dashboards zu wechseln. Wenn man das falsche oder ein veraltetes Tool nutzt, kann das zu verpassten Warnungen, Ausfallzeiten oder eingeschränkter Sicht führen.
Ich habe bereits Teams dabei unterstützt, Monitoring-Plattformen auszuwählen und einzurichten, die wirklich zu ihren Bedürfnissen passen – und das Troubleshooting vereinfachen statt erschweren. Dieser Leitfaden basiert auf diesen praktischen Erfahrungen, sodass du eine Software findest, die dir Übersicht verschafft, statt dich zusätzlich zu belasten.
Why Trust Our Software Reviews
We’ve been testing and reviewing software since 2023. As tech leaders ourselves, we know how critical and difficult it is to make the right decision when selecting software.
We invest in deep research to help our audience make better software purchasing decisions. We’ve tested more than 2,000 tools for different tech use cases and written over 1,000 comprehensive software reviews. Learn how we stay transparent & our software review methodology.
Monitoring-Tools Überblick
Diese Vergleichstabelle fasst die Preisinformationen meiner Monitoring-Tool-Top-Auswahl zusammen, damit du das passende Tool für dein Budget und deinen Unternehmensbedarf findest.
| Tool | Best For | Trial Info | Price | ||
|---|---|---|---|---|---|
| 1 | Am besten für proaktive Problemerkennung | 30-tägige kostenlose Testphase + kostenlose Demo verfügbar | Ab $149/Techniker/Monat (jährliche Abrechnung) | Website | |
| 2 | Beste Open-Source-Lösung | Kostenloser Tarif verfügbar | Preise auf Anfrage | Website | |
| 3 | Am besten geeignet für Echtzeit-Netzwerktransparenz | 14-tägige kostenlose Testversion verfügbar | Preise auf Anfrage | Website | |
| 4 | Am besten geeignet für die plattformübergreifende Überwachung | Kostenlose Testversion verfügbar | Ab 2.149/Jahr | Website | |
| 5 | Am besten geeignet für Performance-Tracking in Echtzeit | 30-tägige kostenlose Testversion + kostenlose Demo + kostenloser Plan verfügbar | Ab $199/Jahr | Website | |
| 6 | Am besten geeignet für Echtzeit-Fehlerverfolgung in Anwendungen | Kostenloser Tarif + kostenlose Demo verfügbar | Ab $26/Monat (jährliche Abrechnung) | Website | |
| 7 | Gut für die Datenbankgesundheitsüberwachung in Echtzeit | 30-tägige kostenlose Testversion verfügbar | Ab $7/Knoten/Monat | Website | |
| 8 | Am besten für proaktives Monitoring geeignet | Kostenlose Demo + 30-tägige kostenlose Testphase verfügbar | Ab $9/Monat (jährliche Abrechnung) | Website | |
| 9 | Am besten geeignet für vollständiges Netzwerkmanagement | Kostenlose Demo verfügbar | Ab $245/Monat (jährliche Abrechnung) | Website | |
| 10 | Am besten geeignet für KI-gestützte Anomalieerkennung | Kostenlose Demo + 15-tägige kostenlose Testversion verfügbar | Preise auf Anfrage | Website |

-

Site24x7
Visit WebsiteThis is an aggregated rating for this tool including ratings from Crozdesk users and ratings from other sites.4.7 -
GitHub Actions
Visit WebsiteThis is an aggregated rating for this tool including ratings from Crozdesk users and ratings from other sites.4.8 -
Docker
Visit WebsiteThis is an aggregated rating for this tool including ratings from Crozdesk users and ratings from other sites.4.6


Monitoring-Tools Reviews
Unten findest du meine ausführlichen Zusammenfassungen der besten Monitoring-Tools, die es auf meine Shortlist geschafft haben. Meine Reviews bieten einen detaillierten Einblick in die wichtigsten Funktionen, Vor- u0026 Vorteile, Integrationen sowie die optimalen Anwendungsfälle zu jedem Tool, damit du das richtige für dich findest.
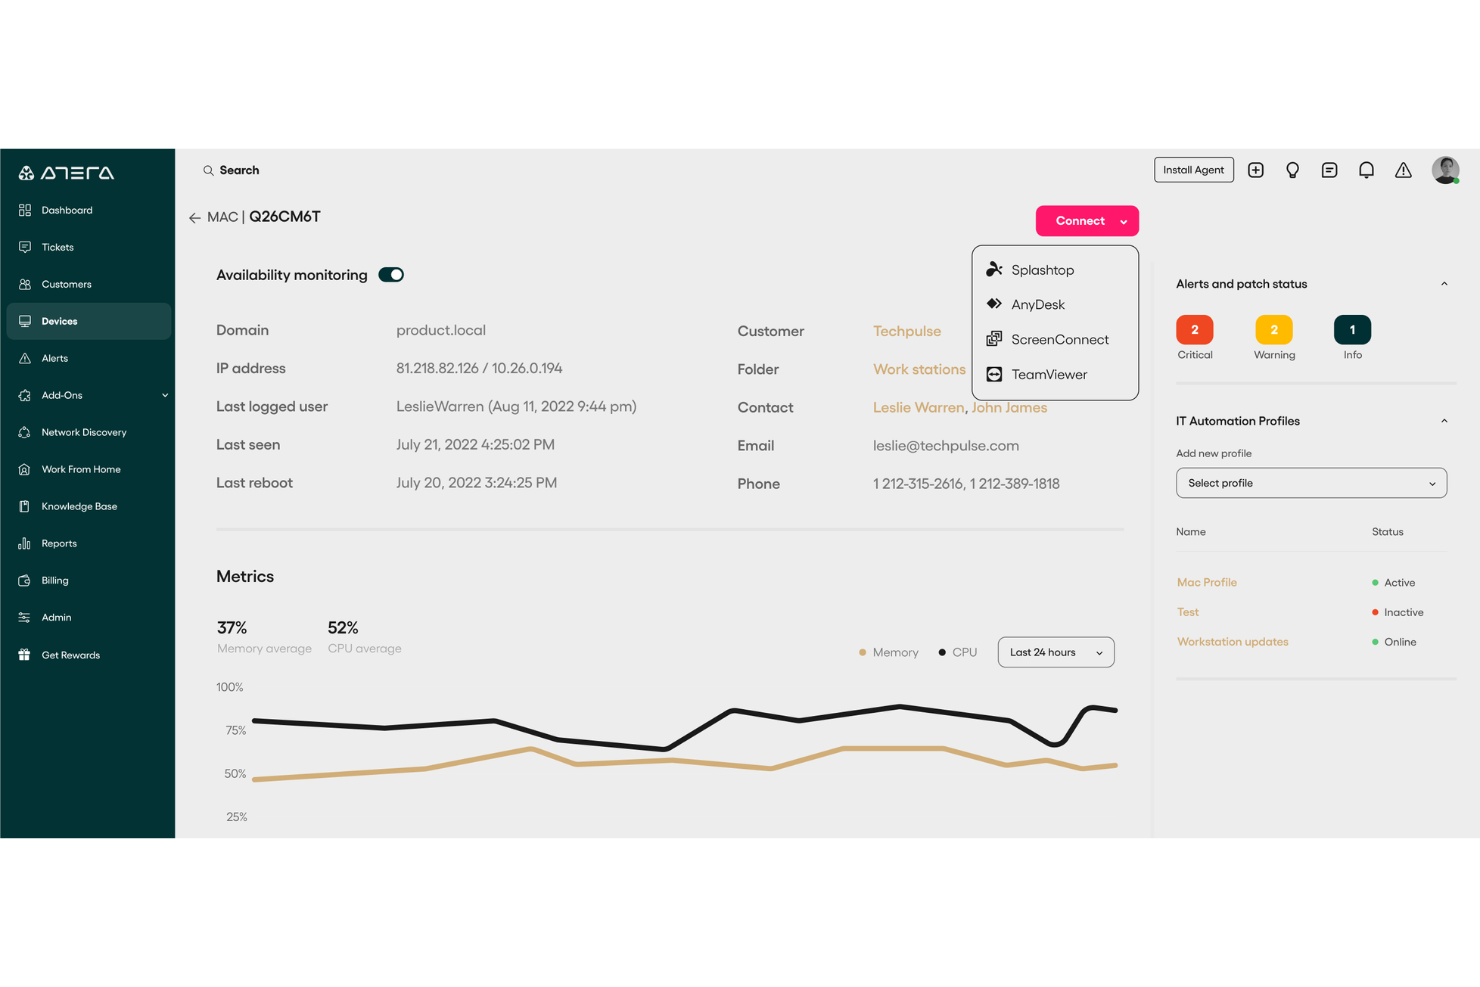
Atera ist eine All-in-One-IT-Management-Plattform, die für Managed Service Provider (MSPs) und IT-Fachleute entwickelt wurde. Sie unterstützt Sie bei der Überwachung, Verwaltung und Automatisierung von IT-Operationen über Geräte und Netzwerke hinweg, mit starkem Fokus auf die Reduzierung manueller Arbeitsaufwände durch KI und Automatisierung. Atera bietet Echtzeit-Transparenz bezüglich Systemleistung, Netzwerkgesundheit und Gerätestatus. Dadurch wird das proaktive Management von IT-Umgebungen erleichtert.
Warum ich Atera gewählt habe: Ich habe Atera gewählt, weil es sich durch seine Remote-Monitoring- und Management-(RMM)-Fähigkeiten auszeichnet, mit denen Sie Leistung, Verfügbarkeit und Netzwerkgesundheit in Echtzeit überwachen können. So lassen sich Probleme leichter erkennen und beheben, bevor sie eskalieren. Ebenso schätze ich die KI-gestützten Automatisierungstools von Atera, die die Ticketbearbeitung beschleunigen und Zeit für strategischere IT-Aufgaben schaffen. Die anpassbaren Dashboards erhöhen zudem die Benutzerfreundlichkeit, da sie vollständige Kontrolle über die Darstellung Ihrer Umgebung bieten.
Hervorstechende Funktionen & Integrationen:
Ateras Funktionen umfassen Patch-Management, um Systeme sicher und aktuell zu halten, sowie Netzwerk-Erkennungstools, die einen klaren Überblick über alle verbundenen Geräte liefern. Erweiterte Berichte helfen Ihnen dabei, Leistungstrends zu analysieren, während das integrierte Ticket-System die Problemverfolgung zentralisiert. Zu den Integrationen gehören Salesforce, HubSpot, Microsoft Teams, Zendesk, Jira Software Cloud, Acronis Cyber Protect Cloud, Asana, ServiceNow und WhatsApp-Benachrichtigungen, neben vielen anderen.
Pros and Cons
Pros:
- Preisgünstiges Modell, das pro Techniker und nicht pro Gerät abrechnet
- Kombiniert Remote-Monitoring, Ticketing und Automatisierung
- Effektives IT-Management und Problemlösung
Cons:
- Kann eine geringe Einarbeitungszeit erfordern
- Es fehlen einige erweiterte Anpassungsoptionen
New Product Updates from Atera

Atera Enhances IT Autopilot With Automation and File Support
Atera’s IT Autopilot gets three major boosts: you can now attach common files for deeper analysis, automate IT tasks with clear workflows, and choose how the system follows up when users go silent. These updates help streamline IT operations and improve resolution efficiency. For more information, visit Atera’s official site.
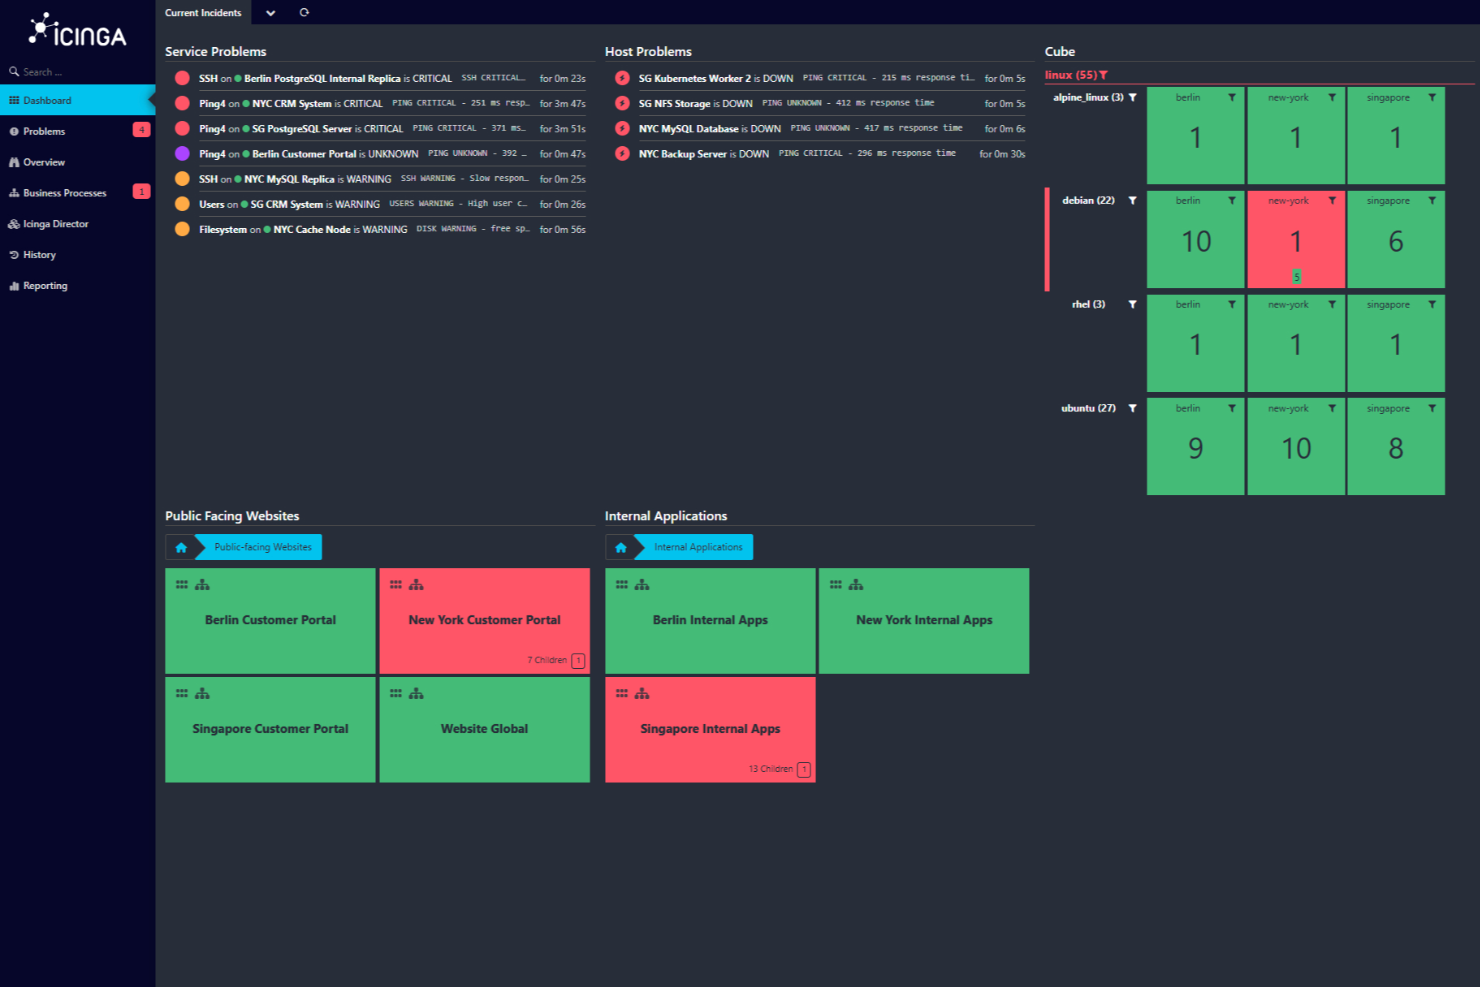
Icinga ist eine Open-Source-Monitoring-Lösung, mit der Sie Ihre gesamte IT-Infrastruktur im Blick behalten können. Sie wurde entwickelt, um komplexe Umgebungen zu bewältigen, und bietet eine breite Palette an Funktionen, damit Ihre Systeme reibungslos laufen.
Warum ich Icinga ausgewählt habe: Mit Icinga können Sie alles überwachen – von Servern und Netzwerken bis hin zu Anwendungen und Datenbanken. Sie können Daten automatisch aus Quellen wie Active Directory oder Cloud-Plattformen wie AWS und Azure importieren, wodurch Ihr Monitoring immer mit Ihrer Infrastruktur synchronisiert bleibt. Mir gefällt auch, dass Monitoring-Automatisierung möglich ist, sodass Sie wiederkehrende Prozesse einfacher verwalten können. Mit den bereitgestellten Metriken und Protokollen lassen sich zusätzlich Daten erfassen und auswerten, um wertvolle Einblicke in Ihre Systeme zu gewinnen.
Herausragende Funktionen & Integrationen:
Weitere wichtige Funktionen sind verteiltes und agentenbasiertes Monitoring, das die Überwachung an mehreren Standorten ermöglicht, sowie anpassbare Warnungen und Benachrichtigungen, die Ihnen helfen, Probleme rasch zu beheben. Mit den Analysewerkzeugen können Sie zudem individuelle Dashboards und Berichte erstellen, Engpässe erkennen und die Verfügbarkeit im Zeitverlauf überwachen.
Zu den Integrationen von Icinga gehören unter anderem Grafana, AWS, Azure, Puppet, Ansible, Chef, Terraform, Jira, PagerDuty, ServiceNow, BigPanda und Stackstorm.
Pros and Cons
Pros:
- Hochgradig anpassbar für verschiedenste IT-Infrastruktur-Anforderungen
- Skalierbar für kleine und große Umgebungen
- Kostenlos nutzbar, keine Einrichtungsgebühren
Cons:
- Einrichtung und Konfiguration mit Lernkurve verbunden
- Gelegentliche Performanceprobleme bei hoher Auslastung berichtet
New Product Updates from Icinga
Icinga Web Adds PHP 8.5 Support and New Packages
Icinga Web introduces PHP 8.5 support, icinga/zf1 and icinga-php-legacy packages, and module updates. These changes improve compatibility, modernize the codebase, and enhance overall system stability. For more information, visit Icinga's official site.
 .
.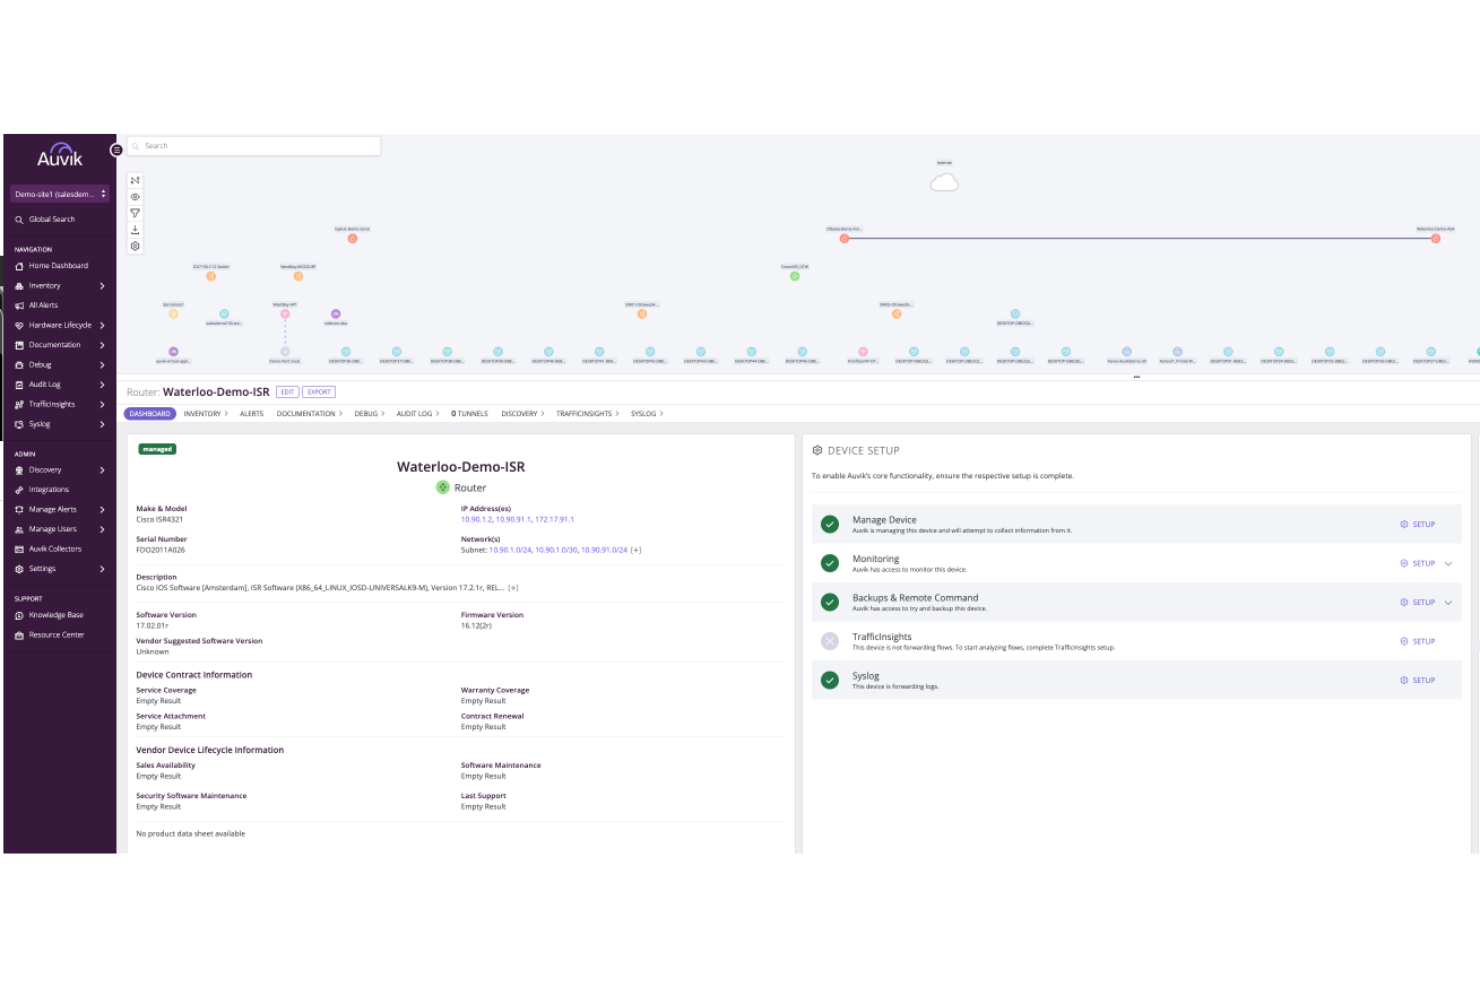
Auvik ist eine Netzwerkmanagement-Plattform, die die Sichtbarkeit und Leistung Ihres Netzwerks verbessert. Sie bietet Überwachungstools, mit denen Sie Ihr Netzwerk im Blick behalten und einen reibungslosen Betrieb sicherstellen können.
Warum ich Auvik ausgewählt habe: Einer der Gründe, warum ich Auvik als eines der besten Überwachungstools ausgewählt habe, ist die Fähigkeit zur Echtzeit-Überwachung von Geräten. Mit dieser Funktion können Sie den Zustand Ihres Netzwerks ständig überwachen und Probleme sofort erkennen und beheben, sobald sie auftreten. Eine weitere überzeugende Funktion ist das automatisierte Netzwerk-Mapping, das die Struktur und Verbindungen Ihres Netzwerks visuell darstellt. Dies hilft Ihnen, das Zusammenspiel der einzelnen Geräte besser zu verstehen und erleichtert das Management und die Fehlersuche. Ein weiteres herausragendes Merkmal ist die Nachverfolgung von Leistungskennzahlen. So gewinnen Sie wertvolle Daten über die Netzwerkleistung und können fundierte Entscheidungen zur Optimierung treffen. Die Plattform bietet zudem anpassbare Benachrichtigungen, die Sie bei potenziellen Problemen warnen, sodass Sie eingreifen können, bevor sich diese verschärfen.
Hervorstechende Funktionen & Integrationen:
Die Funktionen umfassen Konfigurations-Backups, die sicherstellen, dass Sie keine wichtigen Einstellungen verlieren, Remote-Geräteverwaltung, mit der Sie Geräte von überall steuern können, sowie globale Alarm-Einstellungen für einheitliche Überwachung im gesamten Netzwerk. Diese Funktionen arbeiten zusammen und bieten eine umfassende Lösung für die Verwaltung und Überwachung Ihres Netzwerks.
Integrationen umfassen Cisco, Datto, Microsoft Intune, Slack, ServiceNow, ConnectWise, Dell, Fortinet, Palo Alto Networks, Cisco Meraki, Okta und Jamf.
Pros and Cons
Pros:
- Echtzeit-Transparenz der Netzwerkleistung
- Automatisierte Netzwerk-Erkennung und -Abbildung
- Konfigurations-Backups und automatischer Vergleich
Cons:
- Preisinformationen nicht öffentlich verfügbar
- Eingeschränkte Offline-Verwaltungsmöglichkeiten
New Product Updates from Auvik
Auvik Adds HA Pair Monitoring, Improves Ping Alerts, & Expands SaaS Integrations
Auvik introduces HA Pair Monitoring for Fortinet firewalls, improved Service Status alerts for Internal Ping Checks, and new SaaS integrations with ServiceNow, GitLab, ClickUp, and Notion. These updates improve network monitoring visibility and provide better insights into SaaS license usage. For more information, visit Auvik’s official site.
 .
.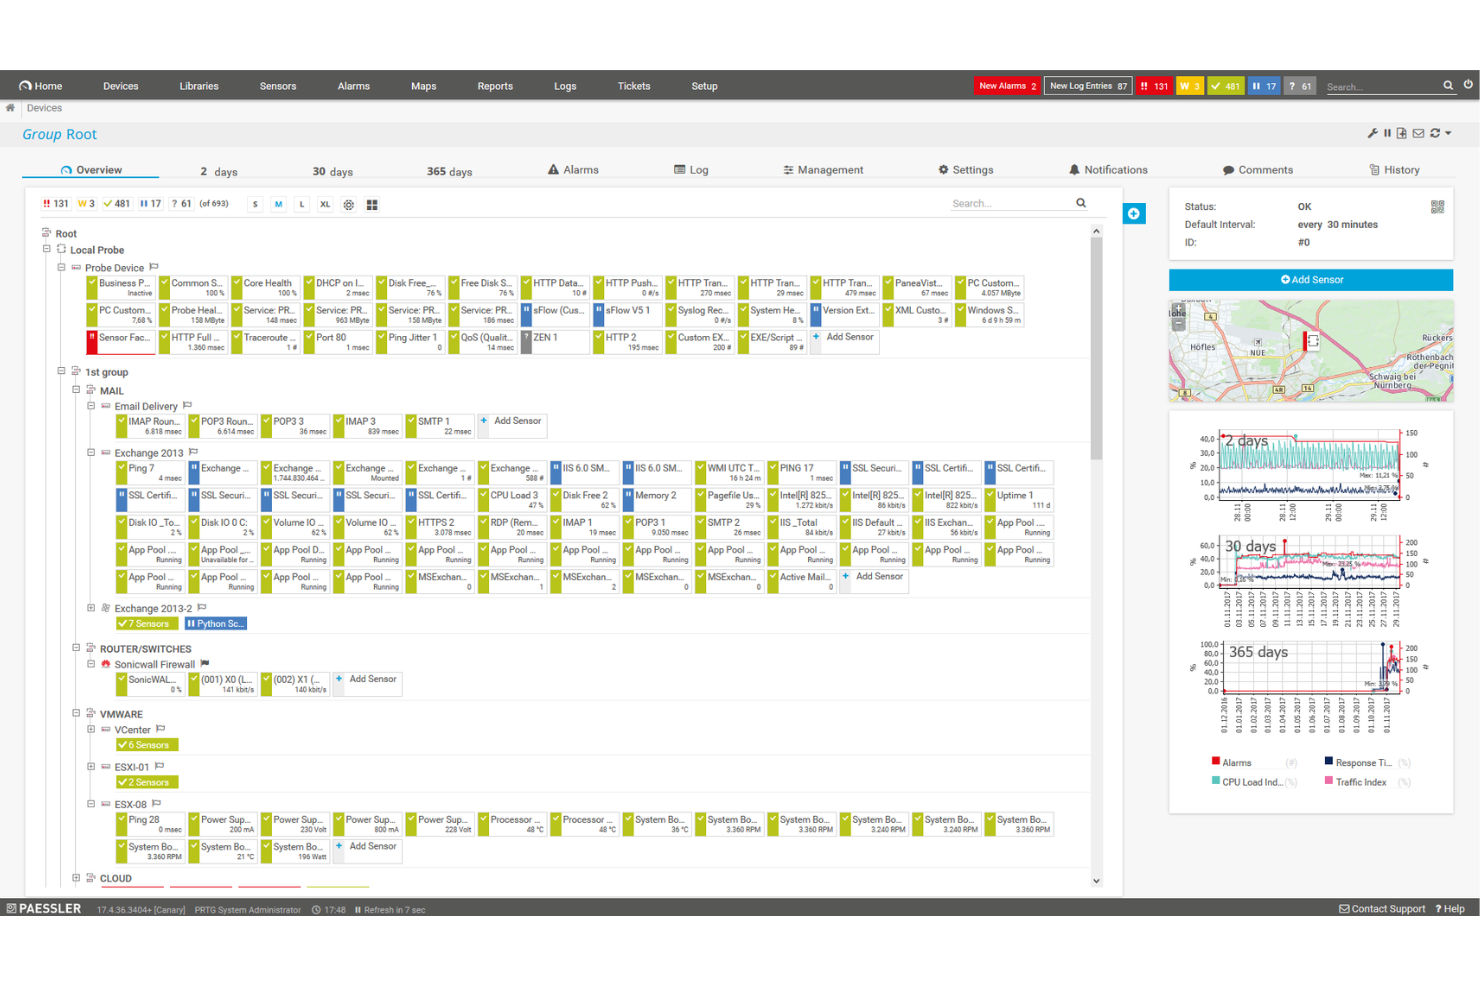
PRTG Network Monitor ist ein umfassendes Tool, das Ihnen hilft, Ihre gesamte IT-Infrastruktur im Blick zu behalten. Es überwacht Systeme, Geräte, Datenverkehr und Anwendungen und liefert Ihnen Echtzeiteinblicke in den Zustand Ihres Netzwerks. Mit PRTG können Sie Probleme erkennen und beheben, bevor sie kritisch werden.
Warum ich PRTG ausgewählt habe: Ich habe PRTG wegen seiner Fähigkeit gewählt, die Überwachung verschiedener Technologien durch integrierte Protokolle wie SNMP, WMI, SSH und mehr zu vereinheitlichen. Das bedeutet, dass Sie eine breite Palette von Plattformen, Geräten und Systemen in Ihrem Netzwerk überwachen können, um sicherzustellen, dass alle Komponenten ordnungsgemäß funktionieren. Darüber hinaus bietet PRTG anpassbare Berichte, sodass Sie detaillierte Berichte nach Ihren Bedürfnissen erstellen können. Ein weiterer wichtiger Aspekt von PRTG ist das Echtzeit-Benachrichtigungssystem. Sie erhalten sofortige Benachrichtigungen über mögliche Probleme, sodass Sie schnell reagieren und Ausfallzeiten minimieren können.
Hervorstechende Funktionen & Integrationen:
Weitere wichtige Funktionen sind detaillierte Statistiken über Anwendungen, die in Ihrem Netzwerk laufen, um Ressourcen effektiv zu verwalten. Außerdem ermöglicht die verteilte Überwachungsfunktion die Überwachung mehrerer Netzwerke an verschiedenen Standorten – alles über eine einzige Benutzeroberfläche. Es gibt zudem Echtzeit-Karten und Dashboards, die den Netzwerkstatus visualisieren und so die Erkennung und Behebung von Problemen erleichtern. Zu den Integrationen zählen AWS, Cisco, Dell Technologies, HPE, VMware, ServiceNow, Check Point, Sonicwall, NetApp, Fujitsu, Lansweeper und Martello.
Pros and Cons
Pros:
- Bietet einen umfassenden Überblick über die Netzwerkinfrastruktur
- Anpassbare Dashboards und Echtzeit-Benachrichtigungen
- Unterstützt verschiedene Überwachungstechnologien
Cons:
- Die Ersteinrichtung kann zeitaufwändig sein
- Die Lizenzierung auf Sensorbasis kann bei größeren Netzwerken teuer werden
New Product Updates from PRTG
PRTG Introduces New Monitoring Sensors In Beta
This week, PRTG introduces three BETA sensors that broaden your monitoring scope for Proxmox VE clusters and SIMATIC S7-300/400 PLCs, giving you deeper operational insights. For more information, visit PRTG’s official site.
 .
.Am besten geeignet für Performance-Tracking in Echtzeit
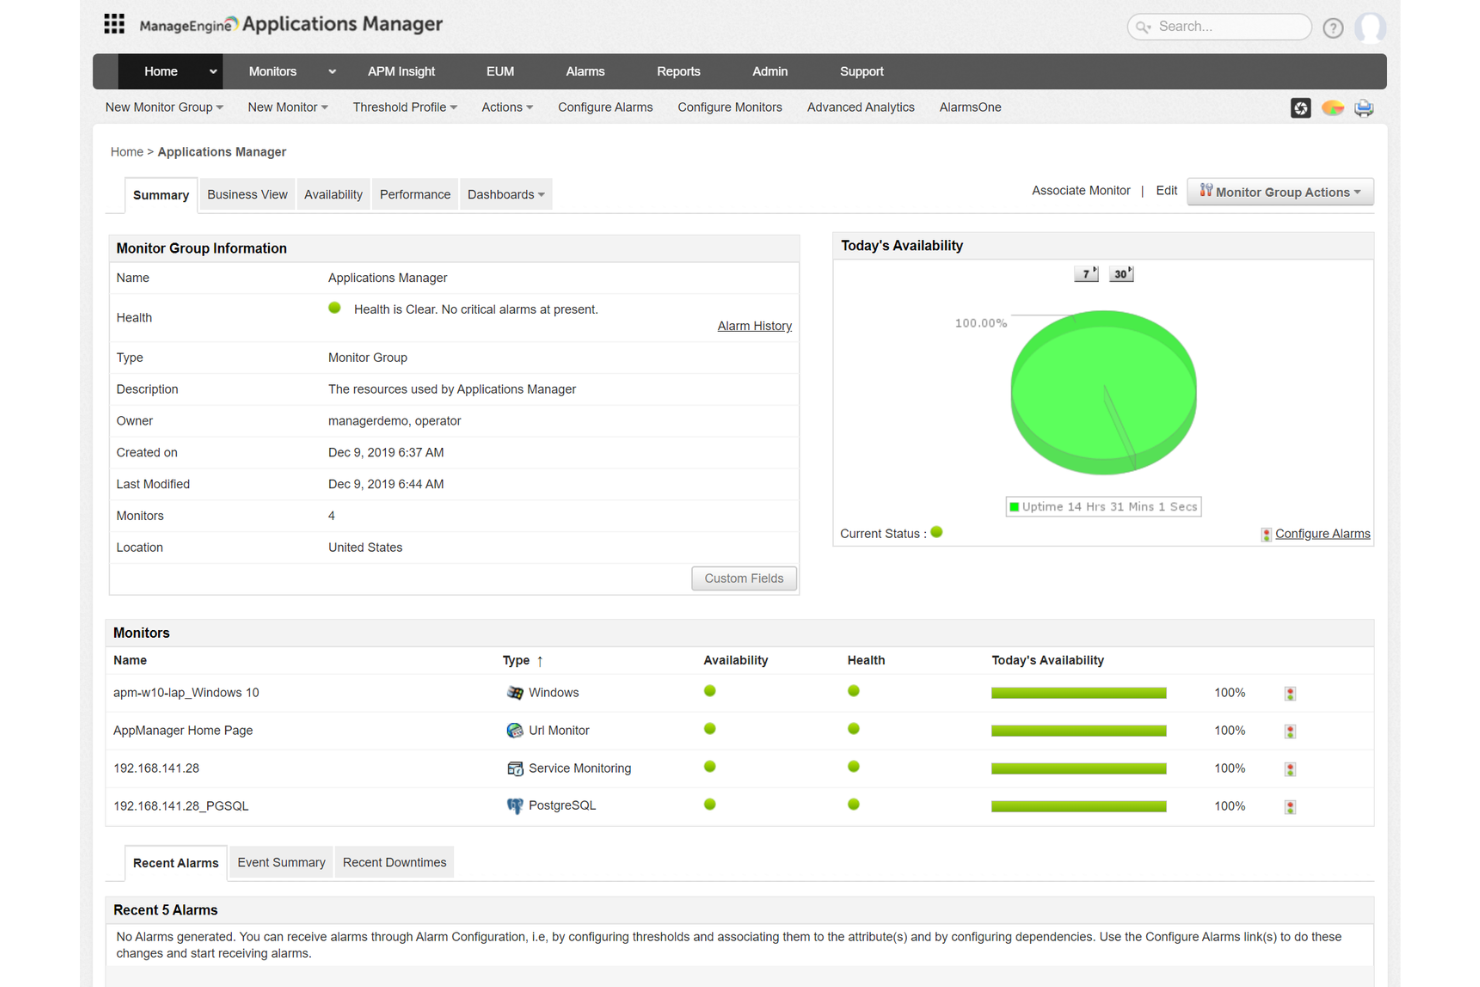
ManageEngine Applications Manager ist ein Tool, das Ihnen hilft, die Leistung Ihrer Anwendungen und IT-Infrastruktur zu überwachen. Es behält verschiedene Komponenten wie Server, Datenbanken und Cloud-Dienste im Blick, um sicherzustellen, dass sie reibungslos laufen. Dadurch kann Ihr Team Probleme erkennen und beheben, bevor sie die Nutzer beeinträchtigen.
Warum ich ManageEngine Applications Manager ausgewählt habe: Ein Grund für die Wahl von ManageEngine Applications Manager ist die Fähigkeit, eine Vielzahl von Technologien zu überwachen. Es unterstützt über 150 Technologien, darunter Anwendungsserver, Datenbanken und Cloud-Plattformen. Das bedeutet, Sie können Ihre gesamte IT-Umgebung über eine zentrale Konsole überwachen, was es einfacher macht, potenzielle Probleme zu erkennen und zu beheben. Ein weiteres nützliches Feature ist das Echtzeit-Performance-Tracking. Das Tool liefert Einblicke in Metriken wie CPU- und Speicherverbrauch, Antwortzeiten und Transaktionsdetails. Mit diesen Informationen kann Ihr Team Leistungsengpässe schnell identifizieren und Korrekturmaßnahmen ergreifen, um eine optimale Anwendungsleistung sicherzustellen.
Herausragende Funktionen & Integrationen:
Zu den Funktionen gehört synthetisches Transaktionsmonitoring, mit dem Sie Benutzerinteraktionen mit Ihren Anwendungen simulieren können, um potenzielle Probleme zu identifizieren, bevor sie echte Nutzer beeinträchtigen. Außerdem liefert das Real-User-Monitoring Einblicke in die tatsächlichen Erlebnisse Ihrer Nutzer, sodass Sie verstehen, wie Ihre Anwendungen unter realen Bedingungen funktionieren.
Zu den Integrationen gehören ManageEngine ServiceDesk Plus, ServiceNow, Site24x7, AlarmsOne, Slack, Prometheus, AWS, Google Cloud, Microsoft Azure, Oracle und MySQL.
Pros and Cons
Pros:
- Vereinfacht die Verwaltung von Anwendungen und deren Beziehungen
- Echtzeit-Benachrichtigungssystem hilft Teams, schnell auf Probleme zu reagieren
- Überwacht eine Vielzahl von Anwendungen und Infrastrukturkomponenten
Cons:
- Das Tool kann ressourcenintensiv sein
- Die Einrichtung des Tools zur Erfüllung spezifischer Anforderungen kann herausfordernd sein
New Product Updates from ManageEngine Applications Manager
ManageEngine Applications Manager Adds Veeam Monitoring
ManageEngine Applications Manager adds Veeam Enterprise Manager monitoring. This update enables tracking of backup infrastructure, job performance, and storage usage. For more information, visit ManageEngine’s official site.
 .
.Sentry
Am besten geeignet für Echtzeit-Fehlerverfolgung in Anwendungen
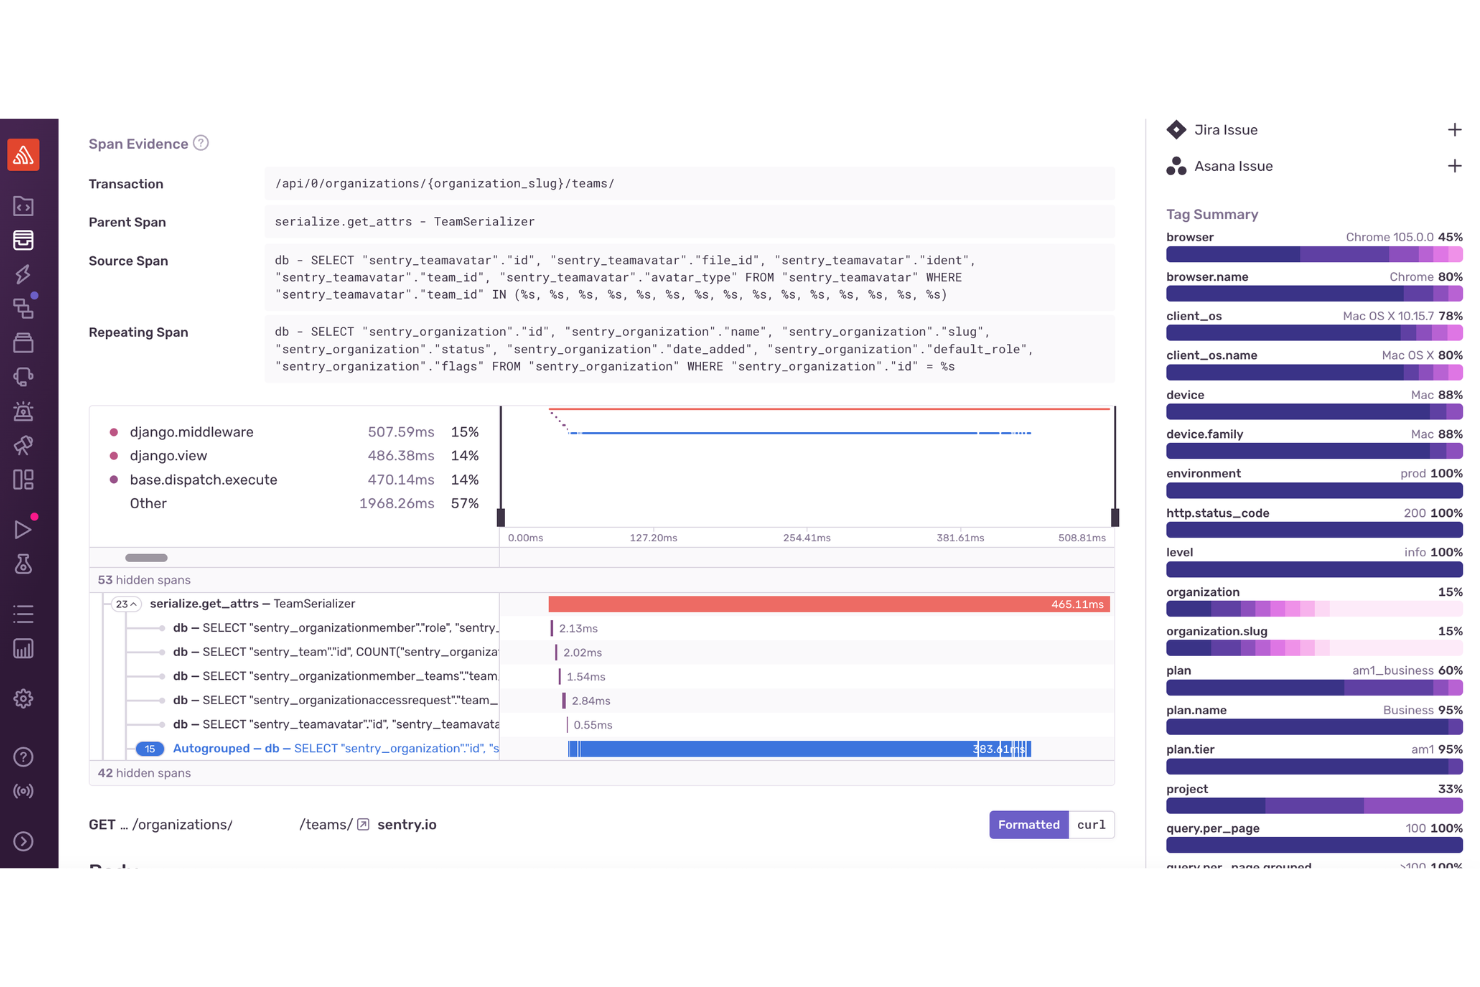
Für Entwickler und Unternehmen, die ein Monitoring-Tool suchen, das sofortige Einblicke in die Anwendungsleistung und Fehler bietet, erweist sich Sentry als umfassende Lösung. Besonders für Web- und Mobile-Entwicklung, E-Commerce und Enterprise-Bereiche ist Sentry interessant, da es den entscheidenden Bedarf an Echtzeit-Fehlerverfolgung und Leistungsoptimierung in Phasen hoher Auslastung abdeckt.
Warum ich Sentry ausgewählt habe
Ich habe Sentry aufgrund seiner leistungsstarken Fehlerüberwachung und Performance-Tracking-Funktionen ausgewählt. Das Tool überzeugt durch Echtzeit-Fehlerverfolgung, bei der Ihr Team sofort über Probleme informiert wird und so eine schnelle Lösung ermöglicht. Die verteilte Trace-Funktion von Sentry ermöglicht eine detaillierte Ansicht der Transaktionsleistung, sodass Sie langsame Vorgänge erkennen und optimieren können. Darüber hinaus bietet die Sitzungswiederholung eine visuelle Kontextunterstützung beim Debugging, was das Verständnis für Nutzerinteraktionen erleichtert und eine effektive Behebung von Problemen ermöglicht.
Wichtige Funktionen von Sentry
Neben der Echtzeit-Fehlerverfolgung in Anwendungen bietet Sentry:
- Absturzberichte für mobile Apps: Liefert Einblicke in App-Abstürze mit detaillierten Stack Traces.
- Gaming-Analysen: Bietet Performance-Monitoring speziell für Gaming-Anwendungen, hebt Latenz- und Framerate-Probleme hervor.
- KI-Code-Überprüfung: Nutzt KI, um potenzielle Lösungen für erkannte Probleme vorzuschlagen und so den Debugging-Prozess zu beschleunigen.
- Sicherheit und Compliance: Gewährleistet den Schutz von Nutzerdaten durch branchenübliche Sicherheitsmaßnahmen und ist dadurch auch für besonders sensible Anwendungen geeignet.
Sentry-Integrationen
Sentry bietet eine große Auswahl an nativen Integrationen zur Steigerung der Workflow-Effizienz, darunter GitHub, Bitbucket, GitLab, Slack, Microsoft Teams, Jira, Asana, Trello, Datadog und PagerDuty.
Pros and Cons
Pros:
- Verteiltes Tracing zeigt Einblicke in die Leistungswerte auf Transaktionsebene
- Fortschrittliche Fehlergruppierung hilft, Probleme schnell zu priorisieren und zu beheben
- Bietet Echtzeit-Fehlerverfolgung für Web-, Mobile- und Backend-Apps
Cons:
- Nicht alle Integrationen sind nativ verfügbar, einige erfordern Drittanbieter-APIs
- Begrenzte Benachrichtigungen und Einblicke in Anwendungen bei niedrigeren Tarifstufen
New Product Updates from Sentry

Sentry Enhances Alerting Across Uptime and Metrics
Sentry introduces expanded alert configuration for Uptime Monitors and adds alerting support to its Metrics open beta. These updates improve issue detection by enabling more flexible monitoring conditions and proactive alerts. For more information, visit Sentry’s official site.
 .
.Gut für die Datenbankgesundheitsüberwachung in Echtzeit
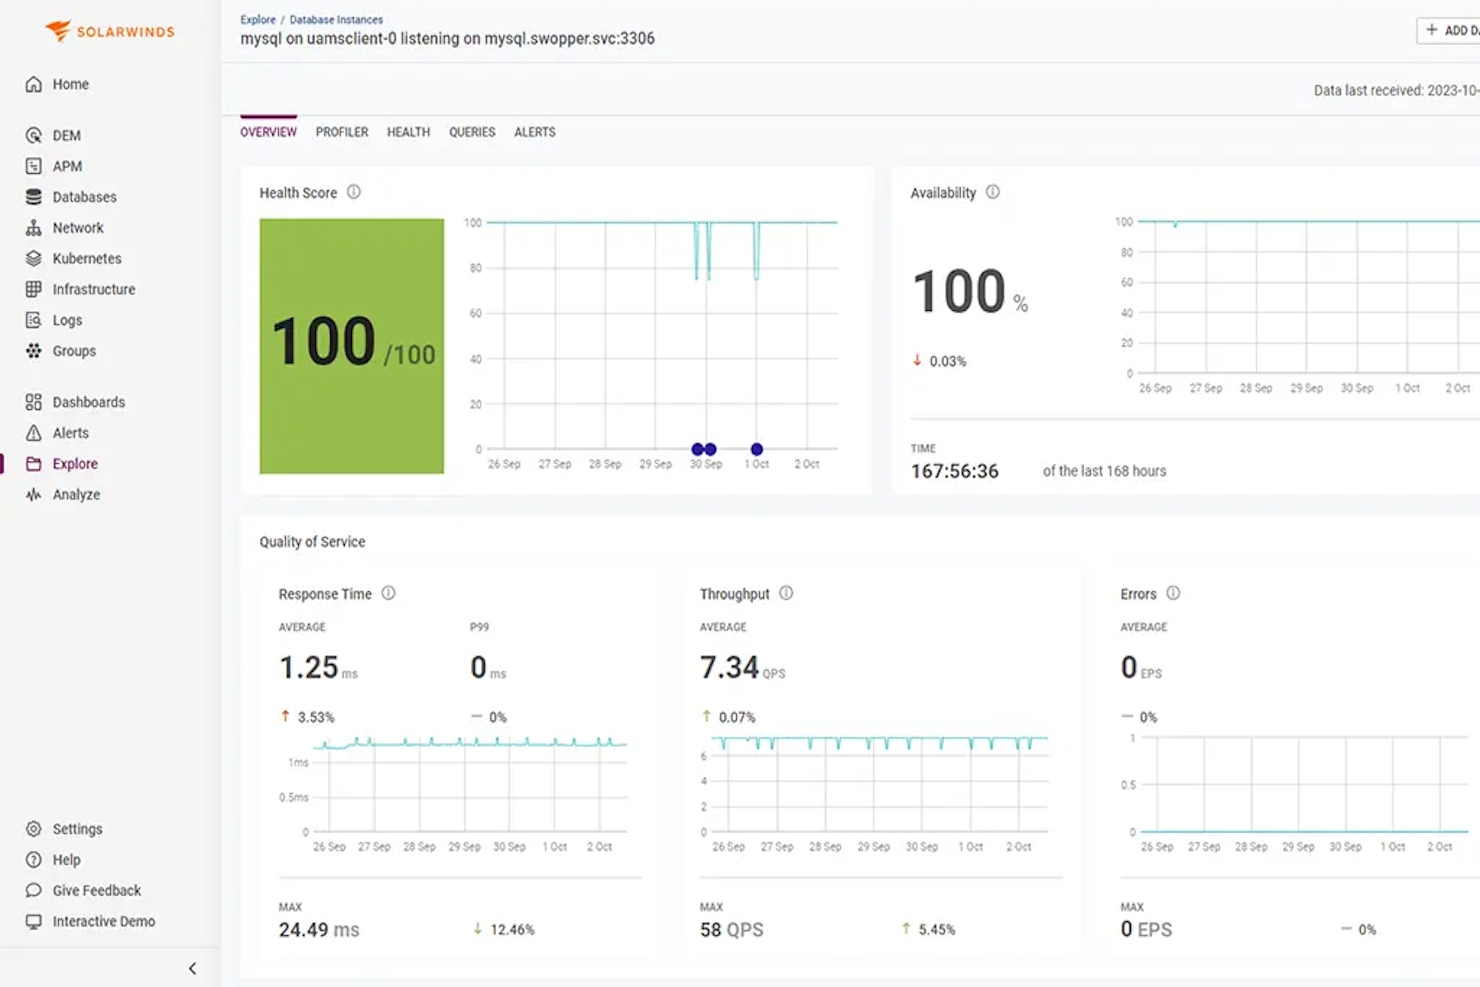
SolarWinds Observability SaaS ist eine Überwachungsplattform für DevOps-, IT-Betriebs- und Cloud-Betriebsteams. Sie bietet Echtzeiteinblicke in die Anwendungs- und Infrastrukturleistung. Durch die Integration von Funktionen wie Anwendungsabsturzüberwachung und Datenbank-Gesundheitsprüfungen ermöglicht sie Teams, ihre IT-Umgebungen proaktiv zu verwalten und die Leistung zu optimieren, was letztlich das Nutzererlebnis verbessert.
Warum ich SolarWinds Observability SaaS ausgewählt habe
Ich habe SolarWinds Observability SaaS aufgrund seiner Funktion zur Überwachung der Datenbankgesundheit in Echtzeit ausgewählt, die besonders für Teams nützlich ist, die ihre Datenbankleistung ständig im Blick behalten müssen. Diese Funktion ermöglicht es, Einblicke in Datenbankoperationen zu erhalten und so sicherzustellen, dass diese reibungslos und effizient ablaufen. Zudem ist der Anwendungsabsturz-Monitor äußerst wertvoll, um potenzielle Probleme zu erkennen, bevor sie die Produktion beeinträchtigen, und bietet somit ein Sicherheitsnetz für Ihre Anwendungen. Diese Merkmale machen die Lösung zu einer soliden Wahl für Unternehmen, die Wert auf Verfügbarkeit und Zuverlässigkeit ihrer IT-Infrastruktur legen.
SolarWinds Observability SaaS Hauptfunktionen
Ich habe auch mehrere weitere Funktionen gefunden, die Ihre Überwachungsmaßnahmen aufwerten:
- Code-Bereitstellungsüberwachung: Bewertet die Auswirkungen neuer Code-Releases und hilft Ihrem Team, mögliche Probleme frühzeitig zu erkennen.
- Kubernetes-Überwachung: Optimiert Bereitstellungsprozesse und stellt sicher, dass Ihre containerisierten Anwendungen reibungslos laufen.
- Ressourcenüberwachung: Verfolgt CPU- und Speicherverbrauch für wichtige Infrastrukturdaten und liefert Einblicke in die Ressourcenauslastung.
- NoSQL-Datenbanküberwachung: Verbessert die Fehlerbehebung, indem sie spezifische Einblicke in die Leistung von NoSQL-Datenbanken bietet.
SolarWinds Observability SaaS Integrationen
Zu den Integrationen gehören Kubernetes, Amazon EC2, DynamoDB, Azure Virtual Machines, Google Compute Engine, Google Cloud Storage, Slack, Microsoft Teams und mehr.
Pros and Cons
Pros:
- Überwachung von Codebereitstellungen ermöglicht frühzeitige Fehlererkennung bei Releases
- NoSQL-Datenbanküberwachung verbessert die Genauigkeit der Fehlerbehebung
- Automatisierte Anomalieerkennung reduziert manuellen Überwachungsaufwand
Cons:
- Dashboard-Konfiguration kann für einige Nutzer komplex sein
- Berichtsfunktionen erfüllen möglicherweise nicht alle Nutzererwartungen
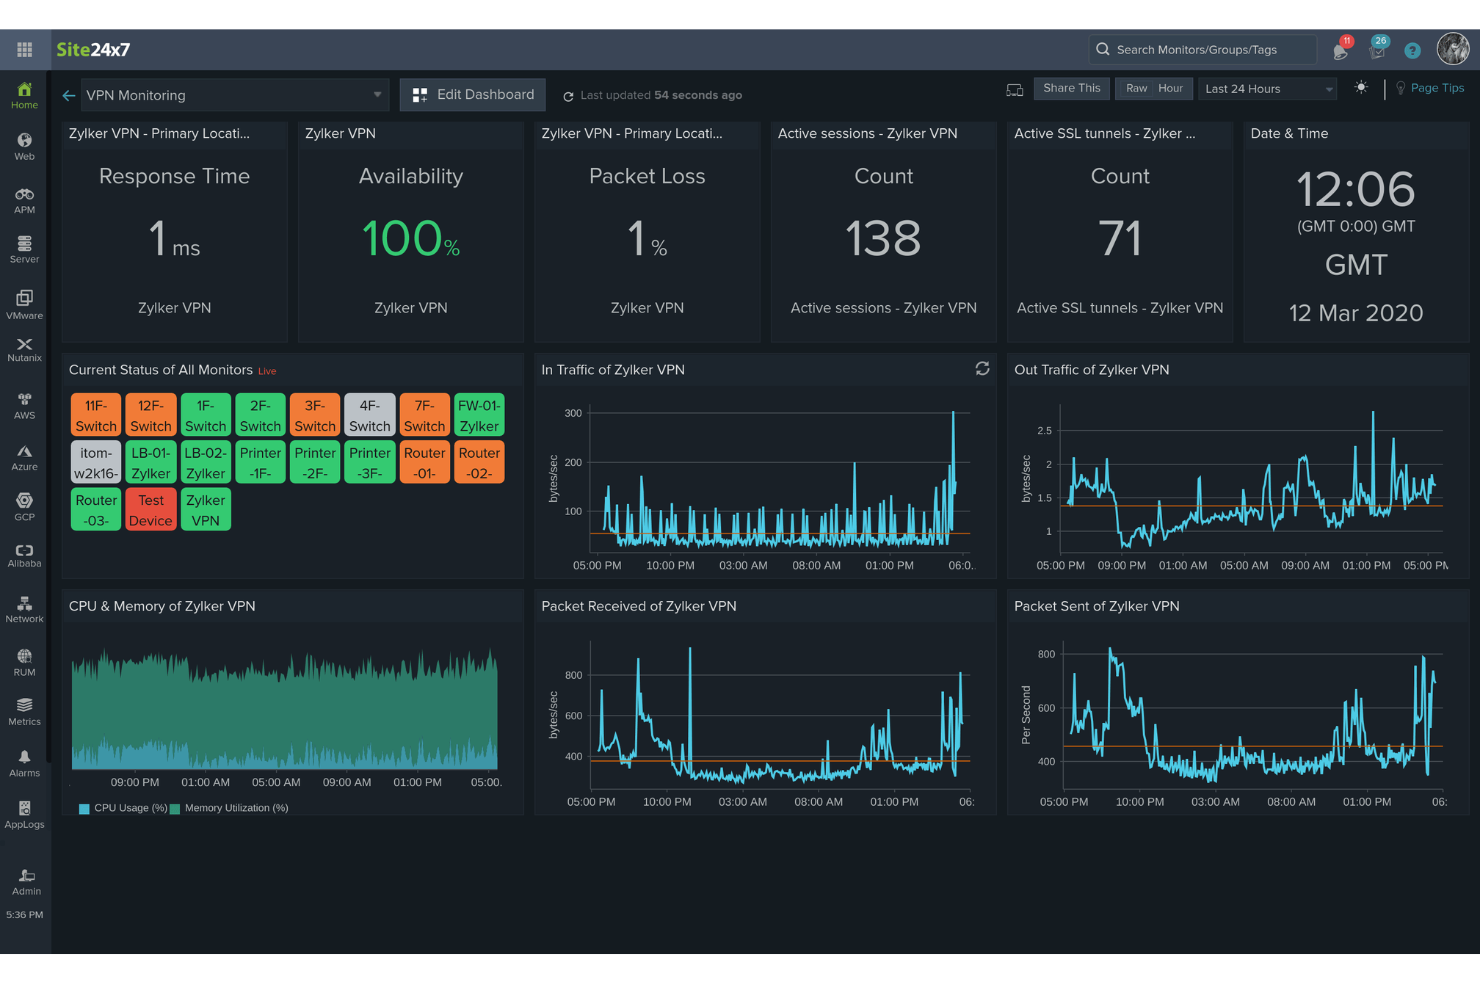
Site24x7 ist eine cloudbasierte Überwachungslösung, die für DevOps- und IT-Betriebsteams entwickelt wurde. Sie bietet umfassende Überwachungsmöglichkeiten für Websites, Server, Anwendungen und Netzwerkgeräte und liefert Einblicke in Echtzeit in Leistung und Verfügbarkeit.
Warum ich Site24x7 ausgewählt habe: Ich schätze Site24x7 besonders wegen seines leistungsstarken Application Performance Monitoring (APM). Es unterstützt verschiedene Programmiersprachen, darunter Java, .NET, Ruby, PHP und Node.js. Ein weiteres bemerkenswertes Merkmal ist das Real User Monitoring (RUM) von Site24x7. Diese Funktion ermöglicht die Analyse der tatsächlichen Benutzererfahrung beim Interagieren mit Ihrer Website oder Ihren Webanwendungen. Indem Sie Leistungsdaten nach Browser, Plattform, geografischer Region und mehr segmentieren, erhalten Sie wertvolle Einblicke, wie verschiedene Faktoren die Benutzererfahrung beeinflussen und können fundierte Entscheidungen zur Optimierung treffen. Insgesamt helfen diese Funktionen dabei, verschiedene Komponenten Ihrer IT-Infrastruktur proaktiv zu überwachen.
Herausragende Funktionen & Integrationen:
Weitere Funktionen sind die synthetische Webtransaktionsüberwachung, mit der Sie mehrstufige Benutzerinteraktionen in einem echten Browser aufzeichnen und simulieren können, wodurch sich wichtige Benutzerreisen wie Login-Formulare und Warenkörbe optimieren lassen. Darüber hinaus ermöglicht das Log-Management von Site24x7 das Zusammenführen und Indizieren von Protokollen aus unterschiedlichen Quellen und unterstützt so eine effiziente Fehlersuche und Problembehebung.
Zu den Integrationen gehören ServiceNow, PagerDuty, Opsgenie, Jira, ManageEngine AlarmsOne, ManageEngine ServiceDesk Plus, Slack, Microsoft Teams, Zoho Cliq, Amazon EventBridge, Zapier und Webhooks.
Pros and Cons
Pros:
- Flexible Anpassungsmöglichkeiten für Dashboards und Berichte
- Zuverlässige Echtzeit-Benachrichtigungen ermöglichen eine schnelle Problemlösung
- Umfassende Überwachungsfunktionen für verschiedene Komponenten der IT-Infrastruktur
Cons:
- Eingeschränkte Integrationsmöglichkeiten mit bestimmten Drittanbietertools
- Die Konfiguration kann für neue Benutzer komplex sein
New Product Updates from Site24x7

Site24x7 Enhances Network Monitoring With Device and Visibility Updates
Site24x7 introduces proactive hardware health monitoring, expanded device support, centralized network controls, and enhanced SD-WAN visualization to improve network monitoring and management. For more information, visit Site24x7’s official site.
 .
.Am besten geeignet für vollständiges Netzwerkmanagement
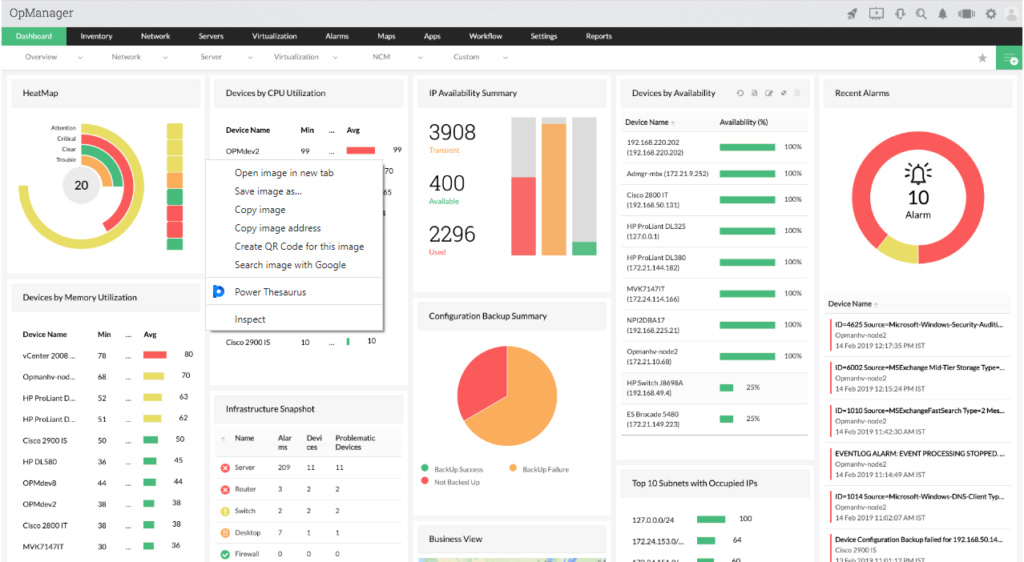
ManageEngine OpManager ist ein leistungsstarkes Tool, das sich auf einen integrierten Ansatz zur Netzwerkverwaltung spezialisiert hat. Es bietet Funktionen, die von der Überwachung der Netzwerkleistung bis zur Automatisierung von Netzwerkkonfigurationen reichen und eignet sich somit perfekt als Lösung für ein umfassendes Netzwerkmanagement.
Warum ich ManageEngine OpManager ausgewählt habe: Bei der Auswahl eines Tools für ganzheitliches Netzwerkmanagement stand ManageEngine OpManager an der Spitze meiner Bewertungen. Sein einzigartiges Funktionspaket richtet sich speziell an diejenigen, die eine ganzheitliche Sicht auf den Betrieb und den Zustand ihres Netzwerks suchen.
Auf Basis dieser Einschätzungen bin ich zu der Meinung gelangt, dass ManageEngine OpManager am besten für komplette Netzwerkverwaltungsaufgaben geeignet ist.
Herausragende Funktionen & Integrationen:
OpManager zeichnet sich durch seine Überwachungsfunktionen für physische und virtuelle Server aus. Das Netzwerk-Konfigurationsmanagement ermöglicht Administratoren das Sichern, Wiederherstellen und Automatisieren von Aufgaben und bietet damit Sicherheit bei Konfigurationsfehlern.
Im Integrationsbereich unterstützt ManageEngine OpManager die Anbindung an beliebte ITOM-Lösungen und Drittanbieter-IT-Management-Apps und erweitert damit seinen Funktionsumfang.
Pros and Cons
Pros:
- Unterstützt sowohl die Überwachung von physischen als auch von virtuellen Servern.
- Bietet eine umfassende Suite für Netzwerk-Konfigurationsmanagement.
- Umfangreiche Integrationsmöglichkeiten mit anderen IT-Management-Lösungen.
Cons:
- Für Anfänger könnte die Einarbeitung anspruchsvoll sein.
- Die Vielzahl an Funktionen kann für kleine Unternehmen überwältigend sein.
- Lizenzierungsmodell ist nicht für alle Unternehmenstypen optimal.
New Product Updates from ManageEngine OpManager
ManageEngine OpManager Vendor Templates and NCM XML Import
ManageEngine OpManager introduces enhanced vendor template integration and device template import for the NCM module using XML files. This update helps teams improve device classification and speed up configuration workflows. For more information, visit ManageEngine OpManager’s official site.
 .
.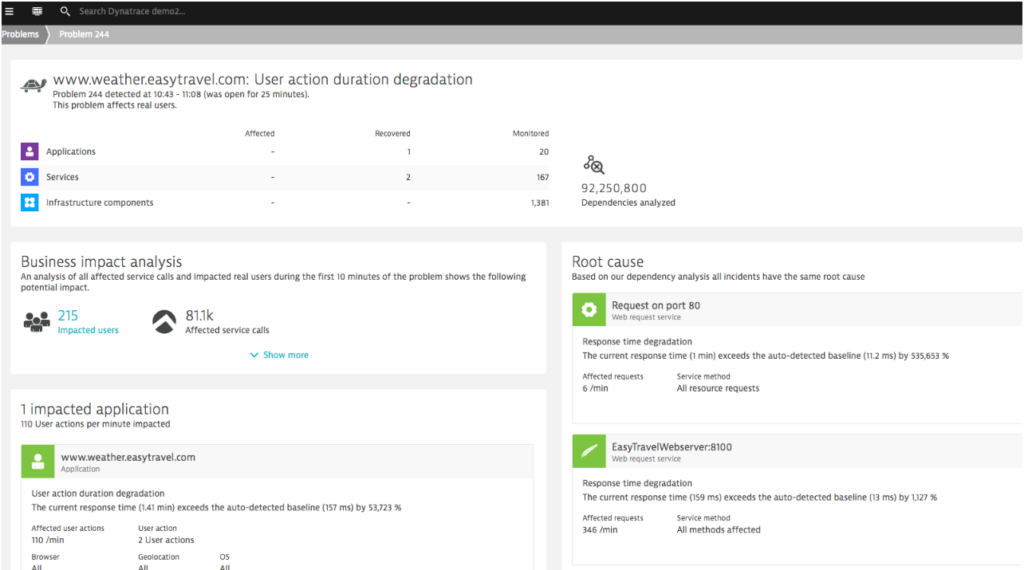
Dynatrace ist ein Performance-Monitoring-Tool, das entwickelt wurde, um das gesamte digitale Ökosystem zu überwachen. Seine ausgefeilten KI-Funktionen ermöglichen es, nicht nur zu überwachen, sondern auch proaktiv Anomalien innerhalb eines Systems zu identifizieren.
Dieser besondere Fokus auf KI-gesteuerte Erkenntnisse macht es besonders geeignet für diejenigen, die nach einer Lösung zur Anomalieerkennung suchen.
Warum ich Dynatrace gewählt habe: Bei meiner Suche nach Überwachungslösungen hat Dynatrace meine Aufmerksamkeit durch seinen ausgeprägten Schwerpunkt auf KI gewonnen. Die Entscheidung, es auszuwählen, wurde beeinflusst davon, wie seine einzigartigen KI-Fähigkeiten eine schnelle Erkennung von Anomalien ermöglichen und häufig Probleme erkennen, bevor sie eskalieren.
Mein Urteil nach dem Vergleich verschiedener Tools ließ mich glauben, dass Dynatrace in seinem Angebot zur KI-gestützten Anomalieerkennung unübertroffen ist.
Herausragende Funktionen & Integrationen:
Dynatrace bietet Echtzeit-Anomalieerkennung und Ursachenbestimmung, Eigenschaften, die für eine schnelle Problemlösung unerlässlich sind. Das Full-Stack-Monitoring, vom Anwendungsbereich bis zur Infrastruktur, sorgt für eine umfassende Abdeckung.
Was die Integrationen betrifft, so verbindet sich Dynatrace mit Cloud-Plattformen, CI/CD-Tools und wichtigen IT-Betriebsplattformen, was es anpassbar an verschiedene IT-Umgebungen macht.
Pros and Cons
Pros:
- Fortschrittliche KI-Funktionen für Echtzeit-Anomalieerkennung.
- Umfassende Full-Stack-Überwachung.
- Umfangreiche Integrationsmöglichkeiten mit führenden Cloud- und IT-Betriebsplattformen.
Cons:
- Kann komplex sein für Nutzer ohne Vorkenntnisse im Bereich KI-gesteuerter Tools.
- Die Vielzahl an Funktionen könnte dedizierte Schulungen erfordern.
- Der Mangel an transparenter Preisgestaltung kann für einige potenzielle Nutzer abschreckend sein.
Weitere Monitoring-Tools
Nachfolgend findest du eine Liste weiterer Monitoring-Tools, die ich zwar auf die Shortlist gesetzt, aber nicht in die Top 10 aufgenommen habe. Sie sind dennoch definitiv einen Blick wert.
- Datadog
Am besten geeignet für Monitoring im Cloud-Maßstab
- New Relic
Am besten geeignet für Einblicke in die Anwendungsleistung
- Nagios XI
Am besten für umfassende Infrastrukturüberwachung geeignet
- Prometheus
Am besten geeignet für Echtzeit-Alarmierung und multidimensionale Datenerfassung
- Micro Focus SiteScope
Am besten geeignet für agentenlose Anwendungsüberwachung
- Sensu
Am besten geeignet für flexible Monitoring-Workflows
- Observium
Am besten geeignet für Netzwerk- und Server-Hardware-Gesundheitsprüfungen
- Checkmk
Am besten für ganzheitliche Monitoring-Lösungen geeignet
- Dotcom Monitor
Am besten geeignet für mehrstufige Skripterstellung


Kriterien für die Auswahl von Monitoring-Tools
Bei der Auswahl der besten Monitoring-Tools für diese Liste habe ich typische Bedürfnisse und Probleme von Käufern berücksichtigt, zum Beispiel Skalierbarkeit und einfache Integration. Außerdem habe ich das folgende Framework genutzt, um die Bewertung strukturiert und fair zu halten:
Kernfunktionen (25 % der Gesamtwertung)
Um in diese Liste aufgenommen zu werden, musste jede Lösung folgende häufige Anwendungsfälle abdecken:
- Systemleistung überwachen
- Echtzeit-Alarme bereitstellen
- Verfügbarkeit von Anwendungen verfolgen
- Netzwerkverkehr analysieren
- Detaillierte Berichte erzeugen
Zusätzliche herausstechende Funktionen (25 % der Gesamtwertung)
Um das Feld weiter einzugrenzen, habe ich gezielt nach besonderen Eigenschaften gesucht, wie zum Beispiel:
- Vorhersage-Analysen
- Anpassbare Dashboards
- KI-gestützte Erkenntnisse
- Multi-Cloud-Support
- Automatisierte Ursachenanalyse
Benutzerfreundlichkeit (10 % der Gesamtwertung)
Um den Bedienkomfort der jeweiligen Systeme zu beurteilen, habe ich Folgendes betrachtet:
- Intuitive Benutzeroberfläche
- Einfache Navigation
- Geringe Einarbeitungszeit
- Anpassungsmöglichkeiten
- Übersichtliche Visualisierung
Onboarding (10 % der Gesamtwertung)
Um die Benutzerfreundlichkeit beim Einstieg in jede Plattform zu bewerten, habe ich Folgendes einbezogen:
- Verfügbarkeit von Schulungsvideos
- Interaktive Produkttouren
- Onboarding-Vorlagen
- Zugang zu Webinaren
- Unterstützende Chatbots
Kundenservice (10% der Gesamtbewertung)
Um die Kundendienstleistungen jedes Softwareanbieters zu bewerten, habe ich Folgendes berücksichtigt:
- Rund-um-die-Uhr-Support
- Live-Chat-Optionen
- Umfassende Wissensdatenbank
- Schnelle Reaktionszeiten
- Mehrsprachiger Support
Preis-Leistungs-Verhältnis (10% der Gesamtbewertung)
Um das Preis-Leistungs-Verhältnis jeder Plattform zu beurteilen, habe ich Folgendes berücksichtigt:
- Wettbewerbsfähige Preisgestaltung
- Flexible Abonnement-Modelle
- Inklusive Funktionen im Verhältnis zu den Kosten
- Rabatte bei jährlicher Abrechnung
- Verfügbarkeit von kostenlosen Testversionen oder Demos
Kundenbewertungen (10% der Gesamtbewertung)
Um ein Gefühl für die allgemeine Kundenzufriedenheit zu bekommen, habe ich bei der Durchsicht von Kundenbewertungen auf Folgendes geachtet:
- Stetig positives Feedback
- Erwähnung verlässlicher Leistung
- Lob für Benutzerfreundlichkeit
- Hervorgehobenes Preis-Leistungs-Verhältnis
- Positiv bewerteter Kundenservice
Wie wählt man Monitoring-Tools aus?
Es ist leicht, sich in langen Funktionslisten und komplexen Preisstrukturen zu verlieren. Damit Sie bei Ihrer individuellen Softwareauswahl stets den Überblick behalten, finden Sie hier eine Checkliste wichtiger Faktoren:
| Faktor | Worauf achten? |
|---|---|
| Skalierbarkeit | Kann das Tool mit Ihrem Unternehmen wachsen? Berücksichtigen Sie zukünftige Anforderungen und prüfen Sie, ob das Tool steigende Datenmengen und Nutzerzahlen ohne Performanceprobleme bewältigt. Flexible Skalierungsoptionen sind von Vorteil. |
| Integrationen | Lässt es sich mit Ihren bestehenden Systemen verbinden? Stellen Sie die Kompatibilität mit Ihrer aktuellen IT-Landschaft wie CRM, ERP oder Cloud-Diensten sicher, um teure Umwege zu vermeiden. |
| Anpassbarkeit | Können Sie das Tool an Ihre Arbeitsabläufe anpassen? Prüfen Sie, ob Dashboards, Benachrichtigungen und Berichte individuell auf die Prozesse und Anforderungen Ihres Teams zugeschnitten werden können. |
| Benutzerfreundlichkeit | Ist das Tool für Ihr Team intuitiv bedienbar? Bewerten Sie die Lernkurve und ob Ihr Team das Tool ohne aufwendige Schulungen schnell einsetzen kann. Achten Sie auf eine benutzerfreundliche Oberfläche. |
| Implementierung und Onboarding | Wie reibungslos läuft die Einrichtung ab? Berücksichtigen Sie Zeit- und Ressourcenaufwand für die Inbetriebnahme. Suchen Sie nach Anbietern mit umfassender Onboarding-Unterstützung und Hilfsmitteln. |
| Kosten | Passt das Preismodell zu Ihrem Budget? Vergleichen Sie den Preis des Tools mit den angebotenen Funktionen und Vorteilen. Achten Sie auf versteckte Gebühren oder zusätzliche Kosten für weitere Nutzer oder Funktionen. |
| Sicherheitsstandards | Schützt es Ihre Daten? Bewerten Sie die vorhandenen Sicherheitsmaßnahmen, z.B. Verschlüsselung und Einhaltung von Branchenstandards, damit Ihre Daten sicher bleiben. |
| Support-Verfügbarkeit | Ist Unterstützung bei Bedarf erreichbar? Prüfen Sie die angebotenen Support-Möglichkeiten wie 24/7-Hilfe, Live-Chat oder dedizierte Ansprechpartner, um sicherzustellen, dass bei Bedarf schnell Hilfe bereitsteht. |
Was sind Monitoring-Tools?
Monitoring-Tools sind Softwarelösungen, die Leistung und Zustand von Systemen, Netzwerken und Anwendungen überwachen. Sie werden von IT-Teams, DevOps-Ingenieuren und Systemadministratoren eingesetzt, um Probleme frühzeitig zu erkennen, Ausfallzeiten zu minimieren und einen reibungslosen Betrieb zu gewährleisten. Metrik-Tracking, Warnmeldungen und Dashboards helfen dabei, Trends zu erkennen, Probleme zu lösen und Teams auf dem Laufenden zu halten. Hardware-Monitoring-Software verschafft Teams die nötige Übersicht, um ihre Systeme ohne böse Überraschungen zu verwalten.
Funktionen
Achten Sie bei der Auswahl von Monitoring-Tools auf folgende Schlüsselfunktionen:
- Echtzeit-Benachrichtigungen: Benachrichtigen Sie Benutzer sofort, wenn Probleme auftreten, um eine schnelle Reaktion und Lösung zu ermöglichen.
- Anpassbare Dashboards: Passen Sie die Oberfläche an, um Metriken und Daten anzuzeigen, die für Ihr Team am wichtigsten sind.
- Integrationsmöglichkeiten: Verbinden Sie sich nahtlos mit bestehenden Systemen und Software, um einen einheitlichen Überblick über die Abläufe zu bieten.
- Automatisierte Ursachenanalyse: Identifizieren Sie die zugrunde liegende Ursache von Problemen ohne manuellen Aufwand – das spart Zeit und Mühe.
- Prädiktive Analysen: Sagen Sie potenzielle Probleme voraus, bevor sie auftreten, und helfen Sie so, die Systemstabilität zu erhalten.
- Skalierbarkeit: Passen Sie sich wachsenden Daten- und Benutzeranforderungen an, damit das Tool auch beim Unternehmenswachstum wirksam bleibt.
- Sicherheitsvorkehrungen: Schützen Sie vertrauliche Daten mit Verschlüsselung und der Einhaltung von Branchenstandards.
- Umfassendes Reporting: Erstellen Sie detaillierte Berichte, um Leistungstrends zu analysieren und fundierte Entscheidungen zu unterstützen.
- Multi-Cloud-Unterstützung: Überwachen Sie Anwendungen in verschiedenen Cloud-Umgebungen und erhalten Sie so einen umfassenden Überblick über die Abläufe.
- Benutzerfreundliche Oberfläche: Sorgen Sie für einfache Bedienbarkeit, sodass Teammitglieder das Tool effizient nutzen und sich gut zurechtfinden.
Vorteile
Die Implementierung von Monitoring-Tools zusammen mit Netzwerkkartierungs-Tools bietet Ihrem Team und Unternehmen zahlreiche Vorteile. Hier sind einige, auf die Sie sich freuen können:
- Verbesserte Systemleistung: Echtzeit-Benachrichtigungen und automatisierte Ursachenanalyse helfen, Probleme schnell zu beheben und Systeme reibungslos laufen zu lassen.
- Besser fundierte Entscheidungen: Umfassende Berichte und prädiktive Analysen bieten Einblicke für informierte Geschäftsentscheidungen.
- Höhere Effizienz: Anpassbare Dashboards und Integrationsmöglichkeiten sparen Zeit, indem sie relevante Daten in einem zugänglichen Format bereitstellen.
- Skalierbarkeit: Mit dem Unternehmenswachstum gewährleistet die Skalierbarkeit, dass sich das Tool an erhöhte Anforderungen anpasst, ohne die Leistung zu beeinträchtigen.
- Datensicherheit: Sicherheitsvorkehrungen schützen Ihre sensiblen Informationen und stellen die Einhaltung von Branchenstandards sicher.
- Kosteneinsparungen: Früherkennung und -behebung von Problemen reduzieren Ausfallzeiten und damit verbundene Kosten – zum Vorteil Ihres Geschäftsergebnisses.
- Plattformübergreifende Transparenz: Multi-Cloud-Unterstützung bietet einen einheitlichen Blick auf Abläufe in verschiedenen Umgebungen und erhöht so die Transparenz.
Kosten & Preise
Die Auswahl von Monitoring-Tools erfordert ein Verständnis der verschiedenen verfügbaren Preismodelle und Tarife. Die Kosten variieren je nach Funktionsumfang, Teamgröße, Zusatzoptionen und mehr. Die folgende Tabelle fasst gängige Tarife, deren Durchschnittspreise und typische Funktionen von Monitoring-Tool-Lösungen zusammen:
Tarifvergleichstabelle für Monitoring-Tools
| Tariftyp | Durchschnittspreis | Typische Merkmale |
|---|---|---|
| Kostenloser Tarif | $0/user/month | Basisüberwachung, eingeschränkte Benachrichtigungen und Community-Support. |
| Persönlicher Tarif | $5-$25/user/month | Echtzeit-Benachrichtigungen, anpassbare Dashboards und grundlegende Analysen. |
| Geschäftstarif | $30-$75/user/month | Erweiterte Berichte, Integrationsmöglichkeiten und Multi-User-Zugriff. |
| Unternehmens-Tarif | $100-$300/user/month | Prädiktive Analysen, 24/7 Support und vollständige Anpassungsoptionen. |
Monitoring-Tools FAQs
Hier finden Sie Antworten auf häufige Fragen zu Monitoring-Tools:
Wie funktioniert ein Monitoring-Tool?
Ein Monitoring-Tool überwacht verschiedene Kennzahlen wie CPU-Auslastung, Netzwerkbandbreite und Festplattenspeicher. Es hilft, Probleme zu erkennen und warnt Administratoren, bevor Nutzer betroffen sind. Diese Tools sorgen durch Einblicke in die Performance und mögliche Probleme für einen reibungslosen Betrieb der Systeme.
Welche Fähigkeiten braucht man für die Nutzung von Monitoring-Tools?
Sie benötigen statistische und analytische Fähigkeiten, um Daten zu sammeln und auszuwerten. Diese Kompetenzen helfen Ihnen, die Auswirkungen des Monitorings zu verstehen und fundierte Entscheidungen zu treffen. Ein sicherer Umgang mit Dateninterpretation sowie grundlegendes IT-Wissen sind ebenfalls von Vorteil.
Wie wählt man Application-Monitoring-Tools aus?
Berücksichtigen Sie den Typ und die Komplexität Ihrer Anwendung. Prüfen Sie, wie einfach das Tool sich implementieren und verwalten lässt und ob es Ihren Sicherheitsanforderungen genügt. Achten Sie auf Funktionen, die Ihren spezifischen Anforderungen entsprechen und Ihrem Team den größten Mehrwert bieten.
Wie funktionieren Netzwerk-Monitoring-Tools?
Netzwerk-Monitoring-Tools überwachen Aspekte wie Traffic, Bandbreitennutzung und Betriebszeit. Sie erkennen Geräte im Netzwerk und liefern Statusmeldungen. Das hilft, die Netzwerkleistung zu verwalten und potenzielle Probleme zu identifizieren, bevor Nutzer beeinträchtigt werden.
Welche Herausforderungen gibt es bei der Nutzung von Monitoring-Tools?
Nutzer stehen oft vor Herausforderungen wie einer Datenflut, wodurch wichtige Probleme schwer zu erkennen sind. Auch die Integration in bestehende Systeme kann kompliziert sein. Es ist entscheidend, Alarme richtig zu konfigurieren, um unnötige Benachrichtigungen und damit Alarmmüdigkeit zu vermeiden.
Wie können Monitoring-Tools die Systemperformance verbessern?
Monitoring-Tools liefern Einblicke in Echtzeit zur Systemleistung und helfen, Probleme schnell zu erkennen und zu beheben. Durch Analyse von Trends und frühzeitige Warnungen tragen diese Tools dazu bei, die Systemgesundheit zu erhalten und Ausfallzeiten zu reduzieren.
Wie geht es weiter:
Wenn Sie gerade Monitoring-Tools recherchieren, nehmen Sie Kontakt mit einem SoftwareSelect-Berater auf und erhalten Sie kostenlose Empfehlungen.
Sie füllen ein Formular aus und führen ein kurzes Gespräch, in dem Ihre speziellen Anforderungen besprochen werden. Anschließend erhalten Sie eine Auswahlliste an Software zum Prüfen. Sie werden sogar während des gesamten Kaufprozesses unterstützt, einschließlich Preisverhandlungen.