Zabbix vs. Prometheus: Comparison and Expert Reviews for 2026


Juggling outages, blind spots, and scaling headaches can make network monitoring feel like a never-ending battle. When you’re searching for open source network monitoring tools, Zabbix and Prometheus both stand out for their flexibility, strong communities, and proven track records. Zabbix offers a unified approach with powerful visualization and alerting, while Prometheus shines with its time-series data model and dynamic cloud-native integrations.
This guide will help you weigh their strengths, understand where each excels, and decide which tool fits your environment best.
Zabbix vs. Prometheus: An Overview
Zabbix
Prometheus

Why Trust Our Software Reviews
We’ve been testing and reviewing software since 2023. As tech leaders ourselves, we know how critical and difficult it is to make the right decision when selecting software.
We invest in deep research to help our audience make better software purchasing decisions. We’ve tested more than 2,000 tools for different tech use cases and written over 1,000 comprehensive software reviews. Learn how we stay transparent & our software review methodology.
Zabbix vs. Prometheus Pricing Comparison
| Zabbix | Prometheus | |
|---|---|---|
| Free Trial | Free download available | Free to use |
| Pricing | From $325/month (billed annually) | No licensing cost |
Zabbix vs. Prometheus Pricing & Hidden Costs
Both Zabbix and Prometheus are free to use as open source software, so you won’t pay licensing fees up front. However, Zabbix offers optional commercial support, consulting, and cloud-hosted services, which can add costs if you need enterprise-grade help or want to offload infrastructure management. Prometheus is also free, but you may face extra expenses for long-term storage, integrations, or managed services—especially if you need to scale or add features not included out of the box.
To choose the right pricing model, look beyond the initial software cost and consider your team’s expertise, support needs, and infrastructure complexity. Factor in the time and resources required for setup, maintenance, and scaling. If you need guaranteed support or want to minimize operational overhead, a vendor-backed or managed option might be worth the investment. For teams with strong in-house skills and simple requirements, the pure open source route could keep costs lower.
Zabbix vs. Prometheus Feature Comparison
Zabbix and Prometheus are both open-source monitoring tools designed to collect metrics, visualize system performance, and trigger alerts when issues arise. They overlap in core capabilities like infrastructure and application monitoring, dashboards, alerting systems, and integrations with tools such as Grafana, making them suitable for enterprise observability across hybrid environments. At a high level, both platforms solve the same problem—tracking system health and performance—but differ significantly in how they approach it.
Where they diverge is in philosophy and standout strengths. Zabbix is an all-in-one, centralized monitoring platform with built-in storage, UI, alerting, and extensive agent/agentless data collection, making it especially strong for traditional infrastructure and network monitoring. Prometheus, by contrast, stands out for its high-performance time-series database, pull-based metrics model, and powerful PromQL query language, which make it ideal for cloud-native environments like Kubernetes and microservices.
| Zabbix | Prometheus | |
|---|---|---|
| Bug Tracking | ||
| Custom Reports | ||
| Malware Protection | ||
| Workflow Management |
Zabbix vs. Prometheus Integrations
| Integration | Zabbix | Prometheus |
| Grafana | ✅ | ✅ |
| VMware vSphere | ✅ | ❌ |
| AWS CloudWatch | ✅ | ✅ |
| Kubernetes | ✅ | ✅ |
| Microsoft Azure | ✅ | ✅ |
| Slack | ✅ | ✅ |
| Elasticsearch | ✅ | ✅ |
| PagerDuty | ✅ | ✅ |
| ServiceNow | ✅ | ❌ |
| API | ✅ | ✅ |
| Zapier | ❌ | ❌ |
Zabbix and Prometheus both support integrations, extensibility, and APIs, but in different ways. Zabbix offers many native integrations out of the box via templates and protocols (like SNMP and JMX), along with a comprehensive JSON-RPC API for automation, making it more centralized and turnkey. Prometheus, on the other hand, relies on a large ecosystem of exporters and client libraries for integrations, paired with a REST API, making it highly extensible and better suited to dynamic, cloud-native environments.
Zabbix vs. Prometheus Security, Compliance & Reliability
| Factor | Zabbix | Prometheus |
| Data Encryption | Supports TLS/SSL for encrypted data transfer and secure agent communication. | Offers TLS encryption for endpoints and secure scraping of targets. |
| User Access Control | Provides granular role-based access control and LDAP integration. | Supports basic authentication and integrates with external auth systems. |
| Audit Logging | Includes detailed audit logs for user actions and configuration changes. | Relies on external tools for audit logging and tracking changes. |
| High Availability | Offers built-in high availability with server clustering and failover. | Achieves high availability through federation and external solutions. |
| Compliance Support | Provides templates and documentation for regulatory compliance needs. | Leaves compliance implementation to the user and external integrations. |
Zabbix delivers more built-in features for access control, audit logging, and compliance, while Prometheus relies on external tools and integrations for many of these needs. Zabbix’s strengths lie in its out-of-the-box security and reliability features, while Prometheus excels in flexibility for teams with custom security requirements.
Zabbix vs. Prometheus Ease of Use
| Factor | Zabbix | Prometheus |
| User Interface | Features a graphical dashboard with intuitive navigation and visualizations. | Uses a minimal web UI focused on metrics and queries. |
| Initial Setup | Offers guided setup and auto-discovery for faster deployment. | Requires manual configuration and setup, especially for exporters. |
| Documentation | Provides extensive official documentation and community guides. | Offers solid documentation but expects users to piece together solutions. |
| Alert Management | Includes built-in alerting with customizable templates and escalation. | Relies on Alertmanager for alerting, which adds extra steps. |
| Support Options | Offers commercial support and active community forums. | Community-driven support with strong developer engagement. |
Zabbix is easier to get started with thanks to its guided setup and user-friendly dashboard, while Prometheus appeals to users who prefer a lightweight, hands-on approach. Zabbix’s strengths are its approachable interface and built-in features, while Prometheus stands out for users who want full control and don’t mind a steeper learning curve.
Zabbix vs Prometheus: Pros & Cons
Zabbix
- Open-source with no licensing fees for core features
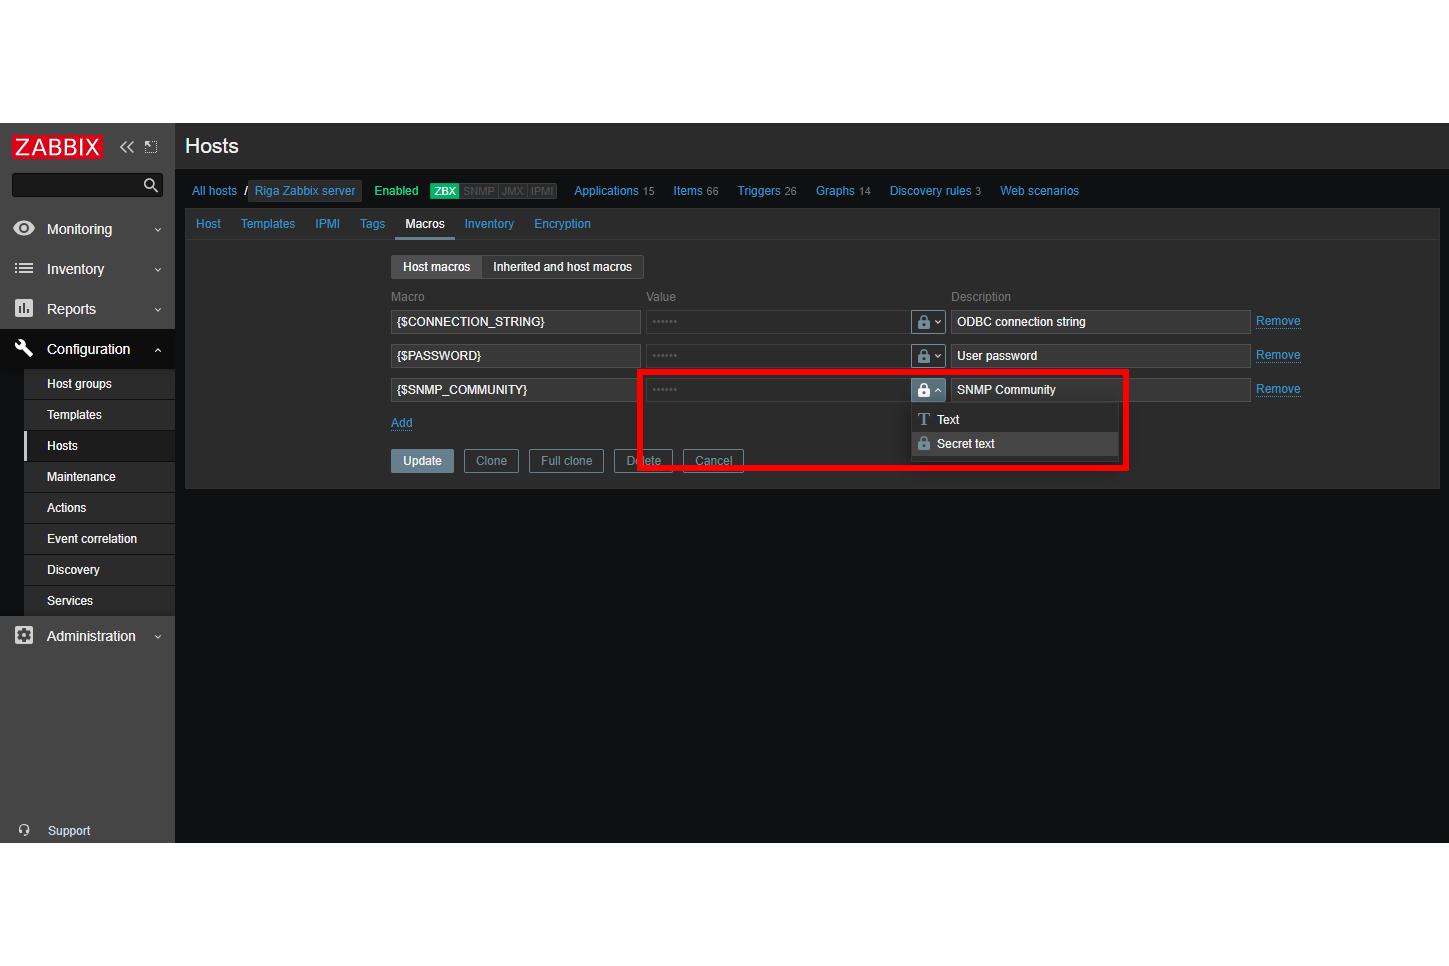
- Supports SNMP, agent, and agentless monitoring methods
- Highly customizable alerting and escalation workflows
- Initial configuration is time-consuming for large environments
- User interface feels dated compared to newer tools
- Official support requires a paid subscription or partner services
Prometheus
- Prometheus's real-time alerting helps your team react swiftly to system changes.
- It offers extensive customization for monitoring metrics that matter to your work.
- The open-source nature allows you to tailor it exactly to your IT environment.
- Prometheus's steep learning curve might challenge your newer team members.
- Its lack of native long-term storage can complicate historical data analysis.
- The complex setup may require more initial time investment from your team.
Best Use Cases for Zabbix and Prometheus
Zabbix
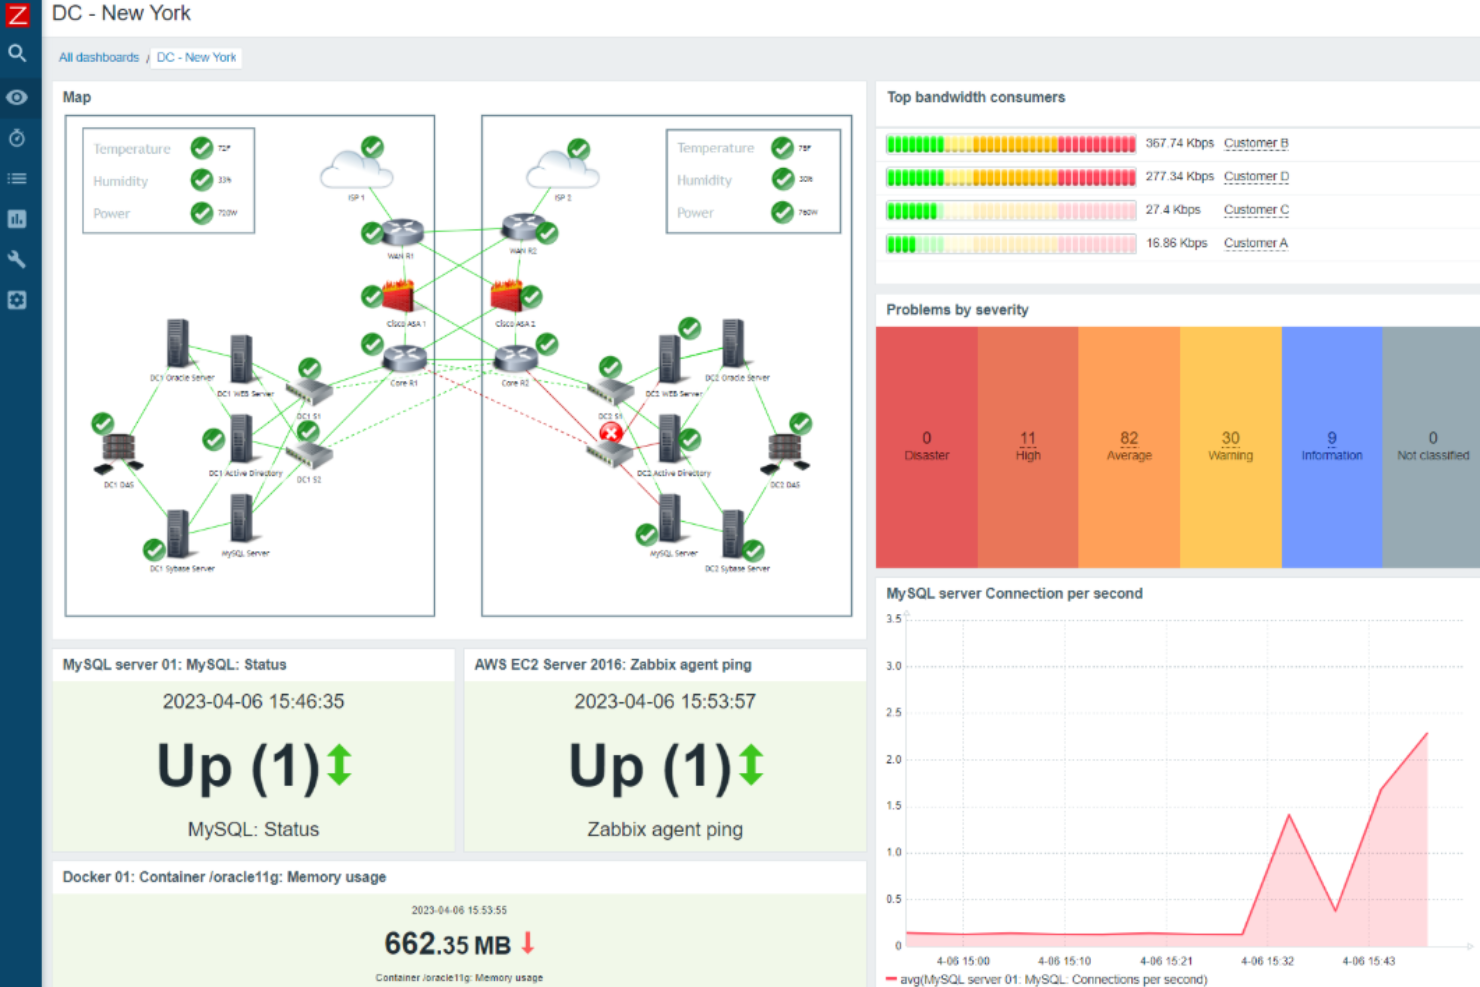
- Large Enterprises Zabbix handles high-volume device monitoring and complex network topologies.
- Managed Service Providers Multi-tenant support and customizable dashboards suit client-facing operations.
- Financial Services Granular alerting and audit trails help meet strict compliance needs.
- Data Centers Agent and agentless monitoring support diverse hardware and network gear.
- Higher Education IT Supports campus-wide, multi-site monitoring with flexible notification rules.
- DevOps Teams API access and automation features integrate with CI/CD pipelines.
Prometheus
- Cloud Services Prometheus is perfect for monitoring dynamic cloud environments due to its real-time data processing and alerting capabilities.
- Large Enterprises Its scalability ensures your team can monitor extensive networks and infrastructure without performance issues.
- Tech Startups You can leverage its open-source nature for cost-effective, customizable solutions in fast-paced development environments.
- IT Departments Prometheus provides your team with the tools needed for detailed system monitoring and prompt issue detection.
- DevOps Teams Its customizable metrics and alerting systems are tailored for your continuous integration and deployment processes.
- Data Centers Prometheus excels in environments requiring precise monitoring and quick response to hardware or network changes.
Who Should Use Zabbix, And Who Should Use Prometheus?
Zabbix is best suited for organizations that need a comprehensive, all-in-one monitoring solution with minimal external dependencies. It works particularly well for IT teams managing traditional infrastructure, such as on-prem servers, networks, and hardware, where agent-based monitoring and built-in templates provide quick setup and deep visibility. Companies that prefer a centralized UI, native alerting, and structured configuration without relying heavily on external tools will find Zabbix a strong fit.
Prometheus is ideal for teams operating in cloud-native, containerized environments, especially those using Kubernetes and microservices architectures. Its pull-based model, flexible data collection via exporters, and powerful PromQL query language make it well-suited for dynamic, ephemeral systems where scalability and customization are critical. Engineering teams that value modularity, strong API access, and integration with a broader observability stack (like Grafana and Alertmanager) will benefit most from Prometheus.
Differences Between Zabbix and Prometheus
| Zabbix | Prometheus | |
|---|---|---|
| Alerting | Native alerting system with escalation rules, media types, and workflows included. | Uses Alertmanager for notifications, requiring extra configuration. |
| Architecture | Monolithic, all-in-one platform with built-in storage, UI, and real-time alerting. | Modular architecture with separate components (Prometheus server, Alertmanager, exporters). |
| Automation | Supports auto-discovery and template-based monitoring out of the box. | Automation achieved through service discovery and integration with cloud-native tools and pipelines. |
| Data Collection | Uses agent-based and agentless monitoring for broad device coverage. | Relies on pull-based metrics collection with exporters. |
| Storage | Uses a relational database (e.g., MySQL, PostgreSQL) for historical data. | Includes its own high-performance time-series database (TSDB) optimized for metrics. |
| Read Zabbix ReviewOpens new window | Read Prometheus ReviewOpens new window |
Similarities Between Zabbix and Prometheus
| API Access | Each provides a robust API for automation, custom integrations, and advanced monitoring workflows. |
|---|---|
| Community Support | Each has an active global community that shares plugins, integrations, and troubleshooting advice. |
| Multi-Environment Support | Each can monitor a mix of environments, including on-prem infrastructure, cloud services, and hybrid systems. |
| Open Source | Both are fully open source, allowing you to customize, extend, and self-host without licensing fees. |
| Scalability | Both can scale from small setups to large, distributed environments with the right configuration. |
| Read Zabbix ReviewOpens new window Read Prometheus ReviewOpens new window | |