Best New Relic Alternatives Shortlist
Here’s my shortlist of the best New Relic alternatives:
-

Site24x7
Visit WebsiteThis is an aggregated rating for this tool including ratings from Crozdesk users and ratings from other sites.4.7 -

GitHub Actions
Visit WebsiteThis is an aggregated rating for this tool including ratings from Crozdesk users and ratings from other sites.4.8 -

Docker
Visit WebsiteThis is an aggregated rating for this tool including ratings from Crozdesk users and ratings from other sites.4.6
If you're managing a tech team, you know the right tools can make all the difference. That said, maybe New Relic isn't meeting your needs or budget. Whatever the reason, finding alternatives can be a real challenge.
I've spent time testing and reviewing various software solutions to bring you unbiased, research-backed insights. In this article, you'll find the best New Relic alternatives that fit your business better.
I aim to help you choose the right tool for your team’s challenges. You’ll get a clear sense of each software’s strengths and weaknesses. So, let’s dive in and find the best solution for you.
What Is New Relic?
New Relic is an observability platform that helps businesses monitor, troubleshoot, and optimize software performance. It's commonly used by IT professionals, developers, and site reliability engineers who need to keep their applications running smoothly.
With AI-driven insights, New Relic predicts potential issues and detects anomalies before they impact users. Supporting diverse programming languages, frameworks, and cloud platforms, it aligns technical performance with business metrics to improve customer experiences and operational efficiency.
Why Trust Our Software Reviews
We’ve been testing and reviewing SaaS development software since 2023. As tech experts ourselves, we know how critical and difficult it is to make the right decision when selecting software. We invest in deep research to help our audience make better software purchasing decisions.
We’ve tested more than 2,000 tools for different SaaS development use cases and written over 1,000 comprehensive software reviews. Learn how we stay transparent & check out our software review methodology.
Best New Relic Alternatives Summary
This comparison chart summarizes pricing details for my top New Relic alternative selections to help you find the best one for your budget and business needs.
| Tool | Best For | Trial Info | Price | ||
|---|---|---|---|---|---|
| 1 | Best for error tracking in apps | Free plan + free trial + free demo available | From $26/month (billed annually) | Website | |
| 2 | Best for real user monitoring | 30-day free trial + free demo available | From $10/month (billed annually) | Website | |
| 3 | Best for AI-powered analytics | 30-day free trial + free demo + free plan availabl | From $199/year | Website | |
| 4 | Best for agentless architecture | Free 15-day trial | From $16/hybrid unit/month | Website | |
| 5 | Best for AWS integration | 30-day free trial | From $99.90/month (10 hosts, 100 containers) | Website | |
| 6 | Best for distributed tracing | Not available | Pricing upon request | Website | |
| 7 | Best for multi-source monitoring | Free plan available | From $19/month + usage | Website | |
| 8 | Best for cost-effective scaling | Free plan available | Pricing upon request | Website | |
| 9 | Best for network monitoring | Free demo + 30-day free trial available | From $179/month (billed annually) | Website | |
| 10 | Best for remote management | 30-day free trial | From $145/month (billed annually) | Website |
-

Site24x7
Visit WebsiteThis is an aggregated rating for this tool including ratings from Crozdesk users and ratings from other sites.4.7 -

GitHub Actions
Visit WebsiteThis is an aggregated rating for this tool including ratings from Crozdesk users and ratings from other sites.4.8 -

Docker
Visit WebsiteThis is an aggregated rating for this tool including ratings from Crozdesk users and ratings from other sites.4.6
Best New Relic Alternatives Reviews
Below are my detailed summaries of my shortlist’s best New Relic alternatives. My reviews thoroughly examine the key features, pros & cons, integrations, and ideal use cases of each tool to help you find the best one for you.
Sentry is an application monitoring tool focused on error tracking and performance management. Developers and engineering teams widely use it to identify and fix bugs in real-time.
Why it's a good New Relic alternative: Sentry excels in error tracking, making it ideal for teams focused on debugging applications. Its real-time error alerting lets your team respond quickly to issues, minimizing downtime. With detailed error reports, you can easily trace back to the source of a problem. Sentry’s focus on software health metrics offers a distinct advantage over New Relic's broader performance monitoring.
Standout features & integrations:
Features include real-time error alerting, detailed error reports, and performance monitoring. You'll find issue grouping useful for managing related errors efficiently. Sentry also provides release tracking to help you correlate errors with new code deployments.
Integrations include GitHub, GitLab, Bitbucket, Jira, Slack, Trello, Asana, Microsoft Teams, Zendesk, and PagerDuty.
Pros and Cons
Pros:
- Efficient issue grouping
- Real-time alerting
- Strong error-tracking capabilities
Cons:
- May need technical expertise
- Requires setup and configuration
New Product Updates from Sentry
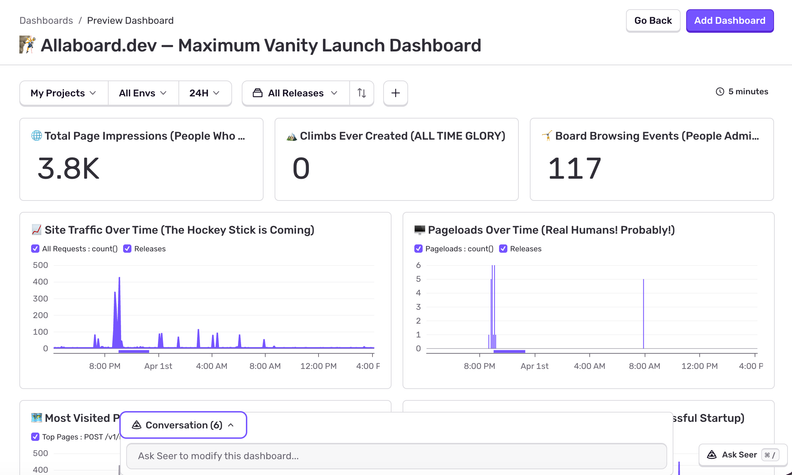
Sentry Adds AI Dashboard Generation in Beta
Sentry introduces AI Dashboard Generation in beta, enabling users to create dashboards using prompts through an agent. This makes dashboard setup faster and easier without manual configuration. For more information, visit Sentry’s official site.
For those seeking a reliable alternative to New Relic, Site24x7 offers a compelling solution tailored to meet the diverse needs of IT operations and DevOps teams. It caters to businesses of all sizes, providing essential tools for monitoring website performance, application efficiency, and network health. With its cost-effective pricing and comprehensive feature set, Site24x7 addresses the common challenges of managing IT infrastructure, making it an attractive choice for professionals looking to optimize their monitoring capabilities.
Why I Picked Site24x7
I picked Site24x7 as a New Relic alternative because it offers a unified observability platform that efficiently covers a wide array of monitoring needs. The application performance monitoring feature allows you to gain insight into your application’s health and pinpoint issues at the code level, ensuring optimal performance. Additionally, the real user monitoring (RUM) feature provides visibility into the end-user experience, enabling you to understand how your applications are performing from the user's perspective. These capabilities, combined with its cost-effective nature, make Site24x7 a strong contender for those seeking a comprehensive monitoring solution.
Site24x7 Key Features
In addition to the robust capabilities mentioned, Site24x7 offers several other features that enhance its utility as a monitoring tool:
- Log Management: This feature allows you to collect, analyze, and manage logs from various sources, helping you to quickly identify and resolve issues.
- Network Monitoring: You can monitor network traffic and performance, ensuring that your network infrastructure is running smoothly and efficiently.
- Cloud Cost Management: This feature helps you manage and optimize cloud spending, providing insights into your cloud infrastructure costs.
- Incident Communication: Site24x7 facilitates communication during incidents, ensuring that the right team members are alerted and can respond promptly.
Site24x7 Integrations
Site24x7 integrates with popular tools such as ServiceNow, PagerDuty, Slack, Microsoft Teams, AWS, Azure, Kubernetes, Nagios, and MySQL. These integrations allow for seamless communication and efficient monitoring across your IT ecosystem.
Pros and Cons
Pros:
- Strong APM with code visibility
- Real user monitoring insights
- Broad all-in-one monitoring coverage
Cons:
- Setup complexity for advanced features
- Interface can feel cluttered
New Product Updates from Site24x7
Site24x7 Enhances Network Monitoring With Device and Visibility Updates
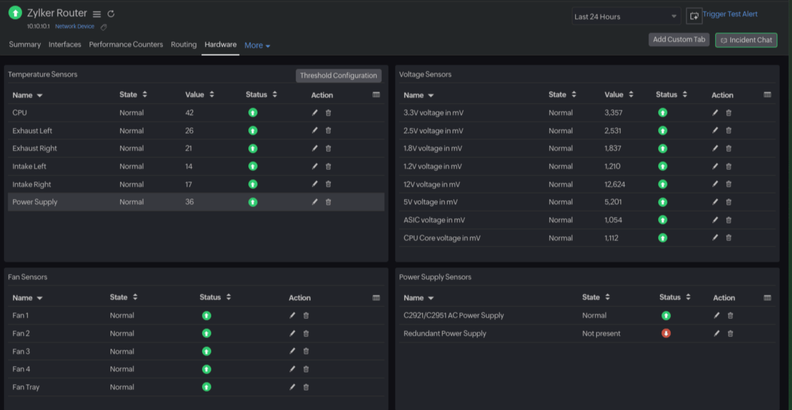
Site24x7 introduces proactive hardware health monitoring, expanded device support, centralized network controls, and enhanced SD-WAN visualization to improve network monitoring and management. For more information, visit Site24x7’s official site.
ManageEngine Applications Manager is an application performance monitoring solution designed for IT operations teams and system administrators. It helps your team ensure the availability and performance of applications and infrastructure through monitoring and analytics.
Why it's a good New Relic alternative: ManageEngine Applications Manager differentiates itself with AI-powered analytics, giving you predictive insights into application performance. This feature helps your team anticipate potential issues before they impact users. The tool offers comprehensive monitoring capabilities that cover both applications and infrastructure. Unlike New Relic, ManageEngine Applications Manager provides a more integrated approach to monitoring diverse IT environments.
Standout features & integrations:
Features include application discovery, business view dashboards, and capacity planning. You can set up alerts to notify you of performance deviations. ManageEngine Applications Manager also supports synthetic transaction monitoring, helping you simulate user interactions.
Integrations include AWS, Microsoft Azure, Google Cloud, VMware, Docker, Oracle, SAP, Microsoft SQL Server, JBoss, and IBM WebSphere.
Pros and Cons
Pros:
- Supports synthetic transactions
- Comprehensive monitoring capabilities
- AI-powered predictive insights
Cons:
- May need technical expertise
- Limited out-of-the-box templatesLimited out-of-the-box templates
New Product Updates from ManageEngine Applications Manager
ManageEngine Applications Manager Adds Veeam Monitoring
ManageEngine Applications Manager adds Veeam Enterprise Manager monitoring. This update enables tracking of backup infrastructure, job performance, and storage usage. For more information, visit ManageEngine’s official site.
LogicMonitor is a cloud-based infrastructure monitoring platform for IT operations teams and network administrators. It provides monitoring solutions for networks, servers, and cloud environments, helping you maintain optimal performance.
Why it's a good New Relic alternative: LogicMonitor uses an agentless architecture, simplifying deployment and reducing overhead for your IT team. It offers real-time monitoring of your entire infrastructure, providing detailed insights into system performance. You can quickly identify and address issues with customizable dashboards and automated alerts. Unlike New Relic, LogicMonitor's focus on agentless deployment makes it a flexible choice for diverse environments.
Standout features & integrations:
Features include automated discovery, performance forecasting, and anomaly detection. You can use it to monitor metrics across various devices and applications. LogicMonitor also offers predictive analytics to help you plan for future capacity needs.
Integrations include Amazon Web Services, Microsoft Azure, Google Cloud Platform, VMware, Cisco Meraki, Dell EMC, NetApp, Nutanix, ServiceNow, and Slack.
Pros and Cons
Pros:
- Predictive analytics
- Real-time monitoring
- Agentless deploymentAgentless deployment
Cons:
- Limited application performance monitoring
- Requires initial configuration
SolarWinds AppOptics is an application performance monitoring tool for IT professionals and developers. It provides end-to-end visibility into your infrastructure and application performance, helping you monitor and optimize system operations.
Why it's a good New Relic alternative: SolarWinds AppOptics is known for its strong AWS integration, making it ideal for teams that rely heavily on Amazon Web Services. It offers detailed monitoring of AWS services, allowing your team to track performance metrics in real-time. With customizable dashboards, you can tailor views to match your specific needs. Unlike New Relic, AppOptics focuses on simplifying AWS monitoring with built-in integrations.
Standout features & integrations:
Features include customizable dashboards, real-time metrics, and distributed tracing. You can set up alerts to notify you when performance thresholds are reached. SolarWinds AppOptics also supports anomaly detection, helping you identify unusual patterns in data.
Integrations include AWS, Microsoft Azure, Google Cloud, Docker, Kubernetes, VMware, Apache, Nginx, Tomcat, and MySQL.
Pros and Cons
Pros:
- Customizable dashboards
- Real-time performance metrics
- Strong AWS integration
Cons:
- Can be resource-intensive
- Limited outside AWS monitoring
Elastic APM is a performance monitoring tool for developers and IT operations teams. It helps you track and analyze application performance, ensuring your systems run efficiently.
Why it's a good New Relic alternative: Elastic APM offers distributed tracing, ideal for monitoring complex systems. This feature lets your team trace requests across various services, providing a clear view of performance bottlenecks. Real-time monitoring and customizable dashboards further enhance visibility into your applications.
Standout features & integrations:
Features include real-time monitoring, customizable dashboards, and automatic anomaly detection. You can visualize performance data with detailed transaction tracking, giving your team insights into application behavior. Elastic APM also supports open-source agents, offering flexibility in monitoring.
Integrations include Kibana, Elasticsearch, Beats, Logstash, AWS, Azure, Google Cloud, Docker, Kubernetes, and OpenTelemetry.
Pros and Cons
Pros:
- Open-source agent support
- Detailed transaction tracking
- Distributed tracing capability
Cons:
- May need technical expertise for setup
- Can be resource-intensive
Grafana is a visualization and analytics tool that caters to developers and IT teams. It provides powerful dashboards to visualize data from multiple sources, helping you monitor and analyze performance metrics effectively.
Why it's a good New Relic alternative: Grafana offers multi-source monitoring, allowing you to visualize data from various databases and applications in one place. Its customizable dashboards allow your team to display the metrics that matter most. Grafana’s alerting capabilities notify you of performance issues as they arise. Unlike New Relic, Grafana's focus on open-source solutions offers a more flexible approach to data visualization.
Standout features & integrations:
Features include customizable dashboards, alerting mechanisms, and support for multiple data sources. You can create dynamic dashboards to suit your specific needs. Grafana also provides options for sharing and collaborating on dashboards within your team.
Integrations include Prometheus, InfluxDB, Graphite, MySQL, PostgreSQL, Elasticsearch, AWS Amazon CloudWatch, Azure Monitor, Google Cloud, and Loki.
Pros and Cons
Pros:
- Open-source flexibility
- Supports multiple data sources
- Customizable dashboards
Cons:
- Steeper learning curve
- Limited out-of-the-box features
Amazon Amazon CloudWatch is a monitoring and observability service designed for developers and IT teams using AWS. It helps you collect and track metrics, monitor log files, and set alarms to keep your AWS resources running smoothly.
Why it's a good New Relic alternative: Amazon CloudWatch offers organizations the ability to scale cost-effectively. It integrates with AWS services, making it ideal for teams heavily invested in Amazon's ecosystem. It provides detailed monitoring and alarming capabilities to keep track of AWS resources in real-time. You can maintain operations with features like automated actions and anomaly detection. Unlike New Relic, Amazon CloudWatch's deep integration with AWS offers a more tailored solution for AWS users.
Standout features & integrations:
Features include automated actions, anomaly detection, and custom dashboards. You can create alarms to react to changes in your AWS environment. Amazon CloudWatch also provides detailed insights into your application logs.
Integrations include Amazon EC2, Amazon RDS, Amazon S3, AWS Lambda, Amazon ECS, Amazon EKS, Amazon DynamoDB, Amazon CloudFront, Amazon Route 53, and Amazon Elastic Load Balancing.
Pros and Cons
Pros:
- Automated actions feature
- Detailed monitoring capabilities
- Strong AWS integrationStrong AWS integration
Cons:
- Steeper learning curve
- May be resource-intensive
Paessler PRTG is a network monitoring solution for IT administrators and network managers. It helps you keep track of network performance, detect outages, and ensure network reliability.
Why it's a good New Relic alternative: Paessler PRTG is particularly strong in network monitoring, which sets it apart if your team needs to focus on infrastructure health. It provides comprehensive visibility with its sensor-based monitoring system. This allows for tailored monitoring of specific network components. Unlike New Relic, Paessler PRTG is designed to handle a wide array of network devices, offering flexibility in what you can monitor.
Standout features & integrations:
Features include a sensor-based approach to monitoring, customizable alerts, and detailed reporting. You can set up dashboards to visualize network health effectively. Paessler PRTG also supports distributed monitoring, which is helpful for remote sites.
Integrations include Microsoft Azure, Amazon Web Services, VMware, Cisco, Juniper Networks, SNMP, NetFlow, WMI, REST API, and Ping.
Pros and Cons
Pros:
- Customizable alerts
- Sensor-based monitoring
- Strong network monitoring
Cons:
- Steeper learning curve
- May need technical expertise
Atera Networks is a remote monitoring and management (RMM) solution for IT professionals and managed service providers (MSPs). It offers comprehensive tools for monitoring IT infrastructure, automating tasks, and managing multiple clients from a single platform.
Why it's a good New Relic alternative: Atera Networks focuses on remote monitoring and management, making it ideal for IT teams looking to manage diverse environments from afar. It combines RMM, help desk, and network discovery features, providing a holistic view of your IT operations. Its automation capabilities help your team streamline repetitive tasks, reducing manual effort. Unlike New Relic, Atera Networks offers a unified platform for end-to-end IT management.
Standout features & integrations:
Features include network discovery, patch management, and a ticketing system. You can automate routine tasks, saving time and increasing efficiency. Atera Networks also provides a centralized dashboard to monitor all IT operations from one place.
Integrations include Splashtop, AnyDesk, TeamViewer, QuickBooks, FreshBooks, Xero, Stripe, PayPal, ConnectBooster, and Microsoft 365.
Pros and Cons
Pros:
- Task automation capabilities
- Comprehensive RMM features
- Strong remote monitoring
Cons:
- Limited application monitoring
- Requires setup and configuration
Other New Relic Alternatives
Here are some additional New Relic alternatives that didn’t make it onto my shortlist but are still worth checking out.
- Paessler PRTG
For network monitoring
- Atera Networks
For remote management
- Stackify Retrace
For real-time code profiling
- Sematext
For cost-effective monitoring
- Zenoss
For hybrid IT environments
- Dotcom Monitor
For real-browser user simulations
- Sumo Logic
For cloud-native applications
- Datadog
For cross-platform visibility
- Splunk
For big data analysis
- AppDynamics
For business transaction monitoring
- Dynatrace
For full-stack monitoring
- IBM Instana
For AI-driven insights
- Azure Monitor
For Microsoft ecosystem users
New Relic Alternatives Selection Criteria
When selecting the best New Relic alternatives in this list, I considered everyday buyer needs and pain points related to SaaS researcher products, like scalability and integration capabilities. I also used the following framework to keep my evaluation structured and fair.
Core Functionality (25% of total score)
To be considered for inclusion in this list, each solution had to fulfill these everyday use cases:
- Monitor application performance
- Provide real-time alerts
- Offer detailed reporting
- Support multiple data sources
- Enable user access control
Additional Standout Features (25% of total score)
To help further narrow down the competition, I also looked for unique features, such as:
- AI-driven insights
- Customizable dashboards
- Predictive analytics
- Multi-cloud support
- Advanced anomaly detection
Usability (10% of total score)
To get a sense of the usability of each system, I considered the following:
- Intuitive user interface
- Ease of navigation
- Customization options
- Mobile access
- User-friendly documentation
Onboarding (10% of total score)
To evaluate the onboarding experience for each platform, I considered the following:
- Availability of training videos
- Interactive product tours
- Access to templates
- Webinars and workshops
- Chatbot assistance
Customer Support (10% of total score)
To assess each software provider’s customer support services, I considered the following:
- 24/7 availability
- Access to a knowledge base
- Live chat support
- Phone and email support
- Response time
Value For Money (10% of total score)
To evaluate the value for money of each platform, I considered the following:
- Pricing transparency
- Flexible plans
- Free trial availability
- Feature-to-price ratio
- Contract length options
Customer Reviews (10% of total score)
To get a sense of overall customer satisfaction, I considered the following when reading customer reviews:
- Overall satisfaction ratings
- Commonly mentioned pros and cons
- Feedback on customer support
- User-reported ease of use
- Value for money perceptions
Why Look For A New Relic Alternative?
While New Relic is a solid choice for IT professionals, there are other reasons why some users seek out alternative solutions. You might be looking for a New Relic alternative because:
- It doesn't fit your budget
- You need better customer support
- You require more scalability options
- Your team needs specific industry compliance
- You want better integration with existing tools
- You're dealing with data residency concerns
If any of these apply, you’ve come to the right place. My list contains several SaaS options better suited for teams facing these challenges with New Relic and looking for alternative solutions.
New Relic Key Features
Here are some of the key features of New Relic to help you contrast and compare what alternative solutions offer.
- Application performance monitoring (APM): Real-time insights into application performance to identify bottlenecks and optimize efficiency.
- Serverless monitoring: Keep track of serverless architectures for smooth operation without dedicated servers.
- Business observability: Combine business metrics with technical performance to holistically understand the impact on outcomes.
- Security features: Tools for application security testing and vulnerability management to protect software from threats.
- Digital experience monitoring: Monitor user experiences across web and mobile platforms to improve satisfaction and engagement.
- AI capabilities: Predictive insights and monitoring to foresee and address issues proactively.
- Infrastructure monitoring: Monitor infrastructures, including cloud services, for optimal performance across IT environments.
- Log management: Centralize log tracking and troubleshooting with comprehensive log management tools.
- Alerts and dashboards: Customizable alerts and dashboards for real-time data and system health updates.
- Observability platform: Unified monitoring and insights across the tech stack for improved performance and reliability.
- Troubleshooting tools: Diagnose and resolve issues quickly by identifying bottlenecks and errors.
- Self-hosted compatibility: Flexible support for self-hosted environments for unique infrastructure needs.
- Data aggregation: Centralize logs, metrics, and traces to provide a cohesive view of application health.
- End-user insights: Optimize user interactions by analyzing detailed data on user experiences.
- Java monitoring: In-depth insights into Java applications, including JVM performance and thread activity.
- Microservices monitoring: Analyze microservices performance to ensure seamless operation and communication.
- Tech stack integrations: Easily integrate with various tools and technologies for diverse environments.
- Workflow automation: Automate repetitive monitoring tasks to enhance DevOps practices.
- Cloud monitoring: Deep insights into cloud-native application resources, including CPU and memory utilization.
- CPU utilization tracking: Monitor CPU usage to maintain performance and prevent constraints.
- DevOps alignment: Actionable insights and tools to bridge gaps between development and operations teams.
- Frontend performance monitoring: Track and optimize frontend performance for seamless user experiences.
- In-depth instrumentation: Detailed metrics and tracing to uncover hidden performance issues.
- Open-source tools support: Compatible with open-source monitoring tools for flexibility and cost-efficiency.
- Optimization insights: Telemetry and AI-driven recommendations for application and infrastructure performance.
- Flexible pricing model: Multiple pricing tiers, including a free option, to fit varying budgets.
- Python support: Detailed monitoring for Python applications, covering performance and dependencies.
- Synthetic monitoring: Simulate user interactions to optimize application behavior under controlled conditions.
- Telemetry insights: Manage system health proactively with telemetry data.
- Web applications monitoring: High-availability monitoring for web applications across platforms.
What’s Next?
Boost your SaaS growth and leadership skills. Subscribe to our newsletter for the latest insights from CTOs and aspiring tech leaders.
