

No mundo acelerado da tecnologia, manter o seu website operacional é crucial. O tempo de inatividade pode custar-lhe não só dinheiro, mas também a sua reputação. Enquanto especialista em tecnologia, conhece a frustração causada por interrupções inesperadas ou tempos de carregamento lentos. É aí que entram as ferramentas de monitorização de websites.
Estas ferramentas ajudam-no a acompanhar o desempenho do seu site, garantindo que tudo funciona sem problemas. Na minha experiência, ter a ferramenta certa pode poupar tempo e dores de cabeça à sua equipa.
Neste artigo, vou partilhar as minhas principais escolhas de ferramentas de monitorização de websites. Encontrará uma análise imparcial e baseada numa pesquisa aprofundada para o ajudar a encontrar a solução mais adequada às suas necessidades. Vamos começar e garantir que o seu website se mantém nas melhores condições.
Why Trust Our Software Recommendations
6,700+
Reviews
20
Industry experts
16+
Evaluation factors
14
Years
Our team has been testing and reviewing software since 2012. As tech leaders ourselves, we know how difficult—and important—it is to choose the right software.
For this guide, we evaluated tools using hands-on testing and independent research, scoring tools using our selection criteria.
Our reviews reflect our human editorial judgment, not a sales pitch.
Expert reviewers:
- Paulo Gardini MiguelTech Director
 Tim FisherVP of AI
 Gabriel RosasTech Lead & Software Architect
 Christhian GruhnTech Lead & Platform Architect

Tabela comparativa de ferramentas de monitorização de websites
Esta tabela comparativa resume os detalhes de preços das minhas principais escolhas de ferramentas de monitorização de websites:
| Tool | Best For | Trial Info | Price | ||
|---|---|---|---|---|---|
| 1 | Best for 24/7 website availability monitoring | Free plan + 30-day free trial available | From $200/month (billed annually) | Website | |
| 2 | Best for real-time website error tracking | Free plan + 14-day trial + free demo available | From $26/month (billed annually) | Website | |
| 3 | Best for combined application and website monitoring | Free plan + 30-day trial available | From $395/year (billed annually) | Website | |
| 4 | Best for visual and content change detection | 7-day free trial | From $15/month | Website | |
| 5 | Best for global reach with 110+ locations | Free plan + 30-day trial + demo available | From $10/month | Website | |
| 6 | Best for SSL monitoring | Free plan + free demo available | From $8/10 monitors/month (billed annually) | Website | |
| 7 | Best for AI-driven analytics | 15-day free trial | From $7/month | Website | |
| 8 | Best for real-time monitoring dashboards | Free plan available | From $15/month (billed annually) | Website | |
| 9 | Best for hybrid infrastructure monitoring | 15-day free trial + free demo available | From $19/month | Website | |
| 10 | Best for real-time user interaction data | Free plan available | From $10/user/month | Website |


Análises das melhores ferramentas de monitorização de websites
Apresentamos abaixo os meus resumos detalhados das melhores ferramentas de monitorização de websites que entraram na minha lista restrita. As minhas análises oferecem uma visão detalhada das principais funcionalidades, vantagens & desvantagens, integrações e casos de utilização ideais de cada ferramenta, para o ajudar a encontrar a melhor opção para si.
 Best for 24/7 website availability monitoring
- Free plan + 30-day free trial available
- From $200/month (billed annually)
Visit WebsiteCustomer Rating:4.6/5
PRTG's performance monitoring features display key metrics and visual graphs to analyze website performance. PRTG is a comprehensive monitoring tool that helps you keep an eye on your entire IT infrastructure, including websites. It allows you to monitor website availability, load times, and processes, ensuring optimal performance and user experience.
Why I Picked PRTG: One of the key features of PRTG is its ability to monitor website availability around the clock. Using sensors like HTTP v2 and HTTP Advanced, you can ensure your website is accessible 24/7. For global businesses, PRTG offers Cloud HTTP v2 and Cloud Ping v2 sensors to monitor availability from various locations worldwide. Another valuable feature is the HTTP Full Web Page sensor, which provides detailed insights into your website's load times. This sensor helps you identify individual elements responsible for slow load times, allowing you to take action before downtimes occur.
Standout Features & Integrations:
Other features include the HTTP Transaction sensor, which ensures all website processes run smoothly by monitoring a series of URLs used during complete transactions, such as shopping processes. Additionally, PRTG offers customizable alerts and data visualization, enabling you to quickly identify and prevent website availability and page speed issues.
Integrations include AWS, Cisco, Dell Technologies, HPE, VMware, ServiceNow, Check Point, Sonicwall, NetApp, Fujitsu, Lansweeper, and Martello.
Pros and Cons
Pros:
- Supports multiple monitoring technologies
- Customizable dashboards and real-time alerts
- Provides a comprehensive overview of network infrastructure
Cons:
- Monitoring more sensors can be resource-intensive
- Initial setup can be time-consuming
Learn more about Paessler PRTG: Best for real-time website error tracking
- Free plan + 14-day trial + free demo available
- From $26/month (billed annually)
Visit WebsiteCustomer Rating:4.5/5
Sentry shows detailed traces and spans to pinpoint the exact source of errors. Sentry offers a comprehensive solution for businesses looking to enhance their website monitoring capabilities. Designed to assist developers and software teams, Sentry provides tools that allow you to see errors clearly and solve issues faster, making it an appealing choice for various industries, including web development and ecommerce. With features like error tracking, uptime monitoring, and session replay, Sentry helps you maintain optimal application performance and user experience, addressing common challenges such as unexpected downtime and performance bottlenecks.
Why I Picked Sentry
I picked Sentry for its unique focus on providing detailed insights into application performance and error tracking. One standout feature is its real-time error monitoring, which captures errors as they occur, allowing you to quickly diagnose and resolve issues. Another key feature is the uptime monitoring, which ensures your website is always accessible by notifying you of any downtime. Additionally, Sentry's session replay functionality provides a visual representation of user interactions, helping you understand and resolve user experience issues more efficiently.
Sentry Key Features
In addition to real-time website error tracking, Sentry offers:
- Tracing: Provides insights into API calls and database queries, helping you identify performance bottlenecks within your application.
- Automatic Root Cause Analysis: Utilizes AI to pinpoint the underlying causes of errors, streamlining the debugging process.
- AI-Driven Debugging: Offers automated code reviews and suggestions, reducing the time needed to resolve complex issues.
- Integration with Development Tools: Seamlessly connects with platforms like GitHub and Slack, ensuring a smooth workflow for your development team.
Sentry Integrations
Integrations include GitHub, Slack, Jira, Bitbucket, GitLab, Trello, Azure DevOps, PagerDuty, AWS Lambda, and Microsoft Teams.
Pros and Cons
Pros:
- Advanced error grouping helps prioritize issues for fast resolution
- Distributed tracing shows transaction-level performance insights
- Offers real-time error tracking across web, mobile, and backend apps
Cons:
- Limited alerts and applications insights in lower-tier plans
- Not all integrations are available natively, relying on third-party APIs for some
Learn more about Sentry: Best for combined application and website monitoring
- Free plan + 30-day trial available
- From $395/year (billed annually)
Visit WebsiteCustomer Rating:4.3/5
ManageEngine Applications Manager waterfall chart ManageEngine Applications Manager delivers an integrated approach to monitoring both applications and websites. By ensuring consistent performance of these two critical components, it helps organizations maintain optimal user experiences and operational efficiency.
Why I Picked ManageEngine Applications Manager: I selected ManageEngine Applications Manager for its comprehensive approach to performance monitoring. Upon judging and comparing multiple tools, it was my opinion that ManageEngine's capability to simultaneously monitor both applications and websites gives it a distinct edge.
This dual monitoring ability positions it as an ideal solution for organizations that need to ensure both their web and application assets perform harmoniously.
Standout Features & Integrations:
ManageEngine Applications Manager excels in monitoring diverse applications ranging from web apps, and databases, to big data stores. Its root cause analysis feature helps quickly pinpoint issues, reducing downtime. Additionally, it provides key integrations with platforms such as AWS, Microsoft Azure, and Oracle Cloud, further broadening its monitoring spectrum.
Pros and Cons
Pros:
- Useful root cause analysis feature
- Comprehensive support for a variety of application types
- Dual monitoring of both applications and websites
Cons:
- Requires initial configuration and setup time
- Licensing can become complex as you scale
- Might be over-comprehensive for small businesses
Learn more about ManageEngine Applications Manager: Best for visual and content change detection
- 7-day free trial
- From $15/month
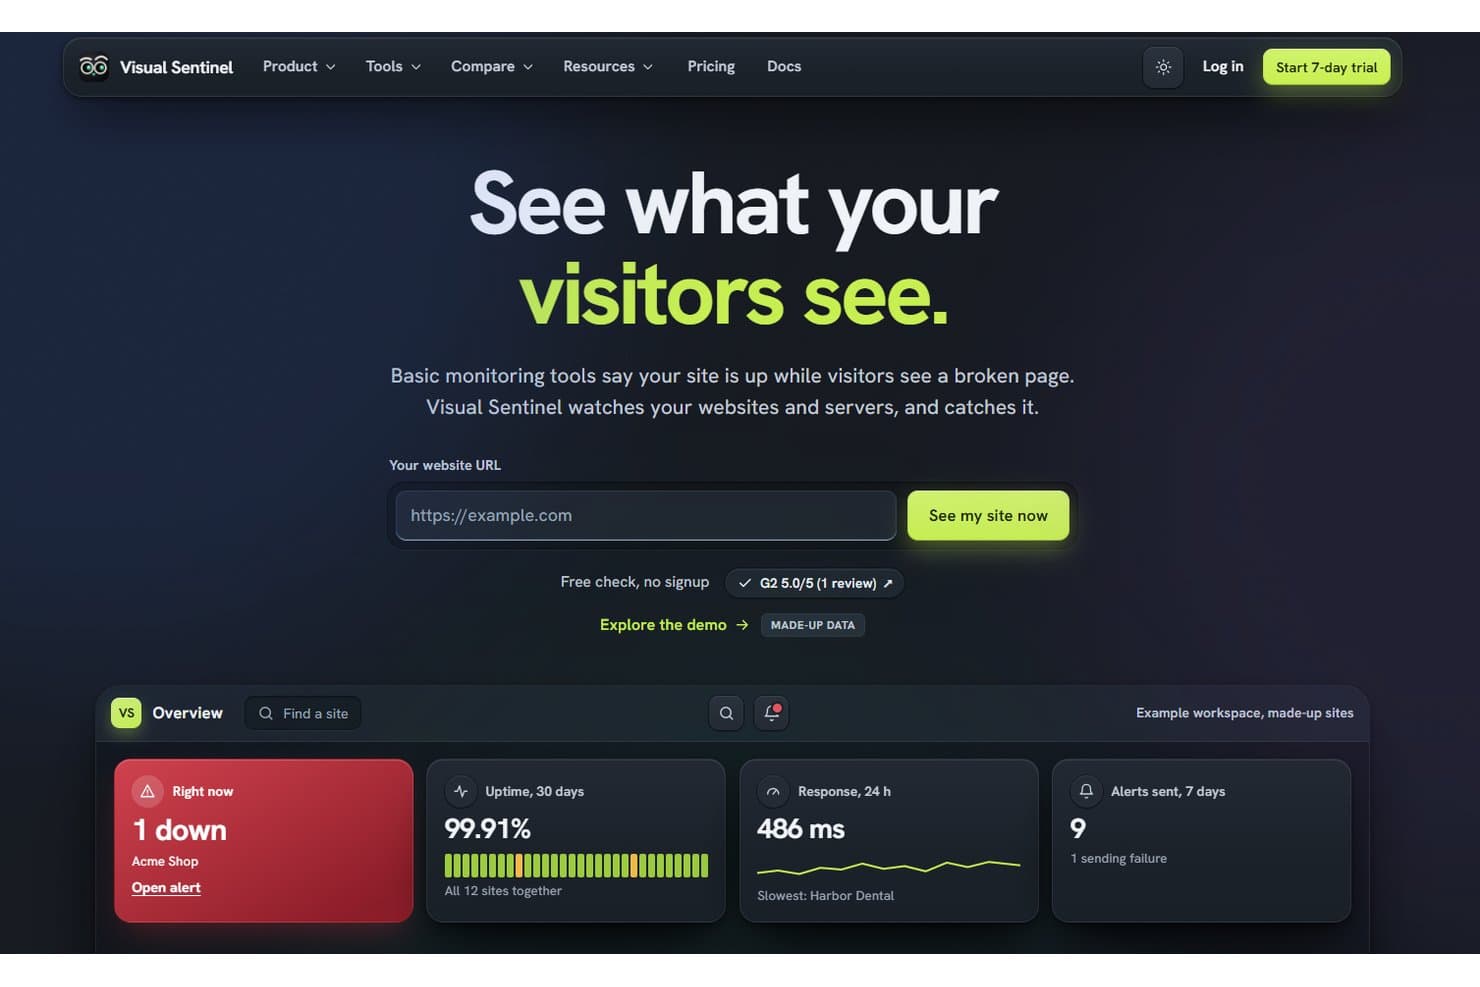
Visual Sentinel monitors websites and alerts users when visitors see broken pages. Visual Sentinel is a website monitoring tool that combines uptime, performance, SSL, DNS, visual, and content checks into a single monitor, with alerts routed across 11 channels including PagerDuty, OpsGenie, and Slack.
Who Is Visual Sentinel Best For?
Visual Sentinel is a strong fit for web agencies and freelancers managing multiple client sites who need visual and content change detection alongside uptime monitoring in one place.
Why I Picked Visual Sentinel
Visual Sentinel earns its spot on my shortlist because it goes beyond uptime checks to catch the failures that actually affect users: broken layouts, changed prices, and injected spam. I particularly like its pixel-level screenshot comparison, which renders pages in a real Chromium browser and flags visual regressions alongside a baseline. Pair that with CSS selector-based content tracking, and you can monitor a specific headline or call-to-action copy for unauthorized changes without any manual spot-checking.
Visual Sentinel Key Features
- Six-layer website monitoring: Each monitor combines uptime, performance, SSL, DNS, visual, and content checks into a single view.
- PagerDuty and OpsGenie integration: Alerts route directly to on-call schedules and escalation policies, with auto-resolution on recovery.
- Daily mobile Lighthouse results: Every paid monitor receives daily lab measurements including LCP, CLS, TTFB, and Total Blocking Time.
- MCP server for AI-agent workflows: A hosted Model Context Protocol server exposes over 100 tools for managing monitors, incidents, and status pages from AI assistants.
Visual Sentinel Integrations
Visual Sentinel offers native integrations with PagerDuty, OpsGenie, Slack, Microsoft Teams, Prometheus Alertmanager, Cloudflare, Google Analytics 4, and Google Search Console. Its REST API, OpenAPI 3.1 reference, webhooks, and MCP server support custom monitoring and incident workflows.
Pros and Cons
Pros:
- Reviewer reports less manual client-site checking
- Tracks selected text and injected-spam signals
- Pixel comparisons catch layout regressions
Cons:
- Dynamic pages may trigger screenshot false alerts
- Five-minute checks on entry plans delay detection
- Checks run from EU and US only
Learn more about Visual Sentinel: Best for global reach with 110+ locations
- Free plan + 30-day trial + demo available
- From $10/month
Visit WebsiteCustomer Rating:4.7/5
Site24x7's main result page that displays website response time metrics in graphical format Site24x7 offers comprehensive web application monitoring from a user's perspective, ensuring website performance from multiple geographical locations. Its standout feature is its presence across 110+ global locations, enabling businesses to monitor their website's performance and uptime from virtually anywhere in the world.
Why I Picked Site24x7: In choosing tools, the extensive global presence of Site24x7 became evident as a unique selling point. After judging and comparing various monitoring solutions, I formed the opinion that Site24x7's expansive reach offers an unparalleled advantage, especially for businesses targeting a worldwide audience. For companies that value global coverage, Site24x7 is clearly the optimal choice.
Standout Features & Integrations:
Site24x7 not only monitors websites but also applications, servers, and network infrastructure, ensuring all-around performance insights. Real User Monitoring (RUM) and Application Performance Monitoring (APM) are some of its key features, providing insights into real users' experiences and the application's backend performance.
Integration-wise, Site24x7 is compatible with popular platforms like AWS, Microsoft Azure, and Google Cloud, allowing for a comprehensive view of cloud resource performance.
Pros and Cons
Pros:
- Extensive cloud platform integrations
- Comprehensive suite of tools including RUM and APM
- Wide global monitoring presence with 110+ locations
Cons:
- Additional features can incur extra costs
- Limitations on the number of monitors in the base plan
- Interface might be complex for beginners
Learn more about Site24x7: Best for SSL monitoring
- Free plan + free demo available
- From $8/10 monitors/month (billed annually)
Visit WebsiteCustomer Rating:4.7/5
UptimeRobot tracks uptime and SSL certificate status in one dashboard. For teams seeking a reliable website monitoring tool, UptimeRobot offers a practical solution that supports SSL monitoring alongside uptime checks. It’s well-suited for teams such as developers, DevOps, and marketers who need consistent visibility into site availability and security status. By helping detect issues such as certificate expirations, downtime, and slow response times, UptimeRobot supports a stable, dependable online presence.
Why I Picked UptimeRobot
I picked UptimeRobot for its SSL monitoring, which helps teams stay ahead of certificate issues before they affect site access. It alerts you when certificates are close to expiring, reducing the risk of unexpected security warnings or downtime. UptimeRobot also supports multi-location checks and real-time alerts through channels like email and Slack, making it easier to spot availability or performance issues across regions and respond quickly.
UptimeRobot Key Features
In addition to SSL monitoring, UptimeRobot offers:
- Cron Job Monitoring: This feature lets you track scheduled tasks and ensure they run at the right time.
- Customizable Status Pages: You can create and share status pages that reflect your brand and keep stakeholders informed during outages.
- Multi-Location Monitoring: This feature helps detect location-specific issues by checking website performance from different global points.
- Advanced Notification Settings: You can customize alerts based on outage severity and set up maintenance windows to avoid unnecessary alerts.
UptimeRobot Integrations
UptimeRobot offers various integrations to enhance your monitoring experience, including email, Slack, PagerDuty, Microsoft Teams, Telegram, Discord, Webhooks, Zapier, and API support for custom integrations.
Pros and Cons
Pros:
- Generous free plan for basic monitoring needs
- Real-time alerts via email, Slack, and other channels
- SSL monitoring alerts before certificates expire
Cons:
- Lower-tier plans have restricted monitoring intervals
- Limited performance diagnostics compared to advanced tools
Learn more about UptimeRobot:

Dynatrace application performance analysis Dynatrace is a software intelligence platform that offers application performance, cloud infrastructure monitoring, and digital experience insights. By harnessing the power of AI, it delivers real-time analytics to ensure optimal software and infrastructure health, which is pivotal for organizations seeking AI-driven insights.
Why I Picked Dynatrace: In my process of choosing software intelligence tools, Dynatrace stood out prominently. Its distinctive edge lies in its AI-powered analytics, which I found to be more advanced than many other platforms.
Judging by its capabilities, it's evident that Dynatrace is the best for businesses that require AI-driven analytics to bolster their software and infrastructure performance.
Standout Features & Integrations:
Dynatrace's AI engine automatically discovers and analyzes application dependencies, optimizing performance with minimal manual intervention. The platform's Digital Experience Monitoring captures user experiences across various channels, providing a holistic view of performance.
For integrations, Dynatrace is compatible with popular cloud providers like AWS, Azure, and Google Cloud, and it easily integrates with CI/CD tools like Jenkins.
Pros and Cons
Pros:
- Versatile integrations with both cloud providers and CI/CD tools
- Comprehensive monitoring across applications, cloud, and digital channels
- Advanced AI analytics for automatic problem discovery and resolution
Cons:
- Complex configurations may require specialized expertise
- The pricing can be high for smaller organizations
- Might require a steep learning curve for new users
 Best for real-time monitoring dashboards
- Free plan available
- From $15/month (billed annually)
Visit WebsiteCustomer Rating:4.5/5
Datadog's automated browser tests Datadog is a cloud-based monitoring and analytics platform, that assists businesses in visualizing the performance of their applications, tools, and services in real-time. Its strength lies in creating comprehensive, real-time dashboards that aggregate data from multiple sources, which aligns with the need for immediate insights and proactive responses.
Why I Picked Datadog: In the process of selecting tools for this list, Datadog emerged as a prime candidate due to its powerful dashboard capabilities. After comparing various platforms, I found that Datadog’s ability to provide immediate insights through dynamic visualizations made it distinct.
I determined that for organizations requiring real-time monitoring dashboards, Datadog stands out.
Standout Features & Integrations:
Datadog boasts an advanced anomaly detection system that pinpoints potential issues before they become significant problems. Additionally, it offers distributed tracing that aids in the identification of performance bottlenecks in microservice architectures.
When it comes to integrations, Datadog connects with a vast array of platforms, including AWS, Docker, Slack, and many more, consolidating data for enriched analysis.
Pros and Cons
Pros:
- Wide range of integrations with popular platforms
- Offers advanced anomaly detection
- Extensive real-time dashboard capabilities
Cons:
- Data retention limits for the base plan
- Pricing can become high with additional features
- Steeper learning curve for newcomers
 Best for hybrid infrastructure monitoring
- 15-day free trial + free demo available
- From $19/month
Visit WebsiteCustomer Rating:4.5/5
LogicMonitor website monitoring dashboard LogicMonitor presents a cloud-based platform designed to automate infrastructure monitoring. Catering to both on-premises and cloud environments, it recognizes the growing need for businesses to have a combined perspective on their entire IT landscape.
Why I Picked LogicMonitor: When determining which tool to include for infrastructure monitoring, LogicMonitor was a standout choice due to its extensive capabilities in handling both traditional and modern IT environments. In comparing numerous solutions, I judged that LogicMonitor's ability to offer insights into both on-premises and cloud infrastructure was particularly commendable.
This intrinsic capability makes it best suited for businesses transitioning to or balancing between cloud and on-premises setups.
Standout Features & Integrations:
LogicMonitor shines with features such as automated device discovery and dynamic thresholding, which facilitate proactive issue detection. Furthermore, it boasts a library of over 2000 integrations, ensuring that it remains compatible with a vast array of devices and applications.
Among its most valued integrations are those with AWS, Azure, and VMware, covering both cloud and on-premises landscapes.
Pros and Cons
Pros:
- Extensive library of integrations
- Automated device discovery streamlines setup
- Supports monitoring of diverse infrastructure types
Cons:
- Initial setup can be complex for larger environments
- Some advanced features have a learning curve
- No flat-rate pricing is available publicly
Learn more about LogicMonitor: Best for real-time user interaction data
- Free plan available
- From $10/user/month
Visit WebsiteCustomer Rating:4.3/5
New Relic's monitoring dashboard provides a detailed overview of website performance and user experience. New Relic is a comprehensive observability platform designed to help you monitor, debug, and improve your entire software stack. By providing real-time insights into your applications and infrastructure, it enables you to identify and resolve issues swiftly, ensuring optimal performance and user satisfaction.
Why I Picked New Relic: I like its digital experience monitoring suite, which includes browser real-user monitoring and synthetics. Browser real-user monitoring provides insights into your users' actual experiences by tracking metrics like page load times and session traces. Synthetics allows you to simulate user interactions to proactively identify potential issues before they affect real users. Together, these tools empower you to maintain high website performance and reliability.
Standout Features & Integrations:
Other features include infrastructure monitoring, which offers visibility into your servers, containers, and cloud services, helping you maintain system health and performance. Log management centralizes your log data, making it easier to search and analyze logs for troubleshooting and auditing purposes.
Integrations include AWS, Google Cloud Platform, Microsoft Azure, Slack, Atlassian Jira, AWS EventBridge, Email Notifications, Mobile Push Notifications, Opsgenie, PagerDuty, ServiceNow, and Prometheus.
Pros and Cons
Pros:
- Provides real-time monitoring and insights
- Offers robust alerting features
- Integrates well with various platforms
Cons:
- The user interface can be overwhelming for new users
- Dashboards may require customization for specific use cases
Learn more about New Relic:
Outras ferramentas de monitorização de websites
Eis algumas opções adicionais de ferramentas de monitorização de websites que não entraram na minha lista restrita, mas que vale a pena conhecer:
- 11RaygunBest for real user experience insights
- 12UptrendsBest for monitoring web applications
- 13ThousandEyesBest for comprehensive web performance monitoring
- 14SematextBest for integrating server and website metrics
- 15UptimeBest for detailed reporting features
- 16ApicaBest for scalable performance testing
- 17Dotcom MonitorBest for real-world speed simulations
- 18GTmetrixGood for detailed website speed analysis
- 19CheckmkGood for versatile IT infrastructure monitoring
- 20MonSparkGood for proactive website performance insights
- 21Elastic ObservabilityGood for unified views across your tech stack
- 22Dotcom-MonitorGood for multi-faceted web service insights
- 23SolarWinds Website Performance Monitoring ToolGood for in-depth web performance metrics
Outras análises de ferramentas de monitorização
- Ferramentas de monitorização de infraestruturas na nuvem
- Ferramentas de monitorização de DevOps
- Software de monitorização de redes
How I Evaluate Website Monitoring Tools
I consider website monitoring tools across two layers: baseline requirements like sub-minute uptime checks and global probe coverage, and differentiators that matter to SREs managing production sites.
Core Functionality (Table Stakes For This List)
When I'm selecting tools for my list, I rank each one on a scale from 0 (does not offer the functionality) to 5 (excels in this area) for each core functionality listed below. Then, I calculate the tool's total score into a percentage. Each tool needs to achieve a minimum total score of 65% to be considered for inclusion.
- Alerting & Notifications: I look for multi-channel delivery—SMS, voice, push, email, Slack—with rule-based routing so the right on-call engineer gets paged, not the whole team.
- On-Call Scheduling & Escalation: Tools should support rotation types like follow-the-sun and weekly handoffs, plus multi-tier escalation policies with overrides for holidays and PTO.
- Incident Lifecycle Management: I evaluate how each tool tracks incidents from first alert through acknowledgment, investigation, and resolution, including severity-based workflow automation.
- Monitoring & ITSM Integrations: A tool's integration catalog matters. I check for native connections to platforms like Datadog, Prometheus, ServiceNow, Jira, and Slack with bidirectional sync.
- Collaboration & War Rooms: During a major outage, responders need auto-created incident channels, runbooks, and stakeholder broadcasts. I look at how each tool handles real-time coordination.
- Post-Incident Analytics: Postmortem templates, MTTA/MTTR dashboards, and timeline reconstruction help teams learn from incidents. I evaluate reporting depth and customization options.
Once I have a list of tools that meet the criteria, I consider what sets each platform apart.
Differentiating Factors (What Sets Vendors Apart)
Here's how I compare and contrast different vendors:
Standout Features
AI-powered incident intelligence is a major differentiator. When a deploy triggers a flood of alerts at 2 a.m., tools that auto-group related signals and suggest past resolutions cut triage time dramatically. I also evaluate auto-remediation capabilities—whether a platform can execute runbooks to restart a failing pod or scale resources before a human even opens their laptop. Service dependency mapping rounds out the picture. Knowing that a degraded database affects three downstream services helps responders prioritize the right fix first.
Beyond Features
Reliability matters more here than in almost any other software category. If your incident management platform goes down during a major outage, you're flying blind. I check each vendor's own public status page and historical uptime before anything else. Pricing structure also shapes my evaluation—per-responder models can get expensive fast when you rotate large on-call teams, so I look at how costs scale as headcount grows. Ecosystem extensibility is another factor. Teams that manage infrastructure as code need Terraform providers and open APIs, not just a list of native integrations.
Como escolher uma ferramenta de monitorização de websites
É fácil ficar atolado em listas extensas de funcionalidades e estruturas de preços complexas. Para o ajudar a manter o foco enquanto percorre o seu processo único de seleção de software, eis uma lista de fatores a ter em consideração:
| Fator | O que deve considerar |
|---|---|
| FatorEscalabilidade | O que deve considerarA ferramenta consegue acompanhar o crescimento do seu website? Certifique-se de que suporta um aumento do tráfego e necessidades adicionais de monitorização sem custos ou complexidade extra. |
| FatorIntegrações | O que deve considerarFunciona com os seus sistemas atuais? Verifique a compatibilidade com a sua atual pilha tecnológica para evitar problemas de integração e soluções alternativas adicionais. |
| FatorPersonalização | O que deve considerarPode adaptar os alertas e os painéis? Procure ferramentas que lhe permitam ajustar as definições de acordo com o fluxo de trabalho e as necessidades de elaboração de relatórios da sua equipa. |
| FatorFacilidade de utilização | O que deve considerarA interface é intuitiva? Uma ferramenta deve ser fácil de utilizar, permitindo que a sua equipa aceda rapidamente aos dados e os interprete sem formação extensa. |
| FatorImplementação e integração inicial | O que deve considerarCom que rapidez pode começar? Avalie o tempo de configuração, o suporte disponível e recursos como tutoriais ou modelos para facilitar a transição. |
| FatorCusto | O que deve considerarEnquadra-se no seu orçamento? Compare os modelos de preços, esteja atento a custos ocultos e considere os custos a longo prazo face aos benefícios, incluindo eventuais ofertas de avaliação gratuita. |
| FatorMedidas de segurança | O que deve considerarComo protege os seus dados? Certifique-se de que cumpre os seus padrões de segurança, disponibilizando funcionalidades como encriptação, atualizações regulares e cópias de segurança. |
O que é uma ferramenta de monitorização de websites?
Uma ferramenta de monitorização de websites é um software que acompanha e analisa o desempenho e o tempo de atividade dos websites. Os profissionais de TI, os programadores web e os administradores de sites utilizam normalmente estas ferramentas para garantir que os seus sites funcionam de forma estável e eficiente. A monitorização do tempo de atividade, a análise da velocidade de carregamento e as notificações de alertas ajudam a identificar problemas e a manter um desempenho ideal. No geral, estas ferramentas proporcionam tranquilidade, garantindo que os websites funcionam corretamente e de forma fiável.
Funcionalidades
Ao selecionar uma ferramenta de monitorização de websites, procure as seguintes funcionalidades essenciais que funcionam em conjunto com o software de monitorização de hardware:
- Monitorização do tempo de atividade: Acompanha a disponibilidade do seu website e alerta-o se este ficar indisponível, garantindo um tempo de inatividade mínimo.
- Acompanhamento do tempo de resposta: Mede a rapidez com que o seu website responde aos pedidos dos utilizadores, ajudando a manter uma experiência de utilização rápida.
- Notificações de alertas: Envia alertas por e-mail, SMS ou outros canais quando são detetados problemas, para que possa agir rapidamente.
- Relatórios de desempenho: Fornece relatórios detalhados sobre o desempenho do website, permitindo tomar decisões baseadas em dados para efetuar melhorias.
- Monitorização em várias localizações: Verifica a disponibilidade do seu website a partir de diferentes localizações geográficas, garantindo a acessibilidade a nível mundial.
- Painéis de controlo personalizáveis: Permite adaptar as vistas dos dados às necessidades da sua equipa, facilitando a compreensão das informações.
- Análise avançada: Oferece informações mais aprofundadas sobre as tendências de desempenho, ajudando a identificar e resolver potenciais problemas.
- Acesso à API: Integra os dados de monitorização com outros sistemas, permitindo criar um ambiente tecnológico coeso.
- Armazenamento de dados históricos: Mantém registos de dados de desempenho anteriores, ajudando na análise e no planeamento a longo prazo.
- Monitorização sintética: Simula as interações dos utilizadores para detetar potenciais problemas antes de estes afetarem os utilizadores reais.
Benefícios
A implementação de uma ferramenta de monitorização de websites proporciona vários benefícios à sua equipa e à sua empresa. Eis alguns dos benefícios que pode esperar:
- Maior tempo de atividade: Ao receber alertas instantâneos, pode resolver rapidamente os problemas e manter o seu website a funcionar sem problemas.
- Resolução mais rápida de problemas: Com o acompanhamento do tempo de resposta, pode localizar as lentidões e corrigi-las antes de afetarem os utilizadores.
- Experiência de utilização melhorada: As ferramentas de monitorização garantem que o seu site é rápido e acessível, mantendo os visitantes satisfeitos.
- Informações baseadas em dados: Os relatórios de desempenho e a análise avançada fornecem informações valiosas para otimizar o seu website.
- Alcance global: A monitorização em várias localizações garante a disponibilidade do seu site em todo o mundo, aumentando o seu público.
- Tomada de decisões informada: O armazenamento de dados históricos permite analisar tendências e planear melhorias com base no desempenho anterior.
- Resolução proativa de problemas: A monitorização sintética ajuda a identificar potenciais problemas antes de estes afetarem os utilizadores reais, reduzindo futuras interrupções.
Custos e preços
A seleção de uma ferramenta de monitorização de websites exige uma compreensão dos vários modelos de preços e planos disponíveis. Os custos variam consoante as funcionalidades, o tamanho da equipa, os complementos e outros fatores. A tabela abaixo resume os planos mais comuns, os respetivos preços médios e as funcionalidades normalmente incluídas nas soluções de ferramentas de monitorização de websites:
Tabela de comparação de planos para ferramentas de monitorização de websites
| Tipo de plano | Preço médio | Funcionalidades comuns |
|---|---|---|
| Tipo de planoPlano gratuito | Preço médio$0 | Funcionalidades comunsMonitorização básica do tempo de atividade, notificações de alertas limitadas e armazenamento de dados restrito. |
| Tipo de planoPlano pessoal | Preço médio$5-$25/utilizador/mês | Funcionalidades comunsAcompanhamento do tempo de atividade e do tempo de resposta, alertas personalizáveis e relatórios de desempenho. |
| Tipo de planoPlano empresarial | Preço médio$50-$100/utilizador/mês | Funcionalidades comunsMonitorização em várias localizações, análise avançada e acesso à API. |
| Tipo de planoPlano empresarial de grande dimensão | Preço médio$200-$500/utilizador/mês | Funcionalidades comunsPainéis de controlo personalizáveis, monitorização sintética, suporte abrangente e armazenamento extensivo de dados históricos. |
Perguntas frequentes sobre a ferramenta de monitorização de sites
Aqui estão algumas respostas a perguntas comuns sobre ferramentas de monitorização de sites:
Como é que a indisponibilidade do site afeta o meu negócio?
A indisponibilidade do site pode levar à perda de receitas, prejudicar a reputação da sua marca e diminuir a satisfação dos clientes. Mesmo as interrupções breves podem frustrar os utilizadores e levá-los a procurar alternativas. A monitorização regular ajuda-o a resolver rapidamente os problemas e a minimizar estes impactos.
Quais são os códigos de erro comuns que devo monitorizar?
Os códigos de erro comuns incluem 404 (não encontrado), 401 (não autorizado) e 500 (erro interno do servidor). Monitorizá-los ajuda-o a identificar problemas como ligações danificadas, tentativas de acesso não autorizado e problemas do servidor que requerem atenção imediata.
Como funcionam as notificações de alerta?
As notificações de alerta informam-no sobre problemas como indisponibilidade ou reduções de desempenho. Pode receber alertas por e-mail, SMS ou através de outros métodos. A configuração destes alertas garante que toma conhecimento dos problemas assim que ocorrem, permitindo uma resolução rápida.
O que é a monitorização do servidor e por que motivo é importante?
A monitorização do servidor acompanha o desempenho dos recursos do seu servidor, como a CPU, a RAM e a utilização do disco. Ajuda-o a detetar e resolver potenciais problemas antes de estes afetarem o desempenho do site, garantindo que este permanece acessível e responsivo.
Como pode a monitorização de SSL beneficiar o meu site?
A monitorização de SSL verifica a validade e a data de expiração dos seus certificados SSL. Garante ligações seguras para os utilizadores e evita problemas como certificados expirados, que podem provocar avisos de falta de confiança e potenciais violações de dados.
O que é a funcionalidade de correspondência de conteúdo na monitorização de sites?
A funcionalidade de correspondência de conteúdo verifica se o seu site contém cadeias de texto ou conteúdo específicos. É útil para garantir que as informações essenciais são apresentadas corretamente e não foram alteradas, ajudando a manter a integridade e a fiabilidade do seu site.