Le 10 migliori alternative a Nagios recensite nel 2026

Migliori alternative a Nagios: la shortlist


Le migliori alternative a Nagios aiutano i team a monitorare i sistemi senza la necessità di procedure di configurazione complesse o il rischio di imbattersi in limiti di scalabilità. Offrono dashboard più chiare, configurazioni più semplici e integrazioni flessibili che facilitano il monitoraggio delle prestazioni su server, reti e applicazioni.
Molte organizzazioni iniziano a cercare alternative dopo aver avuto problemi come la configurazione di plug-in Nagios che non si integrano correttamente, la perdita di tempo nella risoluzione di messaggi di errore criptici o il raggiungimento di limiti di prestazioni man mano che aumentano le necessità di monitoraggio. Queste difficoltà rallentano le operazioni e rendono più complesso per i team IT mantenere la visibilità su larga scala.
Ho testato piattaforme di monitoraggio in ambienti di produzione reale, lavorato con team che hanno migrato da implementazioni Nagios legacy e valutato come questi strumenti si comportano su infrastrutture ibride e cloud. Queste esperienze mi hanno permesso di capire quali soluzioni riducono realmente il carico di lavoro sul monitoraggio e quali creano nuove complessità.
In questa guida vedrai quali alternative a Nagios offrono una configurazione più semplice, una migliore scalabilità e insight più azionabili, così il tuo team potrà concentrarsi sulla risoluzione dei problemi invece che sulla gestione del sistema di monitoraggio.
Che cos'è Nagios?
Nagios è una piattaforma open source di monitoraggio e gestione della rete progettata per il monitoraggio di sistemi e infrastrutture. I professionisti IT e gli amministratori di sistema la utilizzano generalmente per tenere sotto controllo l'infrastruttura critica e garantire operatività senza interruzioni.
Le sue funzionalità di alerting, reportistica e monitoraggio ti aiutano a individuare problemi, analizzare le prestazioni e gestire efficacemente le risorse di rete. In generale, Nagios offre valore aiutando il tuo team a mantenere la stabilità dei sistemi e a ridurre i tempi di inattività.
Riepilogo migliori alternative a Nagios
Questa tabella di confronto riassume i dettagli dei prezzi delle principali alternative a Nagios che ho selezionato, per aiutarti a trovare quella più adatta al tuo budget e alle esigenze della tua azienda.
| Tool | Best For | Trial Info | Price | ||
|---|---|---|---|---|---|
| 1 | Ideale per infrastrutture IT complesse | Piano gratuito disponibile | Prezzi su richiesta | Website | |
| 2 | Ideale per il monitoraggio multi-cloud | Prova gratuita di 30 giorni + demo gratuita disponibile | Da $10/mese (fatturato annualmente) | Website | |
| 3 | Ideale per il monitoraggio delle applicazioni web | Prova gratuita di 30 giorni + piano gratuito + demo gratuita disponibile | Da $19.99/mese | Website | |
| 4 | Ideale per configurazioni plug-and-play | Demo gratuita disponibile | Prezzo su richiesta | Website | |
| 5 | Ideale per l’osservabilità completa dello stack | Prova gratuita di 14 giorni | A partire da $5/mese | Website | |
| 6 | Ideale per le capacità di creazione di grafici | Download gratuito | Gratuito | Website | |
| 7 | Ideale per AIOps e osservabilità | Demo gratuita disponibile | Prezzo su richiesta | Website | |
| 8 | Ideale per il monitoraggio end-to-end | Prova gratuita di 7 giorni | Prezzi su richiesta | Website | |
| 9 | Ideale per reti distribuite | Consulenza gratuita disponibile | Prezzo su richiesta | Website | |
| 10 | Ideale per un monitoraggio leggero | Piano gratuito disponibile | Prezzi su richiesta | Website |
Perché Fidarti delle Nostre Recensioni Software
Testiamo e recensiamo software dal 2023. Come leader tecnologici, sappiamo quanto sia cruciale e difficile prendere la decisione giusta nella scelta di un software.
Investiamo in una ricerca approfondita per aiutare il nostro pubblico a effettuare scelte migliori di acquisto software. Abbiamo testato oltre 2.000 strumenti per diversi casi d’uso tecnologici e scritto più di 1.000 recensioni complete. Scopri come restiamo trasparenti e la nostra metodologia di recensione del software.
-

TestDevLab
Visit Website -
Site24x7
Visit WebsiteThis is an aggregated rating for this tool including ratings from Crozdesk users and ratings from other sites.4.7 -
GitHub Actions
Visit WebsiteThis is an aggregated rating for this tool including ratings from Crozdesk users and ratings from other sites.4.8


Recensioni delle migliori alternative a Nagios
Di seguito trovi le mie recensioni approfondite delle migliori alternative a Nagios incluse nella mia shortlist. Le mie recensioni ti offrono una panoramica dettagliata delle funzionalità principali, pro e contro, integrazioni e casi d’uso ideali di ciascun tool, per aiutarti a trovare quello giusto per te.
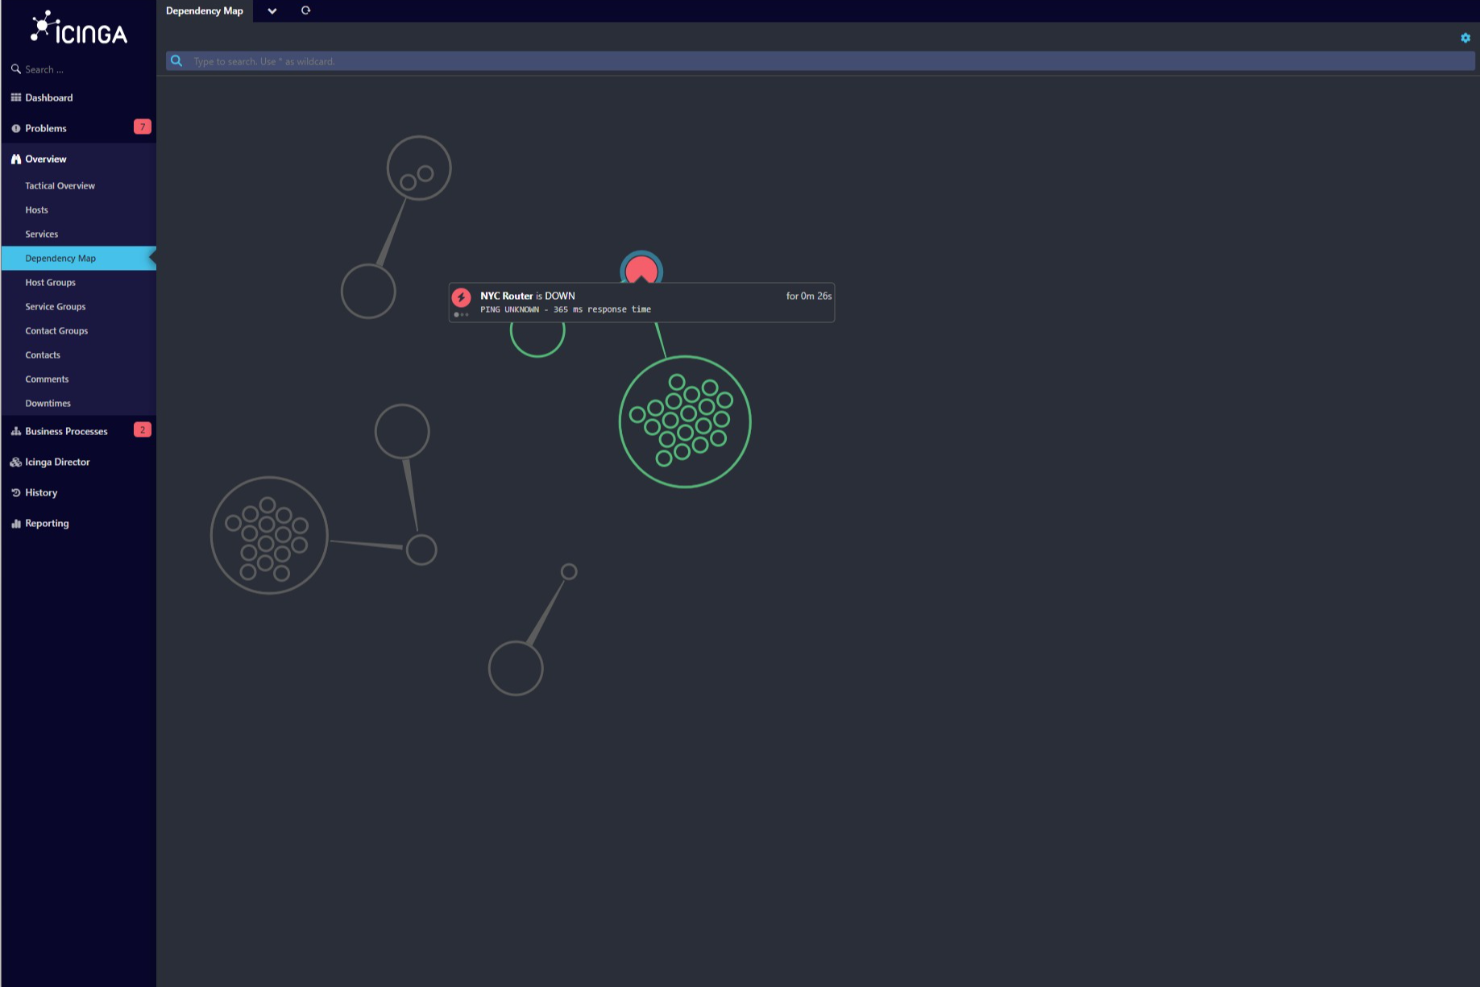
Icinga è una soluzione di monitoraggio open-source progettata per infrastrutture IT complesse, utilizzata principalmente da professionisti IT e organizzazioni. Monitora server, reti, applicazioni e ambienti cloud.
Perché è una buona alternativa a Nagios: Icinga eccelle negli ambienti IT complessi grazie al monitoraggio dell'infrastruttura, all'automazione e alle notifiche. Offre monitoraggio specializzato per Kubernetes, database e VMware, rendendolo ideale per ambienti articolati. Le sue funzionalità di analisi e gestione di metriche/log aiutano il tuo team a ottenere approfondimenti. La piattaforma si integra anche con strumenti di gestione dei servizi IT, aumentando la sua utilità.
Funzionalità e integrazioni principali:
Funzionalità includono monitoraggio dell'infrastruttura, automazione e monitoraggio cloud. Offre inoltre analisi e gestione di metriche/log, supportando monitoraggi specializzati per Kubernetes, database e VMware.
Integrazioni includono Puppet, Ansible, Chef, SaltStack, Grafana, Graylog, Elasticsearch, InfluxDB, Jira e Slack.
Pros and Cons
Pros:
- Flessibilità open-source
- Supporta ambienti complessi
- Compatibilità con plugin Nagios
Cons:
- Curva di apprendimento più ripida
- Richiede competenze tecniche
New Product Updates from Icinga

Icinga Adds TOTP Two-Factor Authentication to Icinga Web
Icinga added time-based one-time password (TOTP) two-factor authentication to Icinga Web, helping organizations strengthen login security with an additional verification step. For more information, visit Icinga’s official site.
 .
.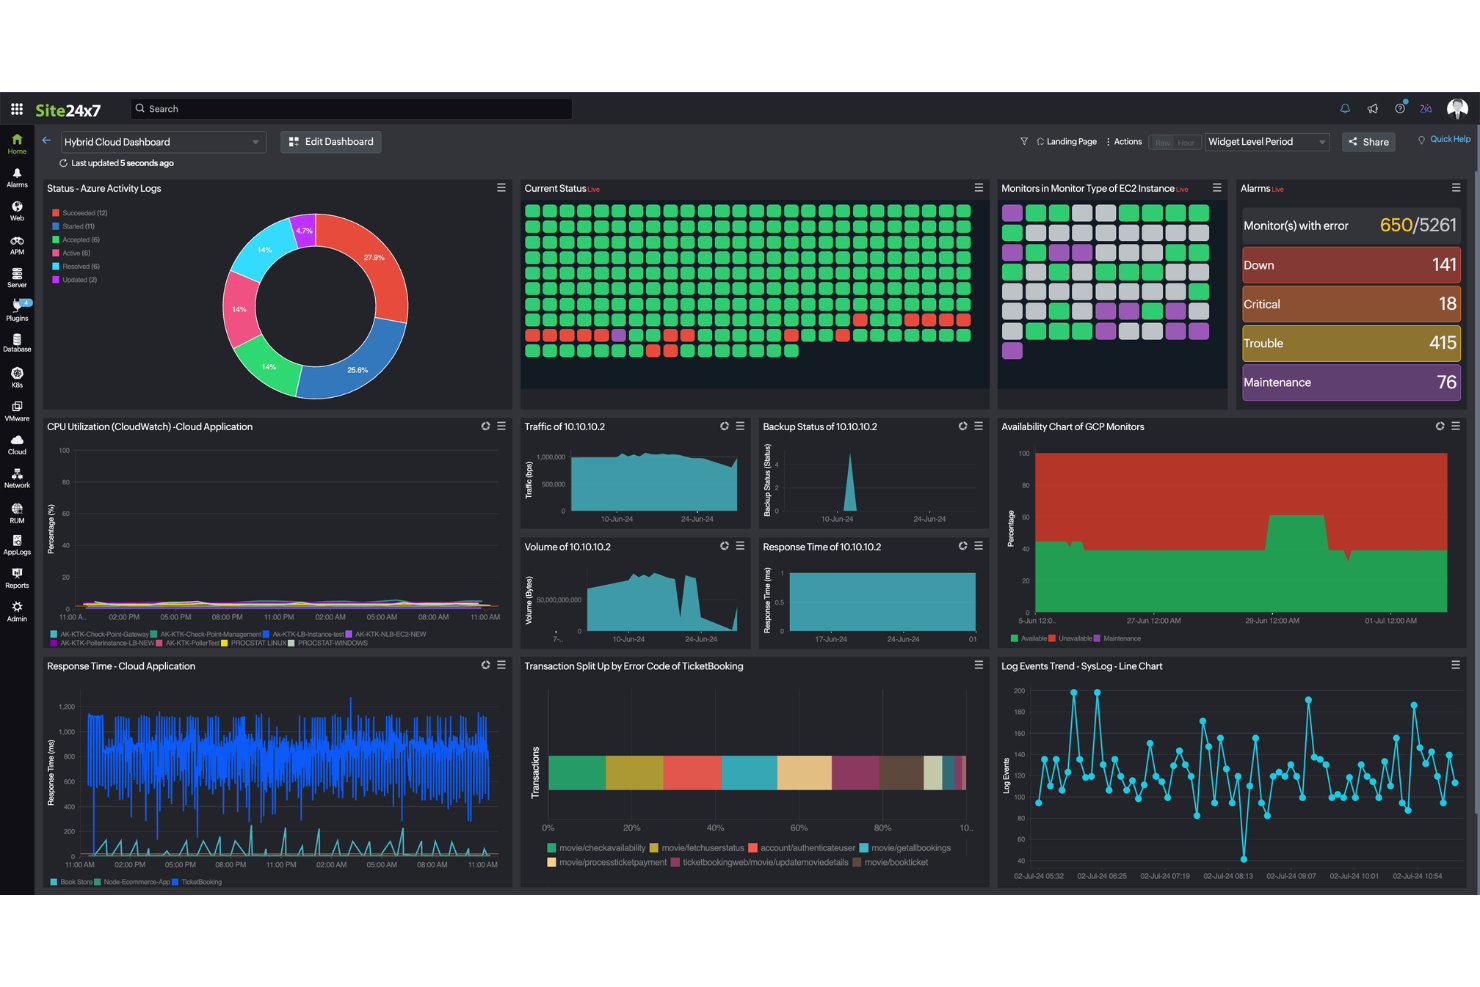
Per le aziende che cercano un'alternativa affidabile a Nagios, Site24x7 offre una combinazione convincente di capacità di monitoraggio e funzionalità intuitive. Questa soluzione basata su cloud è ideale per professionisti IT e organizzazioni che necessitano di un monitoraggio esteso di server, reti, applicazioni e siti web in diversi ambienti. Site24x7 risolve sfide come la gestione di ambienti multi-cloud e l'automazione delle attività ripetitive, offrendo un modo conveniente per monitorare l'infrastruttura IT con un unico piano.
Perché ho scelto Site24x7
Ho scelto Site24x7 come una delle migliori alternative a Nagios per le sue affidabili capacità di monitoraggio multi-cloud e le funzioni di automazione. Con Site24x7 puoi monitorare senza problemi ambienti come AWS, Azure e GCP da un'unica console, semplificando la gestione di infrastrutture complesse. Inoltre, l'automazione delle attività ripetitive da parte della piattaforma aiuta a ridurre il lavoro manuale, consentendo al tuo team di concentrarsi su iniziative più strategiche. Queste funzionalità sono fondamentali per le organizzazioni che desiderano aumentare l'efficienza e ottimizzare i processi di monitoraggio.
Funzionalità principali di Site24x7
Oltre al monitoraggio multi-cloud e all'automazione, Site24x7 offre:
- Gestione dei log: Fornisce informazioni su tutto il tuo stack tecnologico per un'analisi e una risoluzione dei problemi ottimizzata.
- Monitoraggio delle API: Garantisce il corretto funzionamento delle API per mantenere l'affidabilità dei servizi.
- Pagine di stato: Consente di creare pagine personalizzabili per comunicare i tempi di inattività e rafforzare la fiducia degli utenti.
- Gestione degli incidenti: Favorisce una gestione efficiente degli incidenti grazie a una documentazione dettagliata, inclusi log degli errori e cronologie.
Integrazioni di Site24x7
Le integrazioni includono AWS, Azure, Google Cloud Platform, Docker, Kubernetes, Microsoft Exchange, Microsoft SharePoint e altro ancora.
Pros and Cons
Pros:
- Monitoraggio completo per diversi sistemi
- Monitoraggio full-stack con AI a supporto della gestione di infrastrutture multicloud
- Monitoraggio flessibile che si integra facilmente con molteplici componenti dell'infrastruttura
Cons:
- Bug negli avvisi causano problemi quando si aggiungono nuove configurazioni di monitoraggio
- Configurazione complessa che rallenta la messa in funzione iniziale e la comprensione della piattaforma
New Product Updates from Site24x7

Site24x7 Adds Discovery Issues for AWS Monitoring
Site24x7 added Discovery Issues for AWS monitoring, helping teams identify why resources are not being discovered across services and regions. The feature surfaces permission gaps, policy restrictions, and blocked API actions to support faster troubleshooting. For more information, visit Site24x7’s official site.
 .
.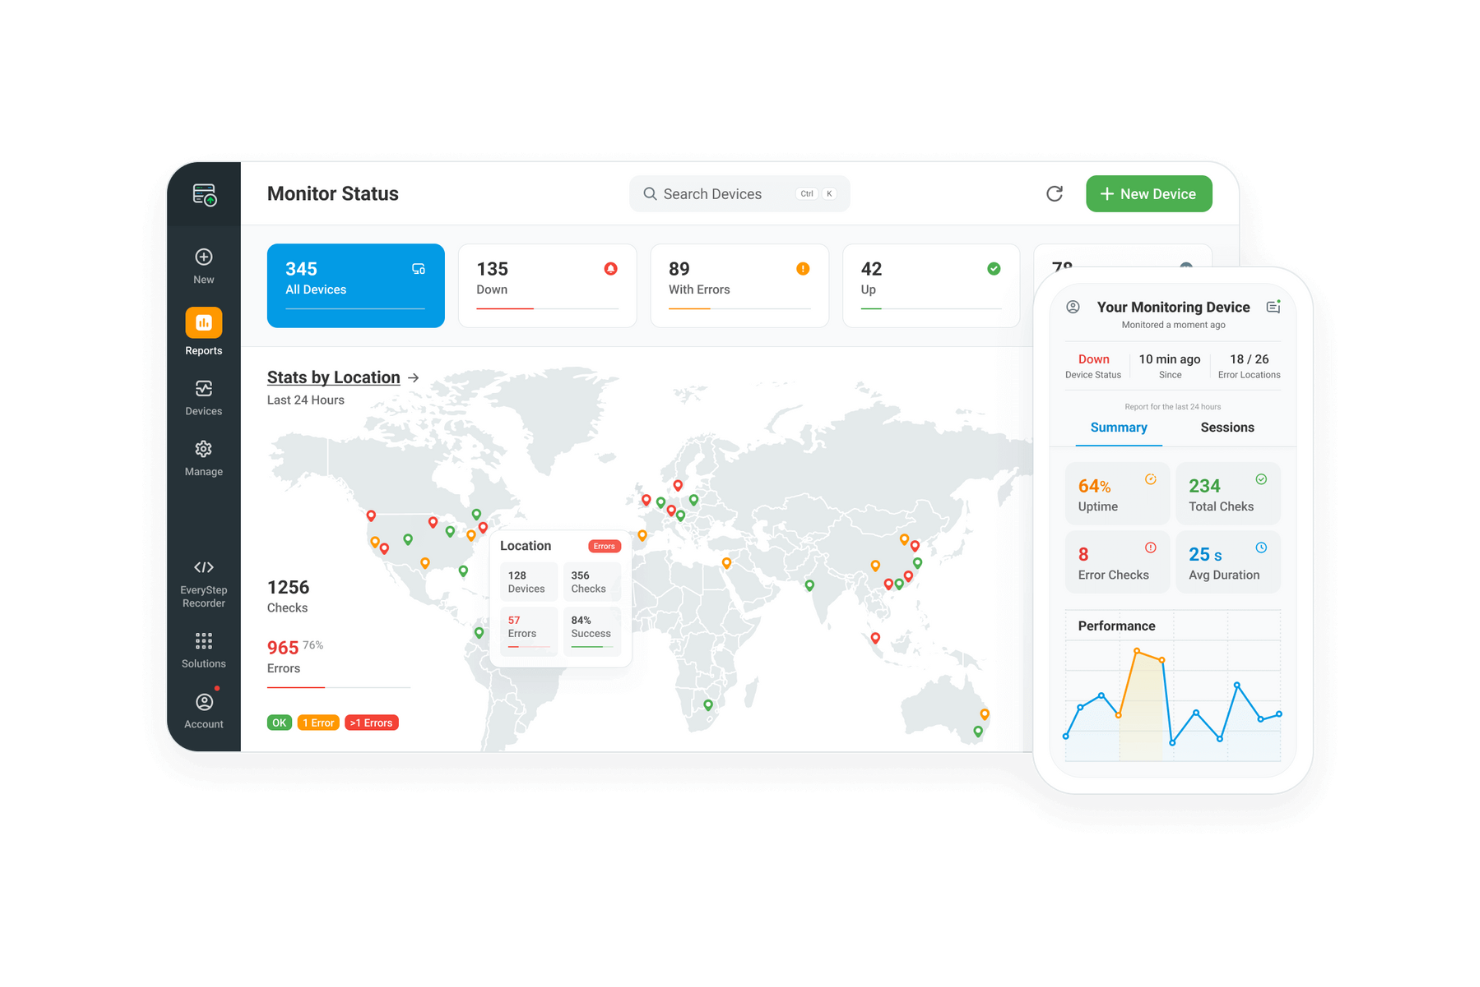
Dotcom-Monitor è uno strumento di monitoraggio delle prestazioni web rivolto a sviluppatori, team IT e marketer digitali. Aiuta a garantire la disponibilità, le prestazioni e la funzionalità dei siti web.
Perché è una buona alternativa a Nagios: Dotcom-Monitor è specializzato nel monitoraggio delle applicazioni web, offrendo approfondimenti sulle prestazioni in tempo reale. Le sue capacità di monitoraggio sintetico permettono al tuo team di simulare le interazioni degli utenti e rilevare problemi in modo proattivo. Lo strumento fornisce report completi per aiutarti a comprendere le tendenze delle prestazioni nel tempo. Grazie al focus sul monitoraggio delle applicazioni web, offre un approccio specializzato che si differenzia dalle capacità di monitoraggio generali di Nagios.
Funzionalità e integrazioni principali:
Funzionalità includono il monitoraggio sintetico che simula le interazioni degli utenti per rilevare i problemi prima che colpiscano gli utenti reali. Offre inoltre report approfonditi per aiutarti a comprendere le tendenze delle prestazioni nel tempo. Gli approfondimenti sulle prestazioni in tempo reale garantiscono la possibilità di risolvere tempestivamente i problemi.
Integrazioni includono Amazon Web Services, Microsoft Azure, Google Cloud Platform, Jenkins, PagerDuty, Slack, Splunk, New Relic, ServiceNow e Atlassian Jira.
Pros and Cons
Pros:
- Monitoraggio specializzato delle applicazioni web
- Approfondimenti sulle prestazioni in tempo reale
- Reportistica dettagliata
Cons:
- Richiede alcune competenze tecniche
- Limitato alle applicazioni web

Munin è uno strumento di monitoraggio delle risorse in rete progettato per amministratori di sistema e professionisti IT. Fornisce informazioni sulle prestazioni del sistema e sull'utilizzo delle risorse.
Perché è una valida alternativa a Nagios: Munin offre un'impostazione plug-and-play semplice, che permette al tuo team di iniziare rapidamente il monitoraggio. Crea automaticamente grafici per i dati sulle prestazioni, consentendoti di visualizzare facilmente le tendenze. Lo strumento è leggero, riducendo il consumo di risorse sui tuoi sistemi. La sua facilità d'uso e la configurazione minima lo rendono una scelta pratica per chi cerca un'alternativa semplice a Nagios.
Funzionalità principali e integrazioni:
Funzionalità includono la creazione automatica dei grafici, che ti aiuta a visualizzare le tendenze dei dati nel tempo. Supporta inoltre un'architettura leggera, minimizzando il consumo di risorse di sistema. Il semplice processo di configurazione ti permette di iniziare rapidamente senza dover affrontare impostazioni complesse.
Integrazioni includono Nagios, Cacti, Zabbix, Graphite, InfluxDB, Prometheus, Elasticsearch, Grafana, Jenkins e Docker.
Pros and Cons
Pros:
- Procedura di configurazione semplice
- Architettura leggera
- Creazione automatica dei grafici
Cons:
- Scalabilità limitata
- Set di funzionalità di base

Sematext è una piattaforma cloud per il monitoraggio e la gestione dei log, pensata per sviluppatori, team IT e DevOps. Fornisce informazioni sulle prestazioni delle applicazioni, monitoraggio dell'infrastruttura e gestione dei log.
Perché è una valida alternativa a Nagios: Sematext offre visibilità completa su tutto lo stack, permettendo al tuo team di monitorare applicazioni, infrastruttura e log in un'unica piattaforma. Le sue analisi in tempo reale aiutano a individuare rapidamente problemi di prestazioni. Le dashboard intuitive consentono di visualizzare i dati e monitorare facilmente le metriche. Con funzionalità di monitoraggio complete, Sematext propone un approccio più integrato rispetto a Nagios.
Funzionalità e integrazioni principali:
Funzionalità includono analisi in tempo reale che aiutano il tuo team a identificare rapidamente i problemi. Le dashboard intuitive rendono la visualizzazione dei dati semplice, permettendo di monitorare facilmente le metriche. Le sue capacità di monitoraggio complete offrono una panoramica totale sui sistemi.
Integrazioni includono AWS, Azure, Google Cloud Platform, Kubernetes, Docker, Elasticsearch, Apache Kafka, NGINX, Redis e MySQL.
Pros and Cons
Pros:
- Osservabilità completa dello stack
- Analisi in tempo reale
- Dashboard intuitive
Cons:
- Richiede curva di apprendimento
- Funzionalità offline limitate
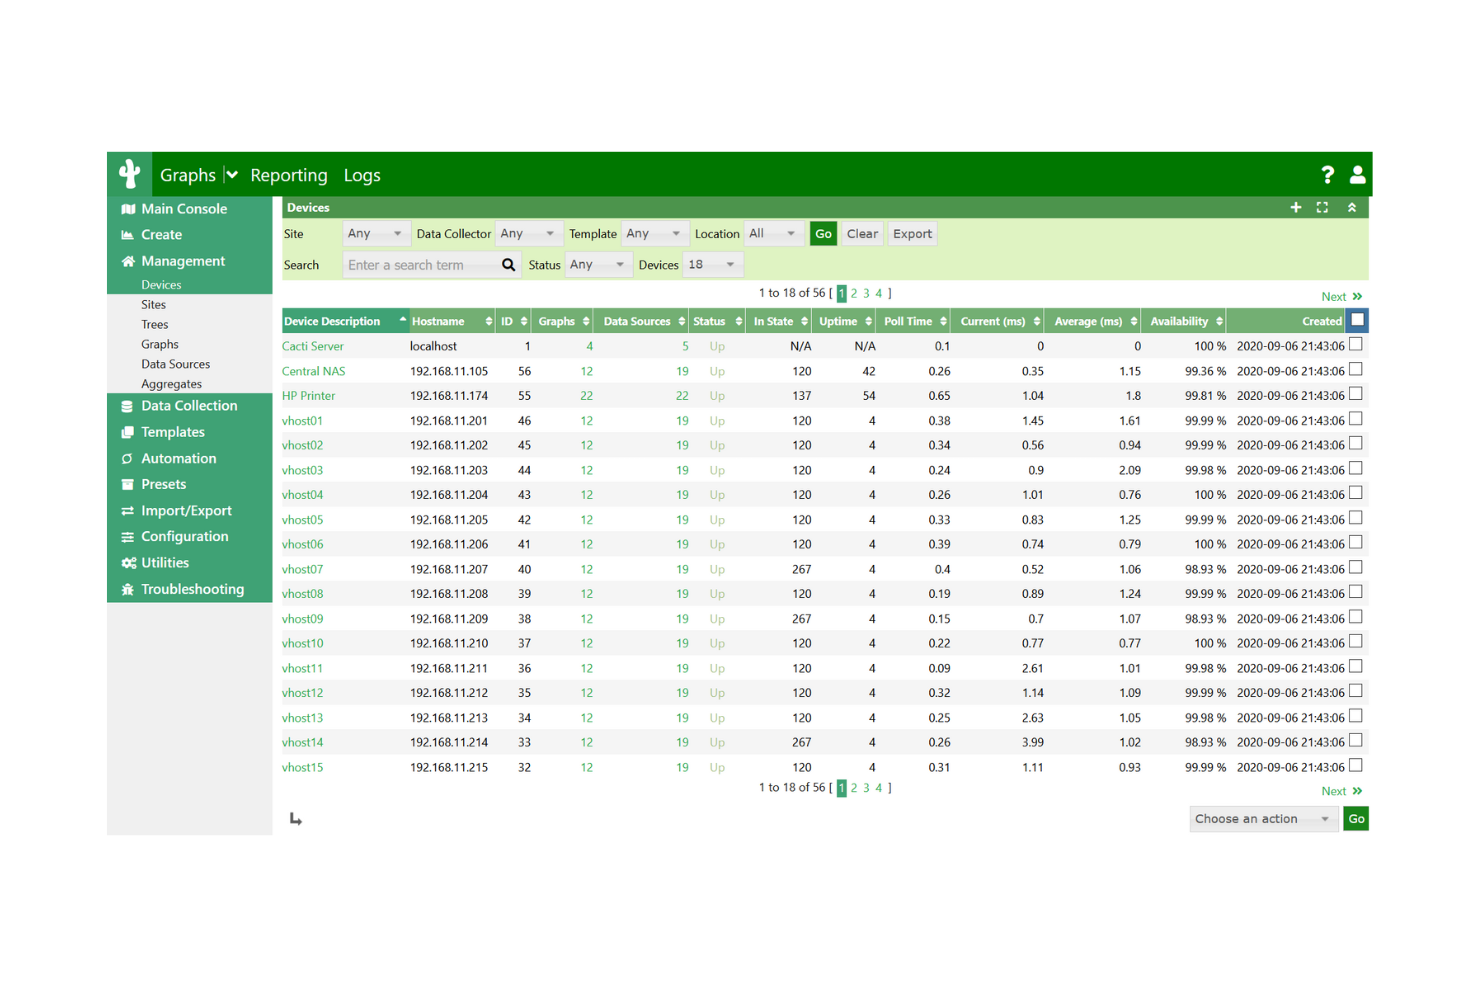
Cacti è uno strumento di monitoraggio e creazione di grafici di rete progettato per amministratori IT e responsabili di rete. Fornisce visualizzazioni dettagliate dei dati di rete e delle prestazioni dei sistemi.
Perché è una buona alternativa a Nagios: Cacti eccelle nelle funzionalità di creazione di grafici, permettendo di realizzare rappresentazioni visive dettagliate dei dati di rete. La sua interfaccia intuitiva rende semplice la configurazione e la gestione dei grafici, anche per set di dati complessi. Lo strumento supporta la raccolta dati tramite SNMP, aumentando la precisione dei grafici. Con il suo focus sulla visualizzazione, Cacti offre un vantaggio distintivo per i team che necessitano di insight chiari e grafici sulle loro reti.
Caratteristiche e integrazioni principali:
Caratteristiche includono avanzate capacità di creazione di grafici che consentono di visualizzare facilmente dati complessi. Supporta SNMP per una raccolta dati precisa, migliorando l'accuratezza dei grafici. L'interfaccia intuitiva semplifica la configurazione e la gestione di queste visualizzazioni.
Integrazioni includono Nagios, InfluxDB, Graphite, Prometheus, Elasticsearch, Grafana, OpenNMS, Zabbix, SolarWinds e Splunk.
Pros and Cons
Pros:
- Eccellenti funzionalità di creazione di grafici
- Interfaccia intuitiva
- Supporta la raccolta dati SNMP
Cons:
- Scalabilità limitata
- Funzionalità di allerta di base
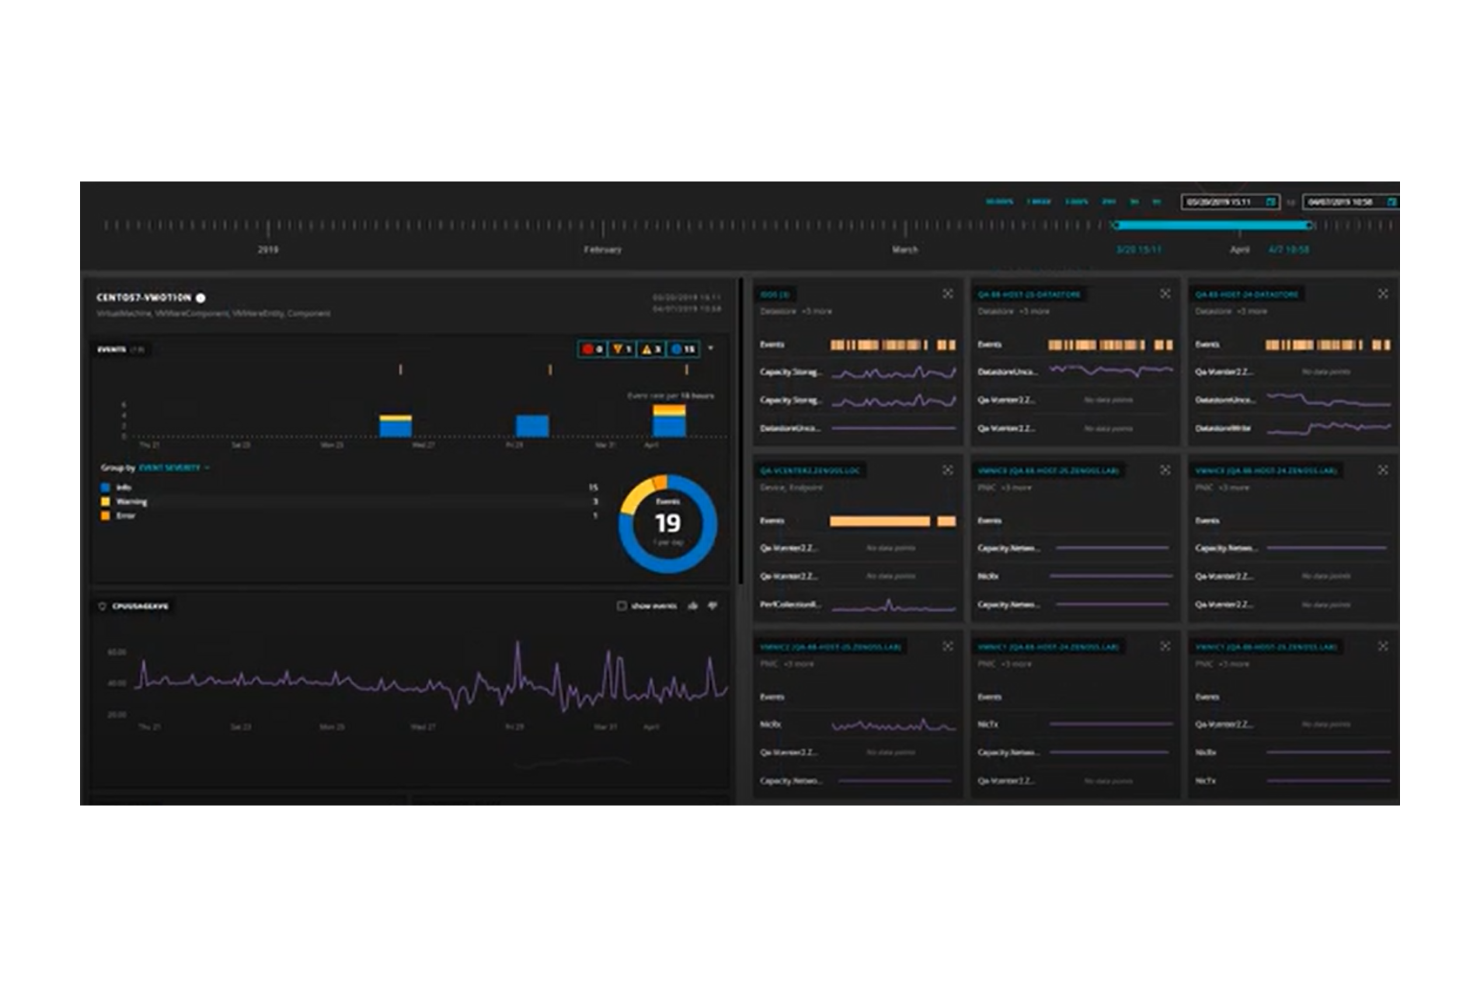
Zenoss Core è una piattaforma ibrida di monitoraggio IT e analisi progettata per i team di operazioni IT. Fornisce informazioni sulle prestazioni dell'infrastruttura e aiuta a rilevare e risolvere i problemi in tempo reale.
Perché è una buona alternativa a Nagios: Zenoss Core integra funzionalità AIOps, offrendo analisi avanzate per prevedere e prevenire problemi prima che possano influire sulle tue operazioni. Il monitoraggio in tempo reale garantisce una visione completa della tua infrastruttura, aiutando il tuo team a rispondere rapidamente agli incidenti. Le funzionalità di osservabilità della piattaforma ti consentono di monitorare le metriche di prestazione e ottenere informazioni sullo stato di salute del sistema. Con il suo focus su analisi e osservabilità, Zenoss Core offre un approccio più proattivo rispetto a Nagios.
Funzionalità principali & integrazioni:
Funzionalità includono analisi avanzate che aiutano a prevedere e prevenire potenziali problemi. Il monitoraggio in tempo reale offre una visibilità completa sulla tua infrastruttura. Le capacità di osservabilità della piattaforma assicurano un monitoraggio efficace delle metriche di prestazione e dello stato di salute del sistema.
Integrazioni includono Amazon Web Services, Microsoft Azure, Google Cloud Platform, VMware, Docker, Kubernetes, ServiceNow, Splunk, PagerDuty e Slack.
Pros and Cons
Pros:
- Capacità avanzate di analisi
- Monitoraggio in tempo reale
- Rilevamento proattivo dei problemi
Cons:
- Richiede competenze tecniche
- Complessità nell'impostazione iniziale

Centreon è una soluzione di monitoraggio IT progettata per le aziende che necessitano di una visibilità end-to-end, utilizzata principalmente dai team operativi IT. Monitora l'infrastruttura IT, le applicazioni e le reti per garantire prestazioni ottimali.
Perché è una buona alternativa a Nagios: Centreon offre un monitoraggio end-to-end con funzionalità come la scoperta automatica e dashboard centralizzate. Fornisce informazioni in tempo reale sul tuo ambiente IT, aiutando il team a identificare e risolvere rapidamente i problemi. La scalabilità della piattaforma supporta le aziende in crescita, permettendo di monitorare reti estese. La sua interfaccia intuitiva e gli avvisi personalizzabili facilitano l'adattamento del sistema alle tue esigenze.
Funzionalità principali & integrazioni:
Funzionalità includono la scoperta automatica, dashboard centralizzate e avvisi personalizzabili. Offre inoltre informazioni in tempo reale e scalabilità per sostenere la crescita aziendale.
Integrazioni includono Amazon Web Services, Microsoft Azure, Google Cloud Platform, Docker, Kubernetes, VMware, Cisco, Juniper, Slack e ServiceNow.
Pros and Cons
Pros:
- Visibilità end-to-end
- Funzione di scoperta automatica
- Scalabile per aziende in crescita
Cons:
- Richiede competenze tecniche
- Complessità nella configurazione iniziale

OpenNMS è una piattaforma open-source per la gestione delle reti, progettata per reti distribuite e utilizzata principalmente da amministratori di rete e professionisti IT. Offre monitoraggio della rete, gestione degli eventi e misurazione delle prestazioni.
Perché è una valida alternativa a Nagios: OpenNMS è pensato per reti distribuite con funzionalità come gestione degli eventi e monitoraggio dei servizi. Supporta implementazioni su larga scala, rendendolo ideale per la gestione di infrastrutture di rete complesse. La piattaforma offre raccolta e visualizzazione dei dati sulle prestazioni per aiutare il tuo team a gestire la salute della rete. La sua scalabilità e la capacità di gestire sistemi distribuiti la distinguono da Nagios.
Funzionalità e integrazioni principali:
Funzionalità includono gestione degli eventi, monitoraggio dei servizi e raccolta dei dati sulle prestazioni. Fornisce inoltre strumenti di visualizzazione per lo stato della rete e supporta implementazioni su larga scala per reti complesse.
Integrazioni comprendono Grafana, Elasticsearch, Prometheus, Kafka, PagerDuty, Slack, Jenkins, AWS, Azure e Google Cloud Platforms
Pros and Cons
Pros:
- Supporta reti su larga scala
- Flessibilità open-source
- Metriche dettagliate sulle prestazioni
Cons:
- Richiede competenze tecniche
- Curva di apprendimento ripida
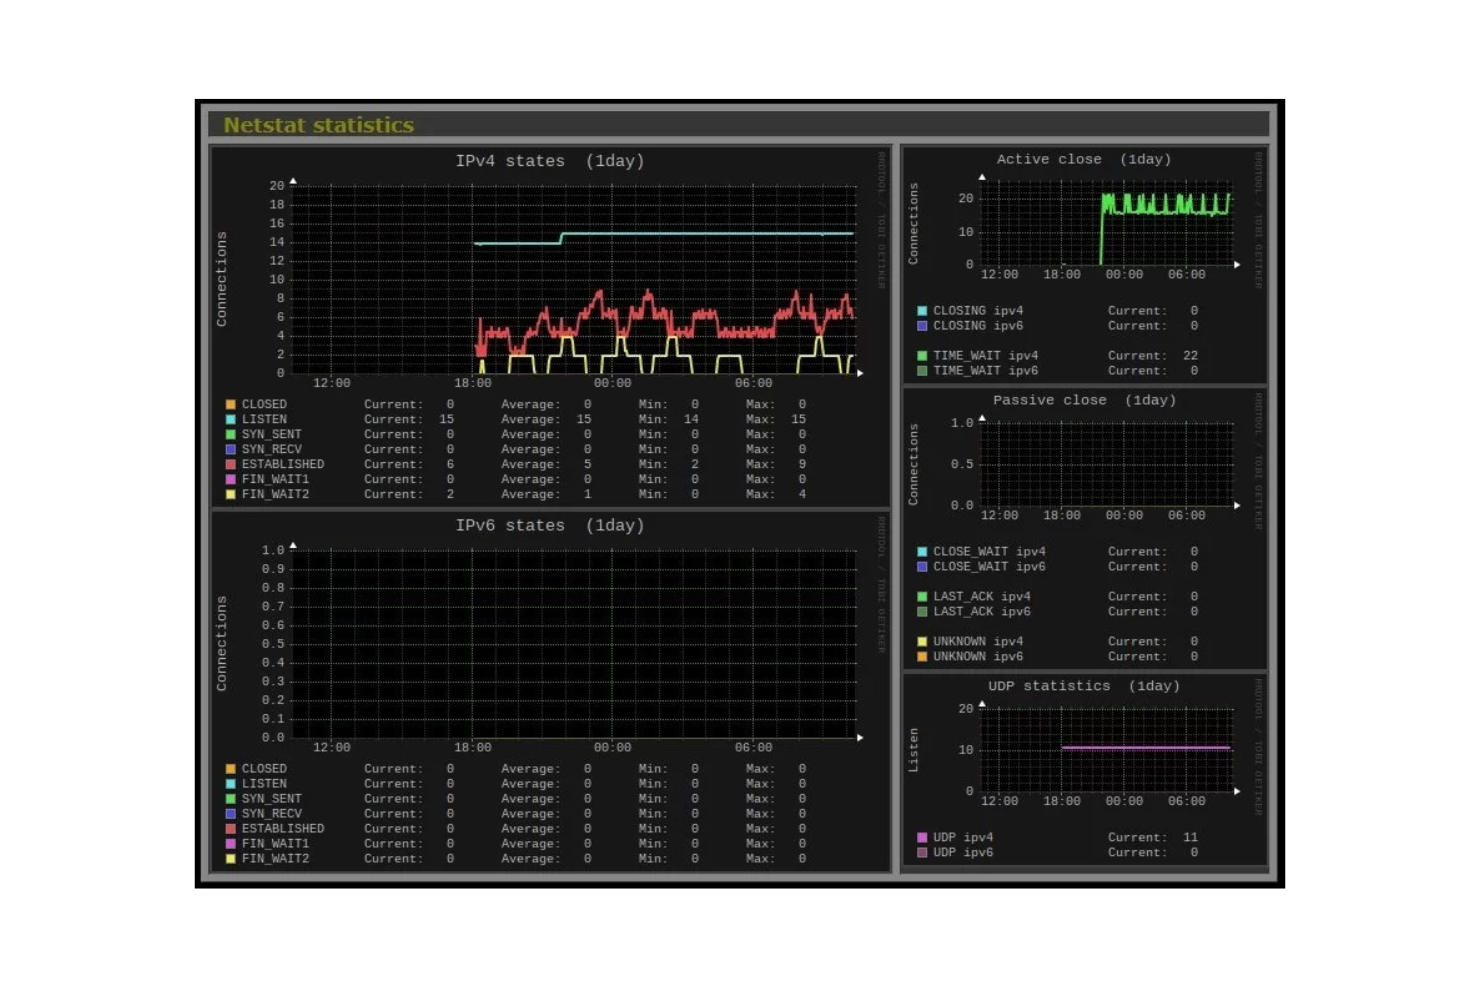
Monitorix è uno strumento di monitoraggio leggero progettato per sistemi e reti di piccole e medie dimensioni. Aiuta a tenere traccia delle prestazioni del sistema e dell'utilizzo delle risorse con un impatto minimo sulle risorse di sistema.
Perché è una valida alternativa a Nagios: Monitorix offre una soluzione leggera ideale per reti di piccole e medie dimensioni. La sua configurazione semplice consente di iniziare rapidamente il monitoraggio senza configurazioni complesse. Lo strumento fornisce monitoraggio in tempo reale e dati storici per aiutare il team ad analizzare le tendenze delle prestazioni. Il suo utilizzo minimo di risorse lo rende adatto ad ambienti in cui l'efficienza è una priorità.
Caratteristiche principali e integrazioni:
Caratteristiche includono monitoraggio in tempo reale che offre informazioni immediate sulle prestazioni di sistema. Il tracciamento dei dati storici aiuta ad analizzare le tendenze nel tempo. Il design leggero assicura un impatto minimo sulle risorse, rendendolo efficiente per strutture più piccole.
Integrazioni includono Nagios, Cacti, Zabbix, Grafana, InfluxDB, Elasticsearch, Prometheus, OpenNMS, SolarWinds e Splunk.
Pros and Cons
Pros:
- Design leggero
- Configurazione semplice
- Monitoraggio in tempo reale
Cons:
- Scalabilità limitata
- Set di funzionalità di base
Altre alternative a Nagios
Ecco alcune alternative a Nagios aggiuntive che non hanno raggiunto la mia shortlist, ma che valgono comunque la pena di essere considerate:
- op5 Monitor
Ideale per la scalabilità aziendale
- Naemon
Ideale per architettura modulare Prezzo su richiesta
- Argus
Ideale per il monitoraggio di sistemi e reti


Criteri di selezione delle alternative a Nagios
Nella scelta delle migliori alternative a Nagios da includere in questo elenco, ho preso in considerazione le esigenze e le criticità più comuni rilevate da chi acquista prodotti per lo sviluppo software, come la scalabilità e la facilità di integrazione. Ho inoltre adottato il seguente schema per mantenere la valutazione strutturata ed equa:
Funzionalità principali (25% del punteggio totale)
Per essere prese in considerazione in questa lista, tutte le soluzioni dovevano soddisfare questi casi d'uso comuni:
- Monitorare le prestazioni del sistema
- Fornire avvisi in tempo reale
- Monitorare lo stato della rete
- Gestire log e dati
- Supportare più piattaforme
Funzionalità distintive aggiuntive (25% del punteggio totale)
Per affinare ulteriormente la selezione, ho cercato anche funzionalità uniche come:
- Capacità avanzate di analisi
- Osservabilità full-stack
- Analisi predittiva
- Integrazione AIOps
- Dashboard personalizzabili
Usabilità (10% del punteggio totale)
Per valutare l'usabilità di ciascun sistema, ho considerato i seguenti aspetti:
- Interfaccia intuitiva
- Navigazione semplice
- Design responsivo
- Impostazioni personalizzabili
- Opzioni di feedback degli utenti
Onboarding (10% del punteggio totale)
Per valutare l'esperienza di onboarding per ciascuna piattaforma, ho considerato i seguenti aspetti:
- Disponibilità di video di formazione
- Tour interattivi del prodotto
- Modelli predefiniti
- Accesso a chatbot
- Webinar e demo dal vivo
Supporto clienti (10% del punteggio totale)
Per valutare i servizi di supporto clienti di ciascun fornitore di software, ho considerato i seguenti aspetti:
- Disponibilità di supporto 24/7
- Accesso alla chat dal vivo
- Base di conoscenza completa
- Tempo di risposta alle richieste
- Qualità del supporto fornito
Rapporto qualità-prezzo (10% del punteggio totale)
Per valutare il rapporto qualità-prezzo di ciascuna piattaforma, ho preso in considerazione:
- Prezzi competitivi
- Piani di pagamento flessibili
- Funzionalità incluse nel piano base
- Costo delle funzionalità aggiuntive
- Sconti per la fatturazione annuale
Recensioni dei clienti (10% del punteggio totale)
Per valutare la soddisfazione generale dei clienti, ho considerato i seguenti punti nella lettura delle recensioni:
- Valutazioni di soddisfazione degli utenti
- Problemi comunemente segnalati
- Tendenze di feedback positivi
- Frequenza degli aggiornamenti
- Coinvolgimento della community
Perché cercare un'alternativa a Nagios?
Sebbene Nagios sia una buona scelta per lo sviluppo software, ci sono diverse ragioni per cui alcuni utenti cercano soluzioni alternative. Potresti essere alla ricerca di un'alternativa a Nagios perché…
- Hai bisogno di interfacce utente più intuitive
- Il tuo team richiede una migliore scalabilità
- Cerchi una configurazione più semplice
- Vuoi capacità di analisi avanzate
- La tua azienda ha bisogno di sistemi di allerta più rapidi
Se ti ritrovi in uno di questi casi, sei arrivato nel posto giusto. Il mio elenco contiene diverse opzioni di sviluppo software più adatte ai team che incontrano queste difficoltà con Nagios e sono alla ricerca di soluzioni alternative. Per i team che stanno valutando soluzioni di monitoraggio più complete, esplorare le alternative a New Relic può offrire ulteriori opzioni per un monitoraggio completo delle prestazioni applicative.
Caratteristiche principali di Nagios
Ecco alcune delle caratteristiche principali di Nagios, per aiutarti a confrontare e valutare ciò che offrono le soluzioni alternative:
- Funzionalità di monitoraggio: Traccia le prestazioni e la disponibilità di server, applicazioni e dispositivi di rete.
- Sistema di segnalazione: Invia notifiche via email o SMS quando si verificano problemi, consentendo una risposta rapida.
- Interfaccia web: Offre una dashboard intuitiva per il monitoraggio e la reportistica in tempo reale.
- Plugin personalizzabili: Supporta una varietà di plugin per funzionalità estese adattate a esigenze specifiche.
- Scalabilità: Può essere scalato per monitorare grandi ambienti con numerosi dispositivi.
- Supporto della community: Supportato da una solida community per assistenza e miglioramenti.
- Risoluzione dei problemi: Funzionalità come le conferme degli avvisi e i gestori di eventi per la risoluzione automatica dei problemi.
- Pianificazione proattiva: Strumenti per l'analisi delle tendenze, la pianificazione della capacità e la gestione dei periodi di inattività programmati.
- Reportistica: Genera report di disponibilità e storici per tracciare prestazioni e conformità agli SLA.
- Funzionalità multi-tenant: Consentono a più utenti di accedere a viste personalizzate dell'infrastruttura.
Cosa succede dopo:
Se stai cercando informazioni sullo sviluppo software, connettiti con un consulente SoftwareSelect per raccomandazioni gratuite.
Compila un modulo e avrai una breve conversazione in cui verranno approfondite le tue esigenze specifiche. Poi riceverai una shortlist di software da valutare. Ti supporteranno anche durante l'intero processo di acquisto, comprese le trattative sul prezzo.