20 Beste Profiling-Tools zur Leistungssteigerung im Jahr 2026

10 Beste Profiling-Tools Shortlist
Here's my pick of the 10 best software from the 20 tools reviewed.


Profiling-Tools helfen Ihnen, die Leistung Ihrer Software zu messen und zu analysieren, damit Sie Verlangsamungen erkennen und beheben können.
Wer schon einmal versucht hat, Verzögerungen, Speicherlecks oder CPU-Spitzen durch das Durchsuchen von Logs zu diagnostizieren, weiß, wie frustrierend das sein kann. Mit diesen Tools erhalten Sie einen klaren Einblick, was unter der Oberfläche wirklich passiert – Rätselraten ist nicht mehr nötig.
Ich habe sowohl mit Open-Source- als auch kommerziellen Profilern in verschiedenen Technologieumgebungen gearbeitet und weiß, was ein Tool im realen Einsatz wirklich nützlich macht. In diesem Leitfaden teile ich die Werkzeuge, denen ich vertraue, und erkläre, warum sie sich lohnen.
Why Trust Our Software Reviews
Zusammenfassung der besten Profiling-Tools
| Tool | Best For | Trial Info | Price | ||
|---|---|---|---|---|---|
| 1 | Best for detailed performance insights | Free plan + free demo available | From $26/month (billed annually) | Website | |
| 2 | Best for customer data management and integration | Free demo available | Pricing upon request | Website | |
| 3 | Best for application performance monitoring | 14-day free trial + free plan available | From $15/host/month | Website | |
| 4 | Best for performance monitoring with error tracking | Not available | From $26/user/month (billed annually). | Website | |
| 5 | Best for memory and CPU python profiling | Not available | Pricing upon request. | Website | |
| 6 | Best for call stack visualization in Python | Not available | Pricing upon request. | Website | |
| 7 | Best for sampling Python profiler utility | Not available | Since py-spy is an open-source tool, its core features are free. | Website | |
| 8 | Best for PHP debugging and development tool | Not available | Pricing upon request. | Website | |
| 9 | Best for industrial product profiling | Not available | Pricing upon request. | Website | |
| 10 | Best for live code tracing on development workstations | Not available | Pricing upon request. | Website |
-

Site24x7
Visit WebsiteThis is an aggregated rating for this tool including ratings from Crozdesk users and ratings from other sites.4.6 -
Docker
Visit WebsiteThis is an aggregated rating for this tool including ratings from Crozdesk users and ratings from other sites.4.6 -
Pulumi
Visit WebsiteThis is an aggregated rating for this tool including ratings from Crozdesk users and ratings from other sites.4.8


Bewertungen der besten Profiling-Tools
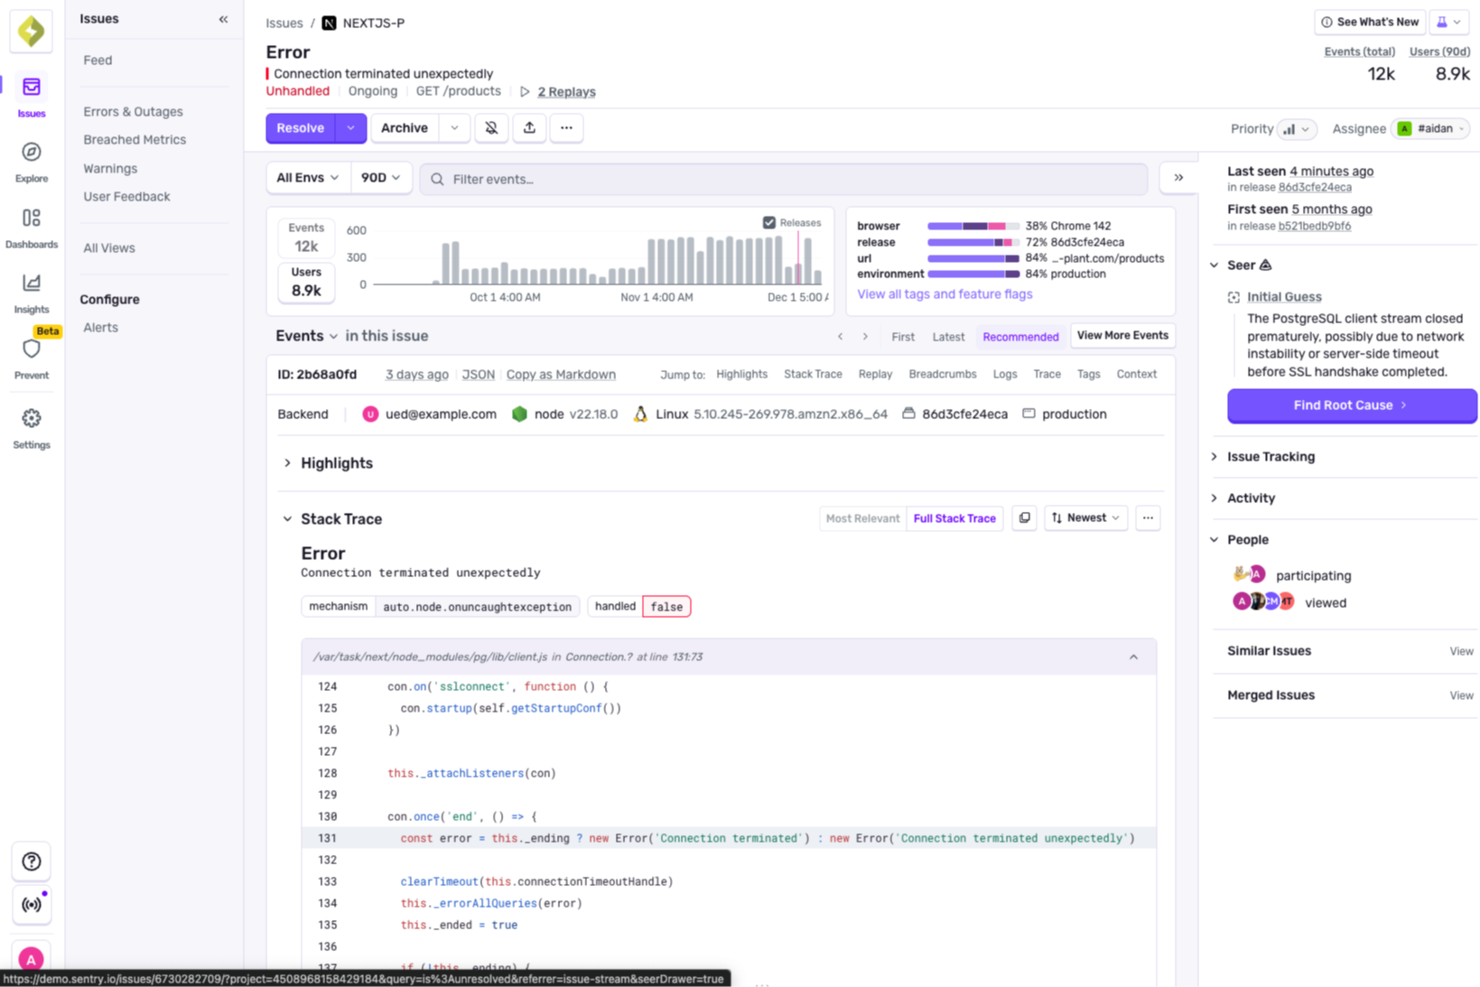
For developers seeking a reliable solution to enhance application performance, Sentry offers an integrated approach to error monitoring and profiling. It caters to web and mobile developers, providing tools to uncover performance bottlenecks and streamline the debugging process. By addressing challenges like error tracking and performance insights, Sentry ensures a smoother development experience.
Why I Picked Sentry
I picked Sentry for its unique ability to deliver detailed performance insights through its profiling feature. By capturing function calls and execution times, Sentry allows you to identify and address performance issues without the need for custom instrumentation. The tool's seamless integration with GitHub and Slack further supports your development workflow by providing context for fixes and facilitating smoother collaboration. This makes Sentry an ideal choice for teams looking to optimize application performance and reduce debugging time.
Sentry Key Features
In addition to its profiling capabilities, Sentry offers several features that enhance its utility as a profiling tool:
- Error Monitoring: Automatically captures errors in your application, providing detailed reports to help you debug issues efficiently.
- Session Replay: Allows you to view user sessions to understand the context of errors and improve user experience.
- AI Debugger (Seer): Analyzes logs and traces to identify root causes of failures, offering AI-driven suggestions for fixes.
- Tracing: Provides insights into slow requests and performance bottlenecks, helping you optimize your application's speed.
Sentry Integrations
Integrations include GitHub, Slack, Jira, GitLab, Bitbucket, Trello, Azure DevOps, Vercel, and AWS Lambda.
Pros and Cons
Pros:
- Real-time production error monitoring
- Automated unit test generation
- AI flags issues in pull requests
Cons:
- AI suggestions may need review
- Initial setup can be complex
New Product Updates from Sentry
Sentry Adds Metrics Support for .NET and Unity SDKs
Sentry adds Metrics support to the .NET SDK and Unity SDK, so teams can send metrics data alongside their existing monitoring for better visibility into app performance. For more information, visit Sentry's official site.
 .
.
Segment offers a platform that consolidates, manages, and integrates customer data from various touchpoints. Designed to unify data sources, it serves as a prime solution for businesses keen on a streamlined approach to customer data management and integration.
Why I Picked Segment: I selected Segment for this list after an extensive comparison with similar platforms. My judgment was swayed by its robust architecture that focuses not just on collecting data but also on validating and ensuring its accuracy. For businesses seeking a comprehensive solution to customer data management combined with absolute integration, Segment stands out.
Standout features & integrations:
Segment's prime features include real-time data collection from various channels and validation tools that ensure the integrity of the collected data. Additionally, its data pipelines are built to consolidate and route data efficiently. On the integrations front, Segment collaborates with many platforms, including but not limited to analytics tools, marketing automation software, and CRM systems.
Pros and Cons
Pros:
- Broad range of integrations with essential business tools
- Validation tools that ensure data integrity
- Efficient data collection from multiple touchpoints
Cons:
- Pricing might be on the higher side for budget-conscious businesses.
- Requires a certain level of expertise for full utilization
- Might be overkill for smaller businesses or startups

Datadog is a robust cloud-scale monitoring platform that centralizes data from applications, infrastructure, and logs. Specifically tailored for modern cloud environments, it provides detailed insights into application performance, ensuring optimal uptime and swift issue detection.
Why I Picked Datadog: Choosing Datadog was a decision influenced by its holistic approach to performance monitoring. Compared with other tools, Datadog consistently showcased the capacity to provide in-depth insights without compromising user-friendliness. I think that for businesses prioritizing application performance monitoring, Datadog is undeniably a frontrunner.
Standout features & integrations:
Datadog shines with features such as real-time dashboards, anomaly and outlier detection, and end-to-end request tracing. Powerful visualization tools enhance its monitoring capabilities. Integrations-wise, Datadog boasts compatibility with various platforms, including AWS, Docker, Slack, and many more, facilitating a comprehensive monitoring experience.
Pros and Cons
Pros:
- Efficient anomaly detection and alerting systems
- Wide array of integrations with popular platforms
- Comprehensive monitoring across applications, infrastructure, and logs
Cons:
- Initial setup can be time-consuming for complex infrastructures.
- Some advanced features come at an additional cost
- Might have a learning curve for newcomers

Sentry Profiling is a tool engineered to help developers monitor application performance while simultaneously tracking errors. This combination aids developers in identifying bottlenecks in the source code, thus ensuring a smooth user experience.
Why I Picked Sentry Profiling: In the vast sea of profiling tools, Sentry Profiling caught my attention. My determination was based on its dual ability to offer performance monitoring while keeping an eye on errors. After comparing it with other tools, Sentry Profiling is truly best suited for those who prioritize performance monitoring combined with error tracking.
Standout features & integrations:
One of Sentry Profiling's cardinal features is its deep dive into source code, allowing efficient troubleshooting. Additionally, its built-in error tracking mechanism ensures developers catch anomalies before they impact the user experience. For integrations, Sentry integrates with many platforms, including GitHub, Slack, and Jira, ensuring developers have a cohesive ecosystem.
Pros and Cons
Pros:
- Wide range of integrations enhancing the tool's utility
- Dual capabilities: performance monitoring and error tracking
- Comprehensive insights into source code for efficient troubleshooting
Cons:
- Some users report a steeper learning curve compared to other profiling tools.
- Annual billing might not be preferred by all users
- Might be over-complex for small projects or beginners

Scalene is a top tool for Python developers to analyze CPU and memory usage.
Why I Picked Scalene: Scalene entered my radar when I sought an efficient profiling tool primarily for Python. In comparing its features against other contenders, Scalene stood out with its high precision in pinpointing memory and CPU usage. I determined it's best for memory and CPU Python profiling because it uniquely combines both these metrics, allowing developers to view a cohesive picture of their application's performance.
Standout features & integrations:
Scalene is particularly adept at delivering fine-grained performance metrics without heavy overhead. Its distinctiveness lies in its ability to profile memory usage at every line of code, something not commonly found in other tools. Scalene offers compatibility with Java applications for integrations, making it versatile for projects that use both Python and Java.
Pros and Cons
Pros:
- Captures both memory and CPU metrics efficiently
- Compatible with Java applications
- Precise memory usage profiling at the code line level
Cons:
- Some advanced features may be overwhelming for casual users
- Limited support for SQL and API profiling compared to specialized tools
- Might have a steeper learning curve for beginners

Pyinstrument is a Python profiler designed to provide developers with a clear and detailed visualization of their program's call stack. With its ability to represent intricate call hierarchies visually, it's evident that it excels for call stack visualization in Python.
Why I Picked Pyinstrument: I chose Pyinstrument after thoroughly comparing it with other tools in its category. Its unique ability to visually articulate complex call hierarchies caught my attention. I judged it superior in presenting Python call stacks, reinforcing my opinion that it's the best tool for visualizing Python call structures.
Standout features & integrations:
Pyinstrument offers a rich user interface for call stack visualization, aiding business intelligence efforts. Its dashboards provide developers with comprehensive overviews of their code’s behavior. In addition to its primary features, Pyinstrument integrates well with data cleansing and data matching tools, augmenting its versatility for data-driven projects.
Pros and Cons
Pros:
- Effective integrations with data cleansing and matching tools
- Comprehensive dashboards offer an overarching view of code performance
- Detailed call stack visualization enhances business intelligence processes
Cons:
- Limited support for non-Python languages
- Requires manual configuration for certain advanced features
- Might not be suitable for real-time profiling

py-spy is a tool engineered to profile Python applications by sampling their execution. It stands out as an asset for developers aiming for detailed memory profiling without disturbing the normal operation of their Python apps.
Why I Picked py-spy: When determining the optimal tools for Python profiling, py-spy was a natural selection for me. What piqued my interest was its non-intrusive approach to memory profiling and its ability to extract metadata efficiently. In comparison with other tools, it was evident that py-spy was distinct in its capabilities, solidifying its position as the best tool for sampling Python profiler utility.
Standout features & integrations:
One of py-spy's pivotal features is its ability to carry out memory profiling without requiring modifications to the code or restarting the application. The tool is also adept at capturing rich metadata from the profiling samples, which enhances the depth of insights obtained. While py-spy primarily focuses on Python, it's also worth noting its open-source data integrations that offer flexibility and transparency.
Pros and Cons
Pros:
- Leveraging open source data, it ensures transparency and community-backed improvements
- Effectively captures and provides insightful metadata
- Allows for non-intrusive memory profiling
Cons:
- Lack of a dedicated support system, relying primarily on community assistance.
- As it's specifically designed for Python, versatility across multiple languages is limited
- Some advanced features may require a steep learning curve for beginners

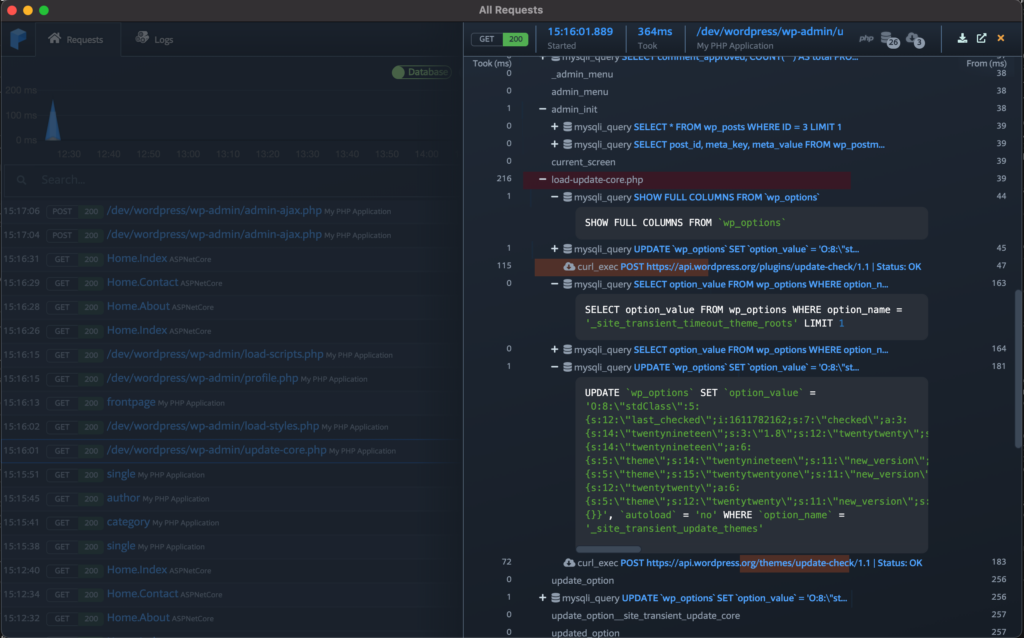
Xdebug, tailored specifically for PHP, is an essential tool with detailed debugging capabilities. Addressing the challenges faced during PHP development solidifies its position as the top choice for those requiring a PHP-specific debugging and development solution.
Why I Picked Xdebug: When choosing tools for PHP debugging, Xdebug consistently emerged as a front-runner in my evaluations. Its precision in identifying performance issues and unparalleled depth in the PHP runtime environment set it apart. I recognized these qualities and confidently determined Xdebug to be the best for PHP debugging and development.
Standout features & integrations:
Xdebug shines with its ability to pinpoint performance issues swiftly, allowing developers to rectify them effectively. Its features provide insights into runtime allocation, ensuring resources are used efficiently. Furthermore, its compatibility with numerous plugins ensures a smoother and more integrated development experience.
Pros and Cons
Pros:
- Integration with multiple plugins
- Detailed insights into runtime allocation
- Expertly identifies performance issues in PHP applications
Cons:
- Configuration can be intricate for complex applications
- May introduce overhead when running on production servers
- Steeper learning curve for beginners

SPX, an innovative data profiling tool, is built primarily to cater to the nuanced needs of industrial product profiling. Given the complexities of this domain, SPX is uniquely positioned to offer insightful profiling capabilities, reinforcing its "best for" industrial product tag.
Why I Picked SPX: During my rigorous selection process, SPX stood out as a beacon. While comparing various tools, SPX's tailored approach to industrial products made it shine. Its commitment to data quality and comprehensive profiling capabilities drove me to determine that, in the realm of industrial profiling, SPX is unmatched.
Standout features & integrations:
SPX boasts robust data quality features that ensure reliable and actionable profiling. Its IDE (Integrated Development Environment) support makes it versatile and user-friendly. Furthermore, it provides integrations with several .NET platforms, expanding its usability and making it compatible with various enterprise applications.
Pros and Cons
Pros:
- Integrates well with .NET platforms
- Strong emphasis on data quality
- Dedicated focus on industrial product profiling
Cons:
- Can be perceived as niche, given its industry-specific focus
- Requires a specific skill set to maximize its potential
- May not be suitable for non-industrial profiling
Prefix provides developers with a clear window into the behavior of their code in real time. Specifically tailored for development workstations, it offers real-time live code tracing capabilities, making it an invaluable tool for those wanting a real-time perspective on their code's performance, aligning perfectly with its "best for" statement.
Why I Picked Prefix: Prefix stood out in the myriad of tools I've sifted through. Its unique focus on live code tracing, specially tailored for development environments, caught my eye. It allows developers to trace code live on their workstations, so I determined it to be the best for this specific use case.
Standout features & integrations:
Prefix's strong suit is its live code profiling feature, offering immediate feedback on code behavior. Its big data capabilities also help developers understand large datasets in real-time. Regarding integrations, Prefix fits into many automation workflows, catering to the needs of modern development cycles.
Pros and Cons
Pros:
- Efficient integration with various automation platforms
- Strong big data analysis capabilities
- Live code tracing directly on development workstations
Cons:
- Not as comprehensive in features as some dedicated profiling tools
- Requires a certain level of familiarity with code profiling to harness its full potential
- Might be less suitable for production environment monitoring
Weitere erwähnenswerte Profiling-Tools
Nachfolgend finden Sie eine Liste weiterer Profiling-Tools, die ich in die engere Auswahl genommen habe, die es aber nicht unter die Top 10 geschafft haben. Sie sind auf jeden Fall einen Blick wert.
- Pyroscope
For continuous profiling in real-time
- Bubbleprof
For visualizing Node.js async operations
- Orbit Profiler
For game development and graphics applications
- vprof
-profiling-tools
- Pixis Performance
-profiling-tools
- Performance Cloud
-profiling-tools
- Tracy
-profiling-tools
- VisualVM
-profiling-tools
- CheckPOS
-profiling-tools
- Uber jvm Profiler
-profiling-tools


Weitere Rezensionen
Kriterien für die Auswahl von Profiling-Tools
Bei der Auswahl der besten Profiling-Tools für diese Liste habe ich häufige Bedürfnisse und Schmerzpunkte von Käufern berücksichtigt, wie z.B. das Erkennen von Leistungsengpässen und die Integration in bestehende Entwicklungsumgebungen. Außerdem habe ich anhand des folgenden Rahmens bewertet, um die Analyse strukturiert und fair zu halten:
Kernfunktionen (25% der Gesamtbewertung)
Um in diese Liste aufgenommen zu werden, musste jede Lösung diese häufigen Anwendungsfälle abdecken:
- CPU-Nutzung analysieren
- Speicherzuweisungen überwachen
- Leistungsengpässe erkennen
- Multithread-Anwendungen profilieren
- Detaillierte Berichte erzeugen
Weitere herausragende Funktionen (25% der Gesamtbewertung)
Um die Auswahl weiter einzugrenzen, habe ich auch nach einzigartigen Funktionen gesucht, z.B.:
- Echtzeit-Datenanalyse
- Integration in CI/CD-Pipelines
- Unterstützung für verteilte Systeme
- Anpassbare Dashboards
- Erweiterte Visualisierungsmöglichkeiten
Benutzerfreundlichkeit (10% der Gesamtbewertung)
Um die Benutzerfreundlichkeit jedes Systems einzuschätzen, habe ich Folgendes berücksichtigt:
- Intuitive Benutzeroberfläche
- Einfache Navigation
- Geringe Einarbeitungszeit
- Anpassbare Einstellungen
- Reaktives Design
Onboarding (10% der Gesamtbewertung)
Um die Einführungsphase für jede Plattform zu bewerten, habe ich Folgendes berücksichtigt:
- Verfügbarkeit von Trainingsvideos
- Interaktive Produkttouren
- Zugriff auf Vorlagen
- Chatbot-Unterstützung
- Live-Webinare
Kundensupport (10 % der Gesamtbewertung)
Um die Kundensupport-Dienste jedes Softwareanbieters zu bewerten, habe ich Folgendes berücksichtigt:
- 24/7 Verfügbarkeit
- Mehrere Supportkanäle
- Reaktionszeit
- Kompetentes Personal
- Verfügbarkeit von FAQs
Preis-Leistungs-Verhältnis (10 % der Gesamtbewertung)
Um das Preis-Leistungs-Verhältnis jeder Plattform zu bewerten, habe ich Folgendes berücksichtigt:
- Wettbewerbsfähige Preisgestaltung
- Gestaffelte Abonnementoptionen
- Verfügbarkeit einer kostenlosen Testphase
- Kosten im Verhältnis zu den gebotenen Funktionen
- Rabatte für Jahrespläne
Kundenbewertungen (10 % der Gesamtbewertung)
Um ein Gefühl für die allgemeine Kundenzufriedenheit zu bekommen, habe ich beim Lesen von Kundenbewertungen Folgendes berücksichtigt:
- Gesamte Zufriedenheitsbewertung
- Häufig genannte Vor- und Nachteile
- Update-Häufigkeit
- Von Nutzern gemeldete Probleme
- Referenzen von ähnlichen Branchen
Wie wählt man Profiling-Tools aus?
Es ist leicht, sich in langen Funktionslisten und komplexen Preisstrukturen zu verlieren. Damit Sie sich bei der Auswahl Ihrer Software auf das Wesentliche konzentrieren können, finden Sie hier eine Checkliste mit wichtigen Faktoren:
| Faktor | Worauf achten? |
|---|---|
| Skalierbarkeit | Kann das Tool mit Ihrem Team wachsen? Überlegen Sie, ob es erhöhte Datenlasten und Nutzerzahlen ohne Leistungseinbußen bewältigt. Achten Sie darauf, dass es aktuelle und zukünftige Anforderungen erfüllt. |
| Integrationen | Lässt es sich problemlos in Ihre bestehenden Systeme einbinden? Prüfen Sie die Kompatibilität mit Entwicklungsumgebungen und anderen täglich genutzten Tools Ihres Teams. Vermeiden Sie Lösungen, die umständliche Workarounds zur Integration erfordern. |
| Anpassbarkeit | Können Sie das Tool an Ihren Workflow anpassen? Achten Sie auf Optionen zur Personalisierung von Dashboards, Berichten und Benachrichtigungen. Stellen Sie sicher, dass es sich ohne umfangreiche Konfiguration in die Arbeitsabläufe Ihres Teams einfügt. |
| Benutzerfreundlichkeit | Ist das Tool für alle Teammitglieder intuitiv bedienbar? Eine steile Lernkurve bremst die Produktivität. Achten Sie auf eine einfache Navigation und klare Anweisungen. Testen Sie die Oberfläche darauf, ob sie für neue Nutzer verständlich ist. |
| Implementierung und Onboarding | Wie schnell kann Ihr Team loslegen? Prüfen Sie das Vorhandensein von Schulungsmaterialien und Support während der Einrichtung. Ein reibungsloser Onboarding-Prozess ist entscheidend für die Akzeptanz und Nutzung. |
| Kosten | Passen die Preise zu Ihrem Budget? Prüfen Sie die Gesamtkosten inklusive versteckter Gebühren für Zusatzfunktionen oder Support. Vergleichen Sie Abo-Modelle und bewerten Sie die langfristige Bezahlbarkeit. |
| Sicherheitsmaßnahmen | Sind Ihre Daten und Arbeitsvorgänge geschützt? Kontrollieren Sie die Einhaltung von Datenschutzstandards und achten Sie auf Funktionen wie Verschlüsselung und Zugriffskontrollen. Kompromittieren Sie nicht die Sicherheit zugunsten günstigerer Preise. |
| Support-Verfügbarkeit | Gibt es Hilfe, wenn Sie sie benötigen? Prüfen Sie die Supportzeiten und -kanäle des Anbieters. Eine schnelle Reaktionszeit und kompetente Unterstützung steigern die Nutzererfahrung Ihres Teams erheblich. |
Was ist ein Profiling-Tool?
Profiling-Tools sind Softwarelösungen, die Ihnen helfen, die Performance Ihres Codes zu messen, sodass Sie langsame Funktionen, Speicherprobleme oder ineffiziente Ressourcennutzung erkennen können. Sie werden hauptsächlich von Entwicklern und Ingenieuren eingesetzt, die verstehen möchten, wie sich ihre Anwendungen zur Laufzeit verhalten und wo sich Leistungsprobleme verbergen könnten.
Aufrufgraphen, Speicherverbrauchsüberwachung und CPU-Sampling helfen dabei, Engpässe zu identifizieren, Systemlast zu verstehen und Reaktionszeiten zu verbessern. Solche Tools erleichtern es, Anwendungen gezielt zu optimieren, ohne raten zu müssen, was die Performance ausbremst.
Funktionen
Achten Sie bei der Auswahl von Profiling-Tools auf folgende Schlüsselfunktionen:
- Analyse der CPU-Auslastung: Hilft dabei zu erkennen, welche Teile der Anwendung am meisten Rechenleistung verbrauchen, was die Optimierung unterstützt.
- Überwachung der Speicherzuweisung: Verfolgt den Speicherverbrauch, um Lecks und Ineffizienzen zu erkennen und für eine reibungslosere Leistung zu sorgen.
- Erkennung von Leistungsengpässen: Spürt langsame Bereiche im Code auf und ermöglicht gezielte Verbesserungen.
- Integrationsmöglichkeiten: Verbindet sich nahtlos mit bestehenden Entwicklungsumgebungen und verbessert so den Arbeitsablauf.
- Anpassbare Dashboards: Ermöglicht es Nutzern, Ansichten und Berichte auf individuelle Bedürfnisse zuzuschneiden und so die Benutzerfreundlichkeit zu erhöhen.
- Echtzeit-Datenanalyse: Liefert sofortige Einblicke in die Anwendungsleistung und erleichtert schnelle Entscheidungen.
- Erweiterte Visualisierungstools: Bietet grafische Darstellungen von Daten, sodass auch komplexe Informationen leichter verständlich werden.
- Sicherheitsmaßnahmen: Schützt Daten durch Verschlüsselung und Zugriffskontrollen und erhält so das Vertrauen der Nutzer.
- Interaktive Produkttouren: Führt neue Nutzer durch die Funktionen und verbessert so das Onboarding-Erlebnis.
- Rund-um-die-Uhr-Support: Bietet durchgehende Unterstützung, um Probleme schnell zu lösen und die Zufriedenheit der Nutzer zu erhöhen.
Vorteile
Der Einsatz von Profiling-Tools bietet Ihrem Team und Unternehmen verschiedene Vorteile. Hier sind einige, auf die Sie sich freuen können:
- Verbesserte Leistung: Durch die Identifikation von Problemen bei CPU- und Speichernutzung helfen diese Tools, die Geschwindigkeit und Effizienz der Anwendung zu optimieren.
- Effizienteres Debugging: Die Erkennung von Leistungsengpässen ermöglicht es Entwicklern, problematische Codestellen schnell zu finden und zu beheben.
- Bessere Ressourcennutzung: Die Überwachung der Speicherzuweisung sorgt für einen effizienten Umgang mit Systemressourcen, verhindert Verschwendung und erhöht die Stabilität.
- Höhere Produktivität: Echtzeit-Datenanalyse und anpassbare Dashboards optimieren Arbeitsabläufe, sodass Teams sich auf kritische Aufgaben konzentrieren können.
- Mehr Sicherheit: Funktionen wie Verschlüsselung und Zugriffskontrollen schützen sensible Daten und sichern Compliance sowie Vertrauen.
- Vereinfachtes Onboarding: Interaktive Produkttouren und Trainingsressourcen erleichtern es neuen Nutzern, sich schnell zurechtzufinden.
- Zuverlässiger Support: Mit rund um die Uhr verfügbarer Kundenbetreuung werden Probleme schnell gelöst und Ausfallzeiten minimiert.
Kosten & Preise
Die Auswahl von Profiling-Tools setzt ein Verständnis der unterschiedlichen Preismodelle und Tarife voraus. Die Kosten variieren je nach Funktionsumfang, Teamgröße, Zusatzoptionen und mehr. Die folgende Tabelle fasst gängige Tarife, deren durchschnittliche Preise und typische Ausstattungsmerkmale von Profiling-Tools zusammen:
Vergleichstabelle für Profiling-Tools
| Tariftyp | Durchschnittlicher Preis | Häufige Funktionen |
|---|---|---|
| Free Plan | $0 | Grundlegende Überwachung von CPU und Speicher, eingeschränkte Berichte und Community-Support. |
| Personal Plan | $10-$30/user/month | Erweiterte Leistungsanalysen, anpassbare Dashboards und E-Mail-Support. |
| Business Plan | $50-$100/user/month | Echtzeit-Datenanalysen, Integrationsmöglichkeiten, erweiterte Sicherheitsfunktionen und bevorzugter Support. |
| Enterprise Plan | $150-$300/user/month | Umfassendes Monitoring, persönlicher Account-Manager, erweiterte Sicherheitsoptionen und Premium-Support rund um die Uhr. |
Häufig gestellte Fragen zu Profiling-Tools (FAQs)
Wie helfen Profiling-Tools bei der Leistungsoptimierung?
Profiling-Tools analysieren Ihren Code, um Leistungsengpässe zu finden, sodass Sie gezielt optimieren und die Effizienz steigern können. Sie bieten Einblicke in CPU-Auslastung, Speicherzuweisung und weitere Kennzahlen, die Ihre Anwendung verlangsamen können. Mit Hilfe dieser Tools können Sie gezielte Verbesserungen vornehmen.
Wie gehen Profiling-Tools mit groß angelegten Anwendungen um?
Für den Unternehmenseinsatz konzipierte Profiling-Tools können groß angelegte Anwendungen bewältigen, indem sie detaillierte Analysen und umfassende Einblicke bieten. Sie sind in der Lage, erhöhte Datenmengen und Nutzerzahlen zu verarbeiten, ohne die eigene Performance zu beeinträchtigen. Achten Sie bei der Auswahl insbesondere auf Funktionen wie die Unterstützung verteilter Systeme, wenn Sie mit großen Anwendungen arbeiten.
Wie können Profiling-Tools meinen Entwicklungsprozess verbessern?
Profiling-Tools können Ihren Entwicklungsprozess verbessern, indem sie Performance-Probleme schnell aufdecken und beheben. Dank Echtzeitdaten und anpassbarer Berichte treffen Sie fundierte Entscheidungen. Das führt zu effizienterem Code und einem reibungsloseren Entwicklungsablauf.
Lohnt sich die Investition in ein Premium-Profiling-Tool?
Während kostenlose Tools für kleinere Projekte oder grundlegende Profilierungsbedürfnisse durchaus geeignet sein können, ist für größere, komplexe Anwendungen die Investition in ein Premium-Tool oft unerlässlich. Premium-Tools bieten in der Regel mehr fortschrittliche Funktionen, besseren Support und Skalierbarkeitsoptionen – und sind damit wertvoll, um die bestmögliche Leistung Ihrer Anwendungen sicherzustellen.
Können Profiling-Tools für jede Programmiersprache verwendet werden?
Die meisten Profiling-Tools unterstützen mehrere Programmiersprachen, jedoch nicht unbedingt alle. Prüfen Sie vor der Auswahl eines Tools unbedingt, ob dieses mit den von Ihnen eingesetzten Programmiersprachen kompatibel ist.
Wie geht es weiter:
Wenn Sie sich gerade mit dem Thema Profiling-Tools beschäftigen, nehmen Sie Kontakt zu einem SoftwareSelect-Berater auf und erhalten Sie kostenlose Empfehlungen.
Sie füllen ein Formular aus und führen ein kurzes Gespräch, bei dem Ihre individuellen Anforderungen erfasst werden. Anschließend erhalten Sie eine Shortlist mit geeigneter Software zur Auswahl. Die Berater begleiten Sie sogar durch den gesamten Kaufprozess – inklusive Preisverhandlungen.