Ihr Leitfaden zu den 27 besten API-Überwachungstools 2026

10 Beste API-Monitoring-Tools Kurzliste
Here's my pick of the 10 best software from the 29 tools reviewed.


API-Monitoring-Tools helfen Ihnen, die Performance und den Zustand Ihrer APIs zu überwachen, sodass Sie Probleme frühzeitig erkennen und Ihre Services reibungslos betreiben können.
Viele Teams machen sich auf die Suche nach solchen Tools, wenn sie erstmals mit Problemen wie unerkanntem Ausfall, durch Änderungen an externen APIs verursachte Fehler oder Lücken im Monitoring verschiedener Umgebungen konfrontiert werden. Ohne die passende Lösung werden Warnzeichen oft erst erkannt, wenn Nutzer sich beschweren.
Ich habe diese Tools sowohl in lokalen als auch in Cloud-Umgebungen getestet und dabei genau darauf geachtet, wie gut sie mit realem Traffic und Warnmeldungen umgehen. In diesem Leitfaden teile ich, was mir positiv auffiel, was weniger überzeugte und wie Sie ein Tool finden, das zu Ihrem Stack und Arbeitsablauf passt.
Why Trust Our Software Reviews
Zusammenfassung der besten API-Monitoring-Tools
| Tool | Best For | Trial Info | Price | ||
|---|---|---|---|---|---|
| 1 | Best for multi-gateway API monitoring | Free demo available | Pricing upon request | Website | |
| 2 | Best for multi-step transaction monitoring | Free demo + 30-day free trial available | From $9/month (billed annually) | Website | |
| 3 | Best for uptime monitoring and detailed reports | 30-day free trial + demo available | From $10/month | Website | |
| 4 | Best for cloud-scale synthetic monitoring | Free plan + 14-day free trial available | From $15/host/month (billed annually) | Website | |
| 5 | Best for actionable insights with intelligent alerting | Free trial available | Pricing upon request | Website | |
| 6 | Best for enterprise-grade API lifecycle management | Free 30-day trial | From $83/month | Website | |
| 7 | Best for real-time data visualization and search capabilities | 7-day free trial available | Pricing upon request | Website | |
| 8 | Best for developer-friendly API testing and monitoring | Free plan available | From $9/month (billed annually) | Website | |
| 9 | Best for application experience insights | Free demo available | From $50/user/month (billed annually) | Website | |
| 10 | Best for behavior analytics on API usage | Not available | From $79/user/month | Website |
-

Site24x7
Visit WebsiteThis is an aggregated rating for this tool including ratings from Crozdesk users and ratings from other sites.4.6 -
Docker
Visit WebsiteThis is an aggregated rating for this tool including ratings from Crozdesk users and ratings from other sites.4.6 -
Pulumi
Visit WebsiteThis is an aggregated rating for this tool including ratings from Crozdesk users and ratings from other sites.4.8


Bewertungen der besten API-Monitoring-Tools
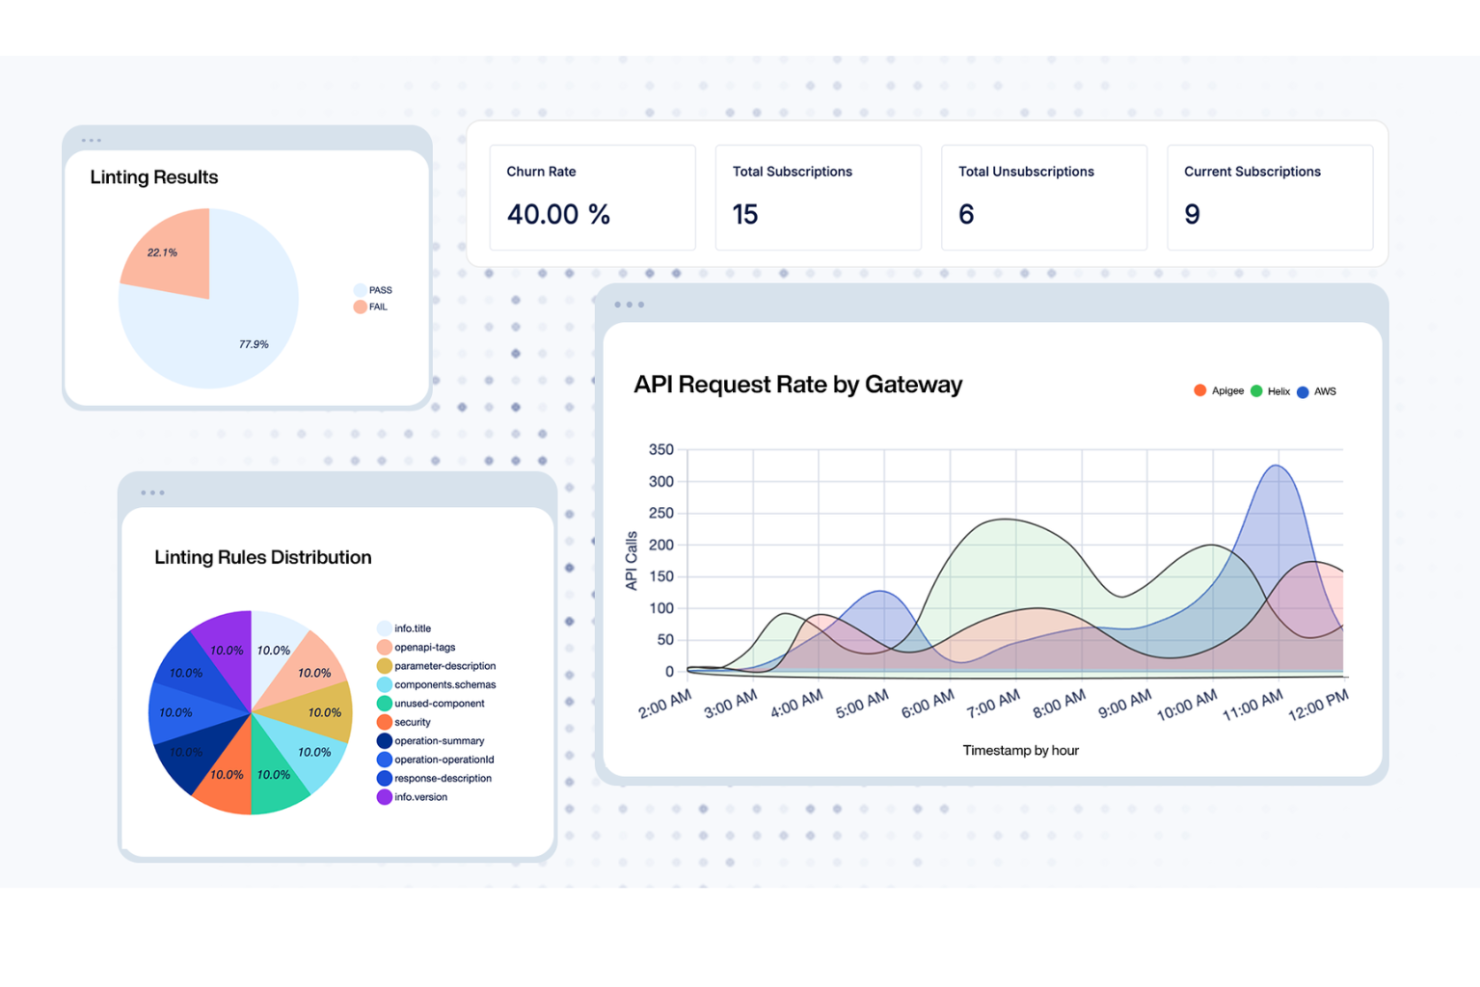
DigitalAPI provides a versatile platform for businesses that want to improve how they manage APIs, covering everything from discovery to monetization. Built with regulated industries like healthcare and banking in mind, it offers a unified control system and a developer portal that simplifies API deployment. This makes it a solid option for enterprises that need strong governance and security across their API operations.
Why I Picked DigitalAPI
I chose DigitalAPI for its centralized API governance and detailed analytics, both of which are essential for effective monitoring. The unified control system lets you manage APIs across multiple gateways while maintaining consistency and security. Its analytics provide clear visibility into API performance, making it easier to spot and resolve issues quickly. Together, these capabilities make DigitalAPI a strong choice for teams focused on improving API monitoring.
DigitalAPI Key Features
In addition to its governance and analytics capabilities, I also found several other features beneficial for API monitoring:
- API Marketplace: Enables API monetization through an external platform, helping expand revenue opportunities.
- Developer Portal: Offers a central hub where developers can access APIs, making integration and management more straightforward.
- One-Click Deployment: Streamlines API deployment across multiple gateways, reducing time and operational effort.
- AI Integration: Adds artificial intelligence capabilities to APIs, supporting advanced functionality and automation.
DigitalAPI Integrations
Native integrations are not currently listed by DigitalAPI.
Pros and Cons
Pros:
- Helix Gateway supports full lifecycle
- Detailed analytics for API performance
- Centralized governance across multiple gateways
Cons:
- Pricing details not publicly available
- No listed native integrations
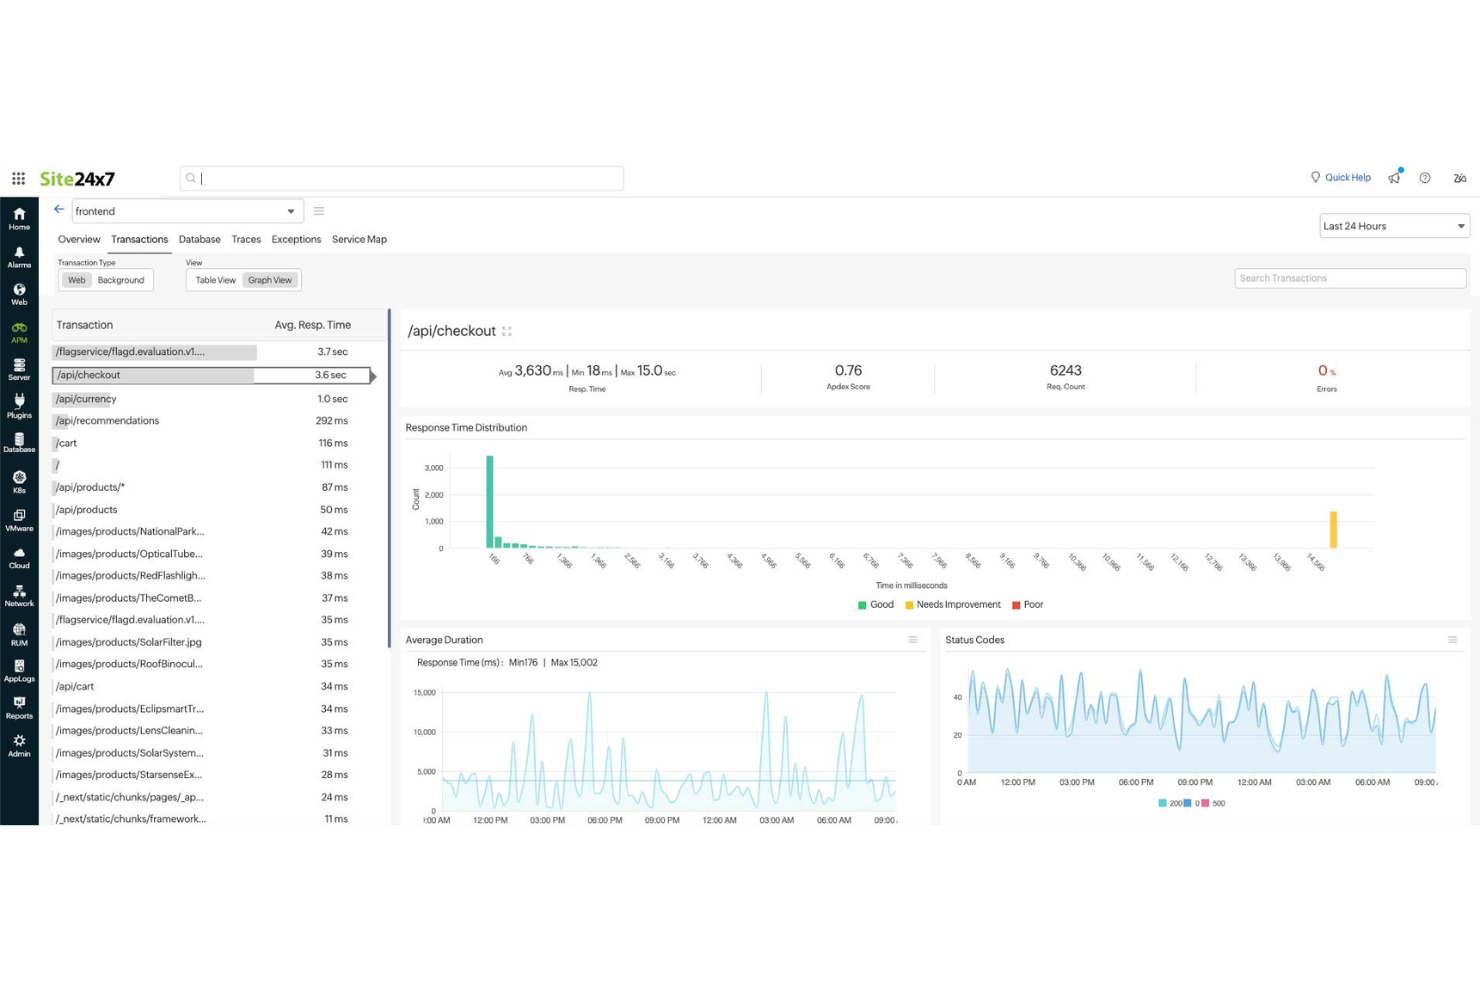
Site24x7 is an ideal solution for businesses seeking to ensure their APIs run smoothly and reliably, with support for multi-step transaction monitoring to track API workflows more effectively. If you're in an industry where consistent application performance is important, Site24x7's API monitoring tools help you observe and troubleshoot API behavior in real time, addressing issues before they affect users. By using its capabilities, you can maintain service availability and keep your team focused on delivering reliable digital experiences.
Why I Picked Site24x7
I picked Site24x7 for its multi-step transaction monitoring, which helps track API workflows across sequential requests. The platform also supports monitoring REST, SOAP, gRPC, and WebSocket APIs, allowing you to observe response times and error rates. Its alerting system notifies you when performance issues occur, helping teams address problems early. These capabilities make Site24x7 useful for businesses that depend on stable API integrations.
Site24x7 Key Features
In addition to multi-step transaction monitoring, Site24x7 offers:
- Global Monitoring Locations: With over 130 locations worldwide, you can ensure your APIs perform optimally for users worldwide.
- Content Validation: Site24x7 checks if the API response contains the expected content, ensuring data integrity.
- Instant Notifications: Get immediate alerts for any API performance issues, allowing you to respond swiftly and maintain service quality.
Site24x7 Integrations
Integrations include ServiceNow, PagerDuty, Jira, Slack, Microsoft Teams, AWS, Azure, Kubernetes, and more.
Pros and Cons
Pros:
- Quick setup process covers websites and cloud resource monitoring
- AI-powered full-stack monitoring supports multicloud infrastructure management
- Flexible monitoring integrates easily with multiple infrastructure components
Cons:
- Complex configuration slows initial setup and platform understanding
- Alert bugs cause issues when adding new monitoring configurations
New Product Updates from Site24x7

Site24x7 Enhances Monitoring with AI-Powered Features
Site24x7 introduces new AI-powered capabilities to improve monitoring and troubleshooting. These updates help teams identify issues faster and gain insights more efficiently across their systems. For more information, visit Site24x7’s official site.
 .
.
Pingdom is primarily recognized for its prowess in uptime monitoring, ensuring that APIs and websites remain operational. Paired with this is its capability to generate in-depth reports, providing users with a detailed understanding of their API's performance.
Why I Picked Pingdom: In my quest for reliable monitoring tools, Pingdom's dedication to uptime monitoring, complemented by its detailed reporting, was undeniable. I appreciated its straightforward approach to delivering timely insights about any downtimes. For teams that prioritize constant uptime and comprehensive reporting, Pingdom is clearly the go-to tool.
Standout Features & Integrations:
Pingdom excels with its real-time monitoring that instantly notifies users of downtimes. Its root cause analysis helps in troubleshooting issues swiftly.
Integration-wise, Pingdom collaborates with platforms such as Slack, Opsgenie, and PagerDuty.
Pros and Cons
Pros:
- Flexible alerting system
- Detailed root cause analysis
- Accurate real-time uptime monitoring
Cons:
- Historical data retention varies with pricing tiers
- Advanced features limited to higher-tier plans
- Mobile apps can sometimes lag
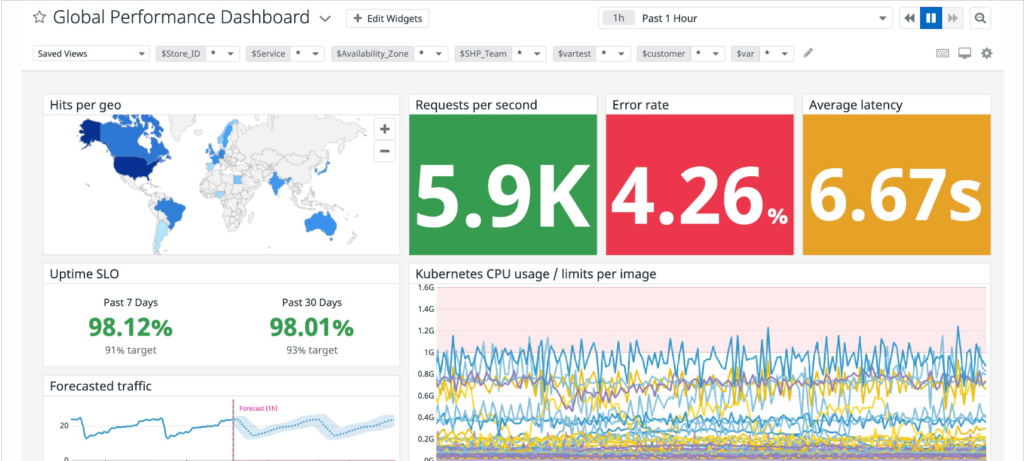
Datadog offers an impressive platform primarily centered around cloud monitoring. Its synthetic monitoring feature stands out, helping businesses to simulate user interactions and track application and API performance at a cloud scale.
Why I Picked Datadog: In my search for cloud-focused monitoring solutions, Datadog's capabilities were hard to overlook. Its emphasis on cloud-scale synthetic monitoring and the breadth of its feature set made it a clear choice. It is my opinion that Datadog is the top choice for businesses needing to simulate and monitor performance in cloud environments.
Standout Features & Integrations:
Datadog’s synthetic monitoring can simulate interactions from global locations, ensuring performance consistency worldwide. The tool’s visualizations, including flame graphs, provide deep insights into application performance.
Integration-wise, Datadog supports a myriad of platforms including AWS, Azure, Google Cloud, and numerous third-party integrations.
Pros and Cons
Pros:
- Powerful visualization tools for performance analysis
- Wide range of cloud integrations
- Advanced synthetic monitoring capabilities
Cons:
- Some configurations can require advanced technical know-how
- The vastness of features might be daunting for beginners
- Can be pricey for smaller organizations
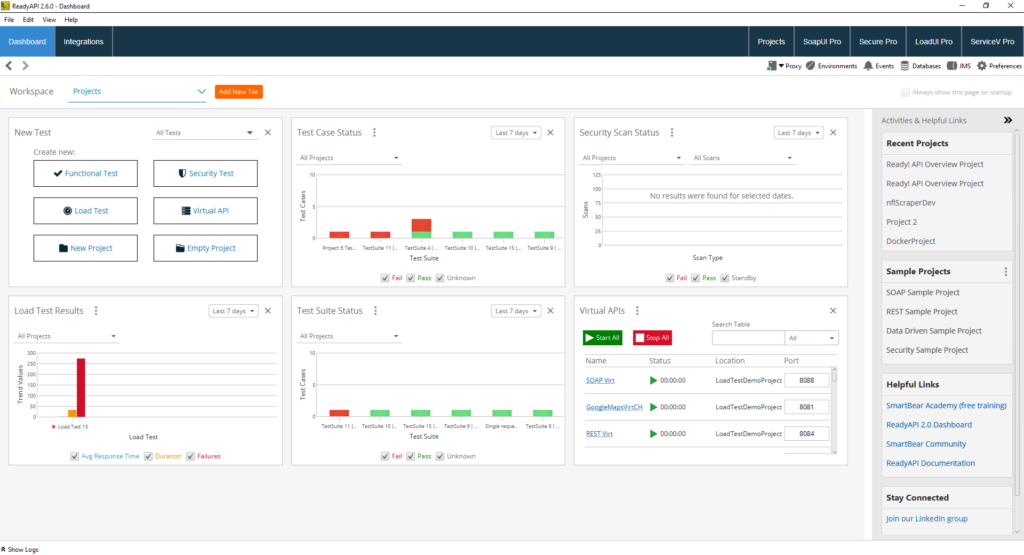
Smartbear has cemented its position in the API world as a sophisticated tool that offers in-depth analytics combined with sharp alerting mechanisms. Converging advanced monitoring with intelligent alerts, aids teams in not just identifying but also acting upon issues efficiently.
Why I Picked Smartbear: In my pursuit of the best monitoring tools, Smartbear's capability to offer actionable insights caught my eye. When choosing, I appreciated its robust alerting system that goes beyond the ordinary, making it a cut above the rest. It's clear to me that Smartbear is the optimal choice for those teams that prioritize actionable insights complemented by intelligent alerting.
Standout Features & Integrations:
Smartbear brings to the table advanced performance monitoring, which includes API uptime, functionality, and data validation checks. Additionally, its synthetic monitoring can simulate complex user scenarios across various endpoints.
For integrations, Smartbear connects effectively with platforms like Slack, JIRA, and PagerDuty.
Pros and Cons
Pros:
- Simulates complex user journeys with ease
- Robust and timely alerting mechanisms
- Deep analytical insights
Cons:
- Some users might find the UI less intuitive
- Limited features in the base plan
- Slightly steep learning curve for beginners

IBM API Connect is a comprehensive solution tailored for businesses that demand enterprise-level management of their API lifecycle. It facilitates the creation, deployment, management, and monitoring of APIs, with a clear focus on catering to large-scale enterprise needs.
Why I Picked IBM API Connect: When evaluating tools for API lifecycle management, IBM API Connect was an evident standout due to its robust features tailored for large-scale operations. My decision was swayed by its reputation for being a trusted choice for enterprises. In my judgment, for businesses that require end-to-end control over their API lifecycle with enterprise-grade robustness, IBM API Connect excels.
Standout Features & Integrations:
IBM API Connect offers a unified dashboard that provides insights into API health, usage, and overall performance. Its in-built developer portal promotes API adoption and collaboration.
For integrations, it supports connectivity with IBM Cloud services, Watson AI, and enterprise databases.
Pros and Cons
Pros:
- Robust analytics and monitoring tools
- Integrated developer portal for increased collaboration
- Comprehensive API lifecycle management
Cons:
- Initial setup and integration can be time-consuming
- The pricing structure can be complex for some users
- Might be overwhelming for small-scale operations

Kibana, a brainchild of the Elastic Stack, plays a crucial role in visualizing Elasticsearch data. Its prowess in real-time data visualization, paired with superior search capabilities, helps tech teams delve deeper into their data than ever.
Why I Picked Kibana: Navigating through the sea of API monitoring tools, Kibana caught my attention due to its intuitive and dynamic visualizations. I selected this tool based on its unique strength in helping users understand and act on their data.
When weighing its merits, it became clear that Kibana is genuinely best for those who value real-time data visualization and potent search mechanisms.
Standout Features & Integrations:
Kibana's dashboard offers a customizable workspace to visualize, navigate, and dissect complex data. Its Lens feature brings drag-and-drop capabilities to data visualization. Moreover, Kibana integrates with Elasticsearch, Logstash, and Beats, enhancing its utility manifold.
Pros and Cons
Pros:
- Powerful search across vast datasets
- Deep integration with the Elastic Stack
- Dynamic real-time data visualization
Cons:
- Advanced features demand a steeper learning curve
- Requires an Elastic Stack setup for maximum benefit
- Might feel overwhelming for beginners

Postman has etched its name in the tech industry as a developer's trusted companion for API testing. With its intuitive design, it facilitates both testing and monitoring, ensuring APIs function as intended.
Why I Picked Postman: Selecting tools for this list demanded a keen eye for utility, and Postman's developer-centric approach was hard to overlook. I chose it because of its user-friendly design that simplifies the complex realm of API testing. My judgment is that for those seeking a blend of simplicity and efficacy in API testing and monitoring, Postman remains a frontrunner.
Standout Features & Integrations:
Postman's collection runs enable automated testing, while its mock servers simulate API responses without any backend. The tool also integrates well with popular CI/CD platforms, ensuring testing in development pipelines. Key integrations include platforms like Jenkins, Travis CI, and CircleCI.
Pros and Cons
Pros:
- Robust integration with CI/CD platforms
- Comprehensive testing tools including mock servers
- Developer-friendly interface
Cons:
- Advanced features may require a learning curve
- Large collections can slow down the app
- Monitoring features can be basically compared to specialized tools

Catchpoint stands out as a beacon for those striving for optimal application experiences. With its robust platform, it transforms raw data into actionable insights, making it the go-to for application performance monitoring.
Why I Picked Catchpoint: Choosing tools for this list meant diving deep into their functionalities and discerning their unique value propositions. Catchpoint emerged as a winner for its unparalleled focus on application experience. I determined that for those chasing the best application insights, nothing beats Catchpoint.
Standout Features & Integrations:
Catchpoint’s Node.js monitoring provides deep insights into app health. Its synthetic monitoring spans various protocols, from HTTP to WebSockets. It smoothly integrates with platforms like Slack, ServiceNow, and Splunk, driving productivity and efficient incident management.
Pros and Cons
Pros:
- The wide array of integration options
- A variety of monitoring tests are available
- Comprehensive application experience monitoring
Cons:
- he vastness of features might be daunting for new users
- More expensive than some competitors
- Initial configuration can be time-consuming

Moesif distinguishes itself by focusing intently on API user behavior analytics. This platform not only tracks API calls but delves deeper into analyzing how users interact, offering a granular view of user behavior.
Why I Picked Moesif: After comparing a plethora of API tools, Moesif's emphasis on behavior analytics resonated with me. My decision was influenced by its unparalleled capability to delve into API usage patterns, something most tools skim over. For businesses keen on understanding the nuances of how their APIs are consumed, Moesif stands unmatched.
Standout Features & Integrations:
Moesif offers detailed user profiles that track individual API usage, enhancing personalization efforts. Its time series metrics, paired with segmentation capabilities, offer profound insights.
On the integration front, Moesif smoothly integrates with platforms like Segment, Datadog, and PagerDuty.
Pros and Cons
Pros:
- Comprehensive time-series metrics
- Individual user tracking for better personalization
- In-depth behavior analytics
Cons:
- Initial setup may require some technical know-how
- Pricing can get steep for larger teams
- Can be overwhelming due to the depth of data
Weitere API-Monitoring-Tools
Nachfolgend finden Sie eine Liste zusätzlicher API-Monitoring-Tools, die ich in die engere Auswahl genommen, aber nicht in die Top 10 aufgenommen habe. Sie sind definitiv einen Blick wert.
- Astera
For holistic API management and integration
- APImetrics
For comprehensive API performance insights
- Uptrends
For global perspective with multiple checkpoint locations
- Dotcom Monitor
For multi-step API monitoring
- Treblle
For real-time API performance insights
- AppDynamics
Good for deep dive diagnostics in real-time
- New Relic
Good for application health visualizations
- Splunk
Good for extensive log analysis capabilities
- Sensu
Good for event monitoring in dynamic environments
- OpenNMS
Good for network fault and performance management
- Grafana Cloud
Good for customizable monitoring dashboards
- Ghost Inspector
Good for automated UI testing and monitoring
- Apica
Good for large-scale load testing scenarios
- StatusCake API
Good for comprehensive uptime checks
- APIMatic
Good for SDK generation from API definitions
- Runscope
Good for API data validation tests
- Rapid API
Good for vast API marketplace connections
- LoadView
Good for dynamic API load testing
- 3Scale
Good for API traffic control and security


Auswahlkriterien für API-Monitoring-Tools
Bei der Auswahl der besten API-Monitoring-Tools für diese Liste habe ich typische Anforderungen und Schmerzpunkte wie die Sicherstellung der API-Verfügbarkeit und das Erkennen von Performance-Problemen berücksichtigt. Zudem habe ich folgendes Bewertungsraster verwendet, um die Bewertung nachvollziehbar und fair zu halten:
Kernfunktionen (25 % der Gesamtwertung)
Um in diese Liste aufgenommen zu werden, musste jede Lösung diese typischen Anwendungsfälle erfüllen:
- API-Verfügbarkeit überwachen
- Antwortzeiten messen
- Warnungen bei Ausfällen generieren
- Performance-Metriken bereitstellen
- Unterstützung verschiedener API-Protokolle
Zusätzliche herausragende Funktionen (25 % der Gesamtwertung)
Um die Auswahl weiter einzugrenzen, habe ich außerdem nach einzigartigen Funktionen gesucht, zum Beispiel:
- Echtzeit-Analyse
- Anpassbare Dashboards
- KI-gestützte Einblicke
- Integration in CI/CD-Pipelines
- Tests in mehreren Regionen
Benutzerfreundlichkeit (10 % der Gesamtwertung)
Um die Bedienbarkeit jeder Lösung einzuschätzen, habe ich auf Folgendes geachtet:
- Intuitive Benutzeroberfläche
- Einfache Navigation
- Anpassbare Einstellungen
- Geringe Einarbeitungszeit
- Verständliche Dokumentation
Onboarding (10 % der Gesamtwertung)
Um das Onboarding jeder Plattform zu bewerten, habe ich folgende Kriterien herangezogen:
- Verfügbarkeit von Schulungsvideos
- Interaktive Produkttouren
- Zugriff auf Vorlagen
- Vorhandensein von Chatbots
- Regelmäßige Webinare
Kundensupport (10% der Gesamtbewertung)
Um die Kundensupport-Dienste jedes Softwareanbieters zu bewerten, habe ich Folgendes berücksichtigt:
- 24/7 Erreichbarkeit
- Live-Chat-Support
- Umfassende Wissensdatenbank
- Zügige Reaktion auf Anfragen
- Zugang zu technischen Experten
Preis-Leistungs-Verhältnis (10% der Gesamtbewertung)
Um das Preis-Leistungs-Verhältnis jeder Plattform zu bewerten, habe ich Folgendes berücksichtigt:
- Wettbewerbsfähige Preisgestaltung
- Flexible Abo-Modelle
- Verfügbarkeit einer kostenlosen Testphase
- Kosten-Nutzen-Verhältnis
- Rabatte bei jährlicher Abrechnung
Kundenbewertungen (10% der Gesamtbewertung)
Um die allgemeine Kundenzufriedenheit besser einzuschätzen, habe ich bei der Auswertung von Kundenbewertungen auf Folgendes geachtet:
- Nutzerzufriedenheitsbewertungen
- Feedback zur Zuverlässigkeit
- Kommentare zur Benutzerfreundlichkeit
- Meinungen zum Kundensupport
- Erkenntnisse zur Wirksamkeit der Funktionen
So wählen Sie API-Monitoring-Tools aus
Es ist leicht, sich in langen Funktionslisten und komplexen Preisstrukturen zu verlieren. Damit Sie während Ihres individuellen Software-Auswahlprozesses den Überblick behalten, finden Sie hier eine Checkliste der wichtigsten Faktoren:
| Faktor | Worauf Sie achten sollten |
|---|---|
| Skalierbarkeit | Kann das Tool Ihr erwartetes Wachstum bei API-Aufrufen und Nutzern bewältigen? Achten Sie auf eine skalierbare Architektur, damit es bei steigendem Bedarf nicht zu Engpässen kommt. |
| Integrationen | Lässt es sich einfach in Ihre bestehenden Systeme wie CI/CD-Pipelines oder Benachrichtigungstools integrieren? Prüfen Sie die Kompatibilität mit Ihrem Tech-Stack. |
| Anpassbarkeit | Können Sie das Tool an spezielle Überwachungsbedürfnisse oder Workflows anpassen? Achten Sie auf anpassbare Dashboards und Warnmeldungen, die Ihren Anforderungen entsprechen. |
| Benutzerfreundlichkeit | Ist die Benutzeroberfläche für Ihr Team intuitiv zu bedienen? Eine steile Lernkurve kann die Einführung verzögern – setzen Sie also auf ein durchdachtes Design und eine klare Navigation. |
| Implementierung und Einführung | Wie schnell kann Ihr Team mit dem Tool arbeiten? Beachten Sie die Verfügbarkeit von Schulungsmaterialien und Unterstützung während der Einführungsphase. |
| Kosten | Passen die Preise zu Ihrem Budget? Vergleichen Sie Abo-Modelle und prüfen Sie auf versteckte Gebühren. Achten Sie auf kostenlose Testphasen, bevor Sie sich festlegen. |
| Sicherheitsmaßnahmen | Bietet das Tool Verschlüsselung und die Einhaltung von Sicherheitsstandards? Stellen Sie sicher, dass sensible Daten geschützt werden und Ihre Sicherheitsanforderungen erfüllt sind. |
Was sind API-Monitoring-Tools?
API-Monitoring-Tools sind Softwarelösungen, die die Leistung, Verfügbarkeit und den Zustand von APIs überwachen. Sie werden von Entwicklern, DevOps-Ingenieuren und QA-Teams eingesetzt, um sicherzustellen, dass APIs wie erwartet funktionieren und Probleme erkannt werden, bevor sie Nutzern auffallen.
Alarmierungen, Protokolle und Reporting-Funktionen helfen dabei, Ausfälle zu erkennen, langsame Reaktionszeiten zu untersuchen und die Einhaltung von Service-Level-Agreements (SLAs) zu prüfen. Diese Tools erleichtern es, zuverlässige Dienste bereitzustellen und Probleme zu vermeiden, die das Nutzererlebnis beeinträchtigen.
Funktionen
Achten Sie bei der Auswahl von API-Monitoring-Tools auf folgende Schlüsselfunktionen:
- Uptime-Überwachung: Überwacht die Verfügbarkeit von APIs, um sicherzustellen, dass sie zugänglich und ordnungsgemäß funktionsfähig sind.
- Reaktionszeit-Überwachung: Misst, wie schnell APIs auf Anfragen reagieren, um Performance-Engpässe zu identifizieren.
- Benachrichtigungen bei Störungen: Sendet Warnmeldungen, wenn Probleme erkannt werden, sodass umgehend auf potenzielle Störungen reagiert werden kann.
- Anpassbare Dashboards: Bietet maßgeschneiderte Ansichten von API-Leistungskennzahlen, um individuelle Überwachungsanforderungen zu erfüllen.
- Integrationsmöglichkeiten: Lässt sich problemlos mit bestehenden Systemen wie CI/CD-Pipelines und Warnsystemen für einen nahtlosen Workflow verbinden.
- Sicherheitskonformität: Sorgt durch Einhaltung von Sicherheitsstandards und Verschlüsselungsprotokollen für den Schutz von Daten.
- Echtzeit-Analysen: Bietet sofortige Einblicke in die API-Performance und ermöglicht proaktives Performance-Management.
- Tests in mehreren Regionen: Simuliert API-Anfragen aus verschiedenen Standorten, um globale Leistung und Latenz zu beurteilen.
- KI-basierte Erkenntnisse: Nutzt künstliche Intelligenz, um Anomalien zu erkennen und potenzielle Probleme frühzeitig vorherzusagen.
Vorteile
Der Einsatz von API-Überwachungstools bietet Ihrem Team und Ihrem Unternehmen zahlreiche Vorteile. Hier sind einige, auf die Sie sich freuen können:
- Erhöhte Zuverlässigkeit: Durch die Überwachung der Erreichbarkeit helfen diese Tools, APIs durchgängig verfügbar und zuverlässig zu halten.
- Schnellere Problembehebung: Mit Benachrichtigungen kann Ihr Team Probleme zügig beheben und so Ausfallzeiten und Serviceunterbrechungen minimieren.
- Verbesserte Performance: Die Überwachung der Reaktionszeiten hilft, Engpässe zu erkennen und zu beheben, sodass APIs effizient arbeiten.
- Fundierte Entscheidungen: Echtzeit-Analysen liefern Einblicke in API-Nutzung und Performance und unterstützen datengestützte Entscheidungen.
- Erhöhte Sicherheit: Die Einhaltung von Sicherheitsstandards trägt dazu bei, sensible Daten zu schützen und das Vertrauen der Nutzer zu erhalten.
- Bewertung der globalen Reichweite: Mit Tests in mehreren Regionen kann Ihr Team die API-Performance in verschiedenen geografischen Regionen evaluieren.
- Proaktives Management: KI-basierte Einblicke helfen, potenzielle Probleme vorherzusehen und zu beheben, bevor sie Nutzer beeinträchtigen.
Kosten & Preisgestaltung
Die Auswahl von API-Überwachungstools erfordert ein Verständnis der verschiedenen Preismodelle und verfügbaren Tarife. Die Kosten variieren je nach Funktionsumfang, Teamgröße, Zusatzfunktionen und mehr. Die folgende Tabelle fasst gängige Tarife, ihre Durchschnittspreise und typische Funktionen von Lösungen zur API-Überwachung zusammen:
Tarifvergleichstabelle für API-Überwachungstools
| Tarifart | Durchschnittlicher Preis | Übliche Funktionen |
|---|---|---|
| Kostenloser Tarif | $0 | Grundlegende Uptime-Überwachung, begrenzte Benachrichtigungen und Basis-Analysen. |
| Persönlicher Tarif | $5-$25/user/month | Überwachung von Verfügbarkeit und Reaktionszeiten, anpassbare Dashboards und E-Mail-Benachrichtigungen. |
| Geschäftlicher Tarif | $50-$150/user/month | Multi-Region-Tests, Integrationen, Echtzeit-Analysen und erweiterte Benachrichtigungen. |
| Enterprise-Tarif | $200+/user/month | KI-gesteuerte Einblicke, erweiterte Sicherheitskonformität, dedizierter Support und vollständige Anpassbarkeit. |
API-Überwachungstools FAQs
Hier sind einige Antworten auf häufig gestellte Fragen zu API-Überwachungstools:
Wie überwacht man die Nutzung von APIs?
Die Nutzung von APIs wird typischerweise durch Überwachung der Betriebszeit (Uptime) verfolgt, die als Prozentsatz der verfügbaren Zeit angegeben wird. Die meisten streben eine Uptime von 99,9 % oder höher an. Überwachungstools können Sie über Ausfälle benachrichtigen, sodass Sie Probleme schnell beheben können.
Welche Aspekte einer API sollten überwacht werden?
Wichtige Aspekte zur Überwachung sind Zugriffskontrollverwaltung, Sicherheitsdienste und Netzwerkkonfiguration der Firewall. Tools sollten auch die Verwaltung von SSL/TLS sowie übergreifende Funktionen zur einheitlichen Verwaltung bieten, um eine umfassende Überwachung der Leistung und Sicherheit Ihrer API zu gewährleisten.
Wie oft sollte man APIs testen?
Regelmäßiges Testen ist entscheidend, viele Tools bieten dabei Überprüfungen im Minutentakt an. Häufige Tests helfen, Probleme frühzeitig zu erkennen und die Zuverlässigkeit zu gewährleisten. Richten Sie Ihr Überwachungssystem so ein, dass jede API mindestens alle paar Minuten getestet wird, um eine gleichmäßige Performance sicherzustellen.
Warum sind Alarmbenachrichtigungen bei der API-Überwachung wichtig?
Alarmbenachrichtigungen sind unerlässlich, da sie Sie sofort über auftretende Probleme informieren und so eine schnelle Lösung ermöglichen. Ohne rechtzeitige Benachrichtigungen können Probleme unbemerkt bleiben, was zu längeren Ausfallzeiten und einer Verschlechterung der Nutzererfahrung führen kann.
Warum variieren die Preise zwischen den verschiedenen Tools so stark?
Die Kosten eines API-Überwachungstools werden von mehreren Faktoren beeinflusst: Umfang und Qualität der Funktionen, Zielgruppe, Skalierbarkeit, Markenbekanntheit und das Niveau des angebotenen Kundensupports.
Wie geht es weiter:
Wenn Sie gerade dabei sind, sich über API-Überwachungstools zu informieren, kontaktieren Sie einen SoftwareSelect-Berater für kostenlose Empfehlungen.
Sie füllen ein Formular aus und führen ein kurzes Gespräch, bei dem Ihre spezifischen Anforderungen besprochen werden. Anschließend erhalten Sie eine Auswahlliste mit geeigneter Software zur Prüfung. Die Berater unterstützen Sie sogar während des gesamten Kaufprozesses, einschließlich Preisverhandlungen.