

IT operations management software helps you manage—and make sense of—your entire IT infrastructure, covering monitoring, automation, security, and service health across on-premise and cloud environments.
This list is built for CTOs and IT leaders who need unified insight, faster root cause analysis, and solutions ready for hybrid and multi-cloud operations. You’ll find options for AI-driven automation, deep observability, native security integrations, and the customizability you need to scale what matters.
Why Trust Our Software Recommendations
6,700+
Reviews
20
Industry experts
16+
Evaluation factors
14
Years
Our team has been testing and reviewing software since 2012. As tech leaders ourselves, we know how difficult—and important—it is to choose the right software.
For this guide, we evaluated tools using hands-on testing and independent research, scoring tools using our selection criteria.
Our reviews reflect our human editorial judgment, not a sales pitch.
Expert reviewers:
- Paulo Gardini MiguelTech Director
 Tim FisherVP of AI
 Gabriel RosasTech Lead & Software Architect
 Christhian GruhnTech Lead & Platform Architect

Compare The Best IT Operations Management Software
Compare pricing and specs, side by side, for the IT operations management software that made it onto my shortlist.
| Tool | Best For | Trial Info | Price | ||
|---|---|---|---|---|---|
| 1 | Best for SecOps-fused log and metrics ops | Free trial available | From $0.15/credit | Website | |
| 2 | Best for OTel-native full-stack ops visibility | 7-day free trial | From $0.07/GB | Website | |
| 3 | Best for MSP-grade multi-tenant hybrid ITOps | Free demo available | Pricing upon request | Website | |
| 4 | Best for deep storage and GPU ops visibility | Free demo available | Pricing upon request | Website | |
| 5 | Best for AI-driven full-stack release validation | Free demo available | From $4.50/1000 sessions | Website | |
| 6 | Best for AI-driven alert-to-topology root cause ops | 14-day free trial | Pricing upon request | Website | |
| 7 | Best for transaction-level full-stack observability | Free plan + free demo available | Pricing upon request | Website | |
| 8 | Best for CMDB-anchored hybrid IT ops at scale | Free demo available | Pricing upon request | Website | |
| 9 | Best for Cisco-native cross-domain service health ops | Free demo available | Pricing upon request | Website | |
| 10 | Best for agentic AI across mainframe-to-cloud ops | Free demo available | Pricing upon request | Website |


Best IT Operations Management Software Reviews
Below are my detailed summaries of the best IT operations management software that made it onto my shortlist. My reviews offer a detailed look at the features, best use cases, and integrations of each platform to help you find the best one for you.
 Best for SecOps-fused log and metrics ops
- Free trial available
- From $0.15/credit
Visit WebsiteCustomer Rating:4.3/5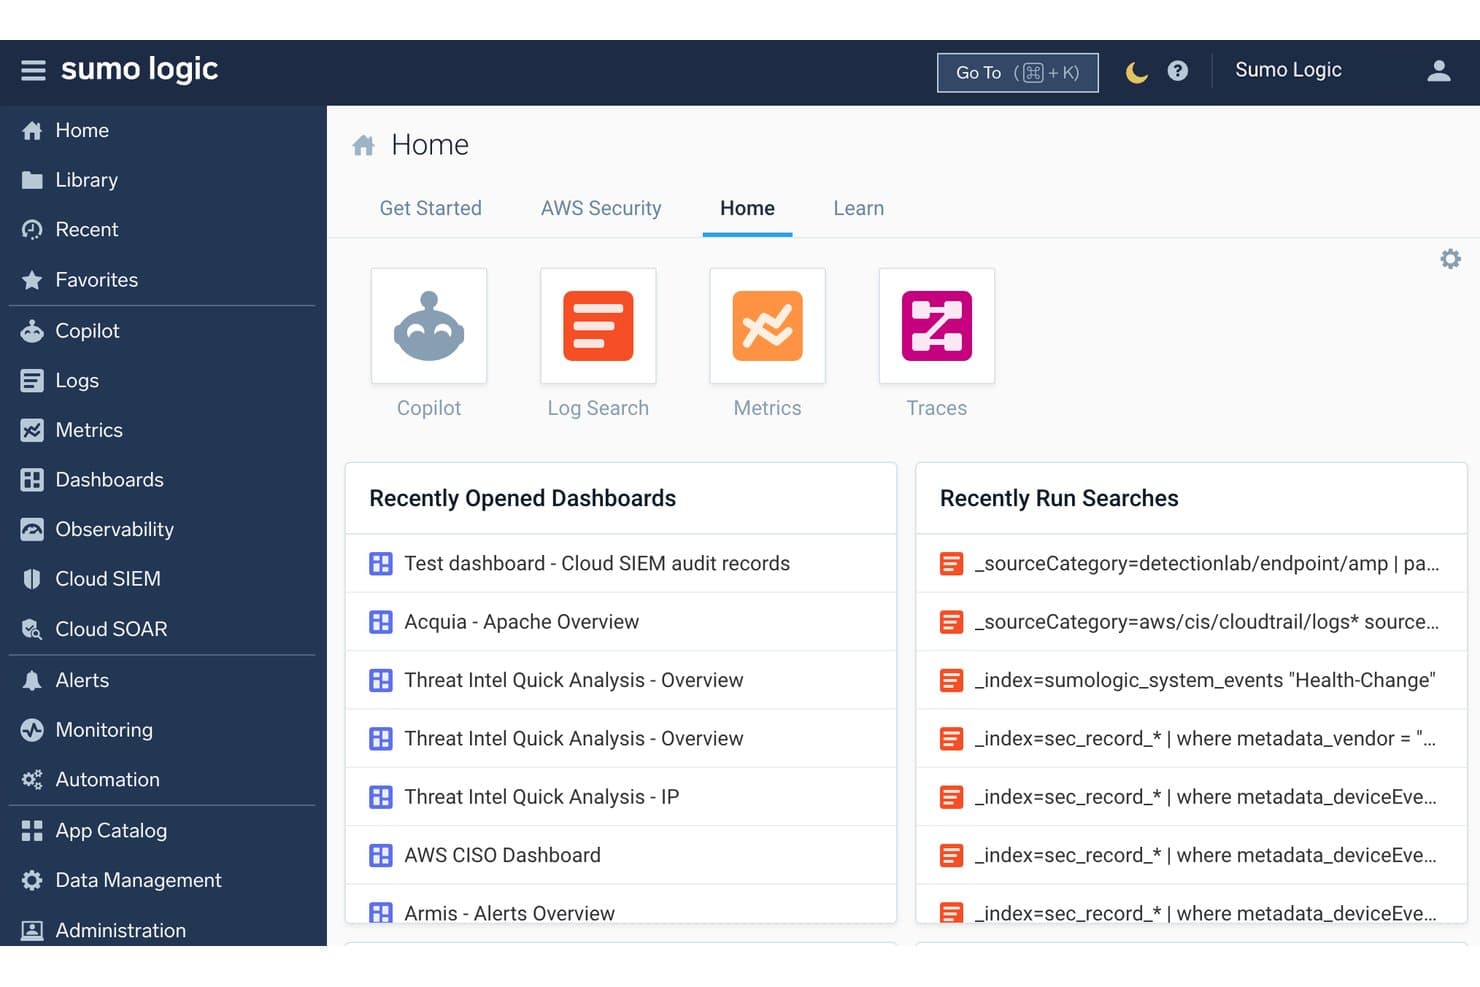
Sumo Logic gives teams quick access to log search, metrics, and recent activity. Sumo Logic is a cloud-native IT operations management platform that unifies log analytics, infrastructure monitoring, metrics, distributed tracing, and security operations into a single SaaS-based observability and SIEM solution.
Who Is Sumo Logic Best For?
Sumo Logic is a strong fit for security-conscious IT and operations teams that need log analytics, metrics, and SIEM capabilities in a single SaaS platform.
Why I Picked Sumo Logic
Sumo Logic earns its spot on my shortlist because it's one of the few platforms that collapses log analytics and security operations into a single, genuinely unified SaaS tool. I like how its patented LogReduce and LogExplain operators surface root causes directly from raw log data, cutting the manual pattern-hunting that slows incident resolution. The Dojo AI multi-agent platform also stands out: the SOC Analyst Agent automates tier-1 alert triage and delivers evidence-backed verdicts, which my team finds invaluable when SecOps and ITOps workflows overlap.
Sumo Logic Key Features
- AI-driven metrics monitors: ML-based anomaly detection auto-tunes seasonal baselines on your metrics data, cutting false-positive alert volume.
- Multi-org management: A parent org controls monitors, dashboards, roles, and access across child organizations from a single centralized interface.
- Compliance reporting dashboards: Prebuilt dashboards map your data against PCI, HIPAA, GDPR, SOX, and ISO frameworks for continuous posture visibility.
- OpenTelemetry Distribution Agent: A single unified agent collects logs, metrics, and traces across Linux, Windows, macOS, and 25+ source configurations.
Sumo Logic Integrations
Sumo Logic offers 450+ integrations, including ServiceNow, PagerDuty, Jira, Slack, Microsoft Teams, AWS, Microsoft Azure, Google Cloud Platform, Kubernetes, and Docker. It also provides REST APIs, webhooks, Terraform, SumoQL, and an Open Integration Framework for custom connectivity.
Pros and Cons
Pros:
- Centralizes logs, metrics, and traces in one platform
- Compliance dashboards map directly to major frameworks
- Dojo AI automates incident triage and resolution
Cons:
- Querying large historical data sets can be slow
- Advanced automation favors security over IT operations
 Best for OTel-native full-stack ops visibility
- 7-day free trial
- From $0.07/GB
Visit WebsiteCustomer Rating:4.3/5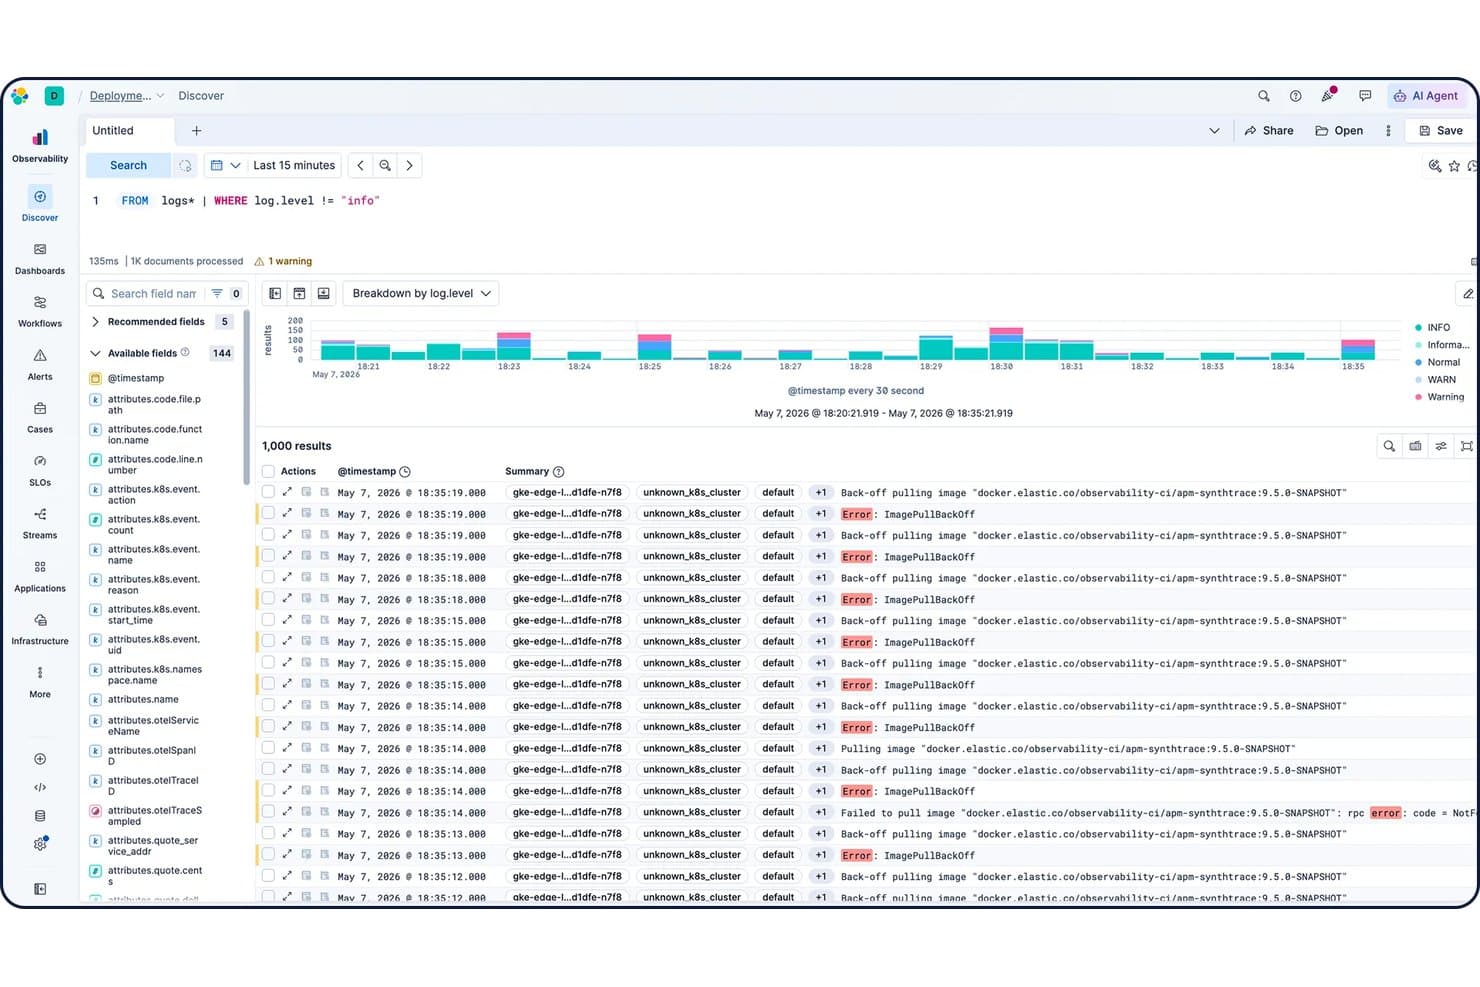
Elastic Observability filters logs by level in the Discover view. Elastic Observability is a full-stack observability platform that unifies log monitoring, infrastructure metrics, APM, distributed tracing, synthetic monitoring, and AIOps across on-premises, cloud, and hybrid environments.
Who Is Elastic Observability Best For?
Elastic Observability is a strong fit for SREs and infrastructure engineers at mid-to-large enterprises who need unified log, metric, trace, and APM visibility across hybrid and multi-cloud environments—especially teams already invested in OpenTelemetry.
Why I Picked Elastic Observability
Elastic Observability earns its spot on my shortlist because it's one of the few platforms built OpenTelemetry-first, meaning your logs, metrics, traces, and APM data all land in a single schema without forcing you to wrestle with proprietary agents. I particularly like the zero-config ML layer: 100+ preconfigured anomaly detection jobs run automatically across every data stream, so when Comcast-scale ingestion happens, your team isn't manually tuning models. The Streams-based log parsing and ES|QL query engine make pinpointing root causes across hybrid environments genuinely fast.
Elastic Observability Key Features
- Synthetic monitoring: Run lightweight and full browser tests against user journeys using a global managed testing infrastructure or private on-premises locations.
- Service Level Objective (SLO) tracking: Define, monitor, and report on reliability targets directly within Kibana alongside your existing dashboards and alerts.
- Kibana alerting: Configure rule-based alerts across APM, metrics, uptime, and security data using form-based setup with multi-channel notification support.
- 550+ prebuilt integrations: Connect to cloud providers, ITSM tools, security platforms, and data sources using prebuilt agents and agentless collectors.
Elastic Observability Integrations
Elastic Observability offers 550+ prebuilt integrations, including AWS, Microsoft Azure, Google Cloud Platform, ServiceNow, Jira, PagerDuty, Slack, Microsoft Teams, Kubernetes, and OpenTelemetry. It also supports REST APIs, webhooks, Elastic Agent, Logstash, Beats, and OpenTelemetry collectors for custom connectivity.
Pros and Cons
Pros:
- OTel-native ingestion avoids vendor lock-in
- Zero-config ML detects anomalies automatically
- Unified visibility across hybrid and multi-cloud
Cons:
- Documentation lacking for complex OTel setups
- Native on-call scheduling is not included
Learn more about Elastic Observability: Best for MSP-grade multi-tenant hybrid ITOps
- Free demo available
- Pricing upon request
Visit WebsiteCustomer Rating:4.1/5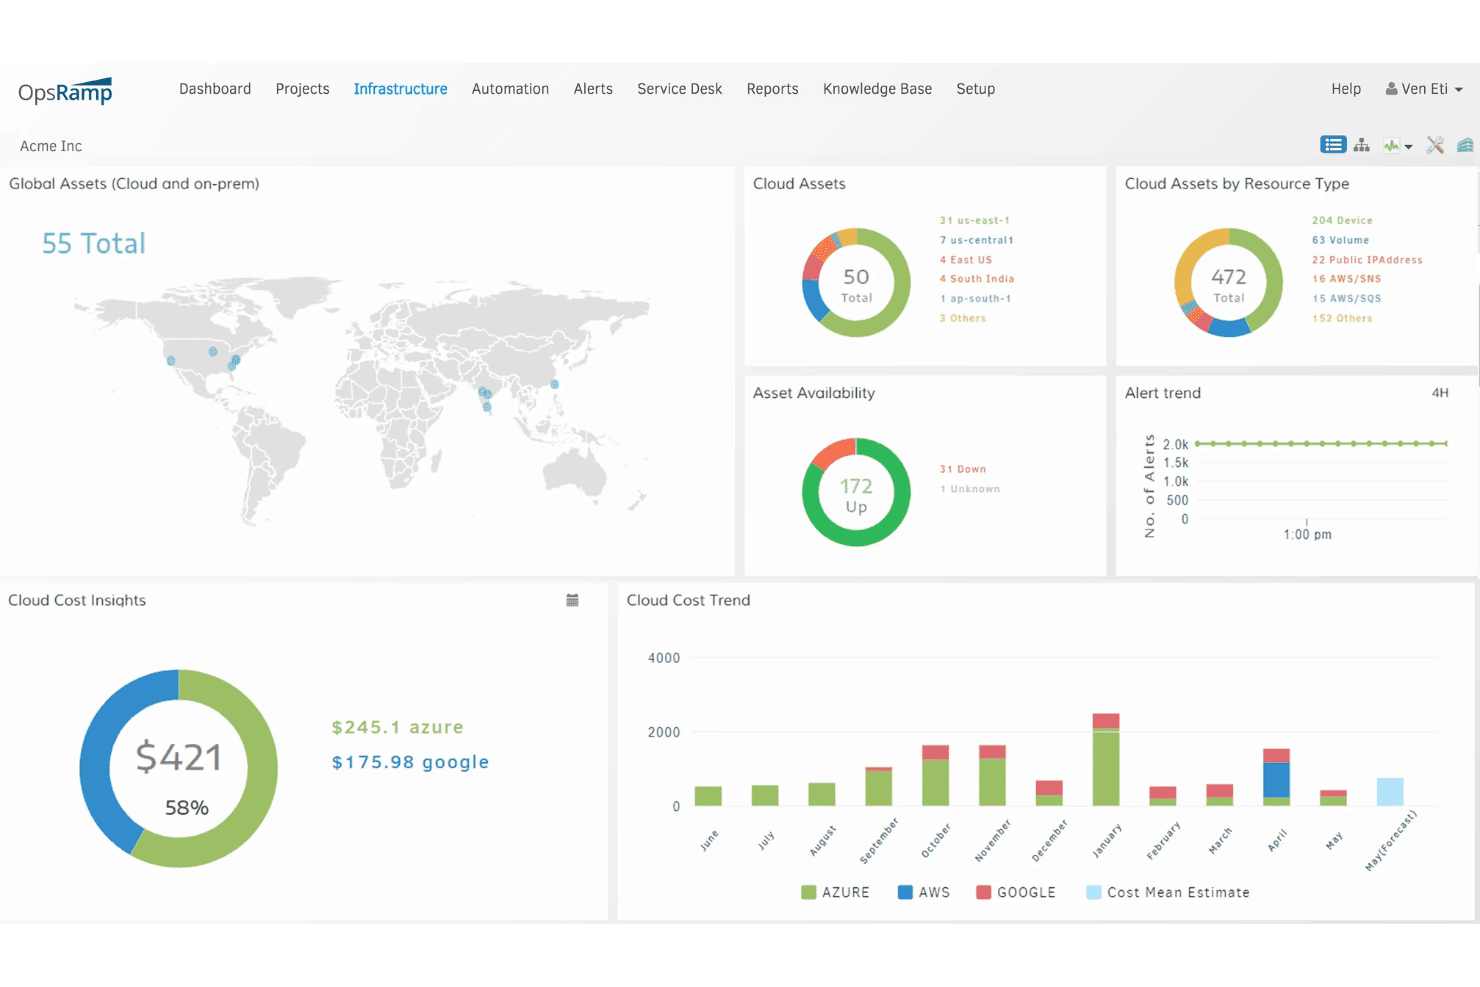
OpsRamp gives users a unified view of cloud costs, assets, and alerts. HPE OpsRamp is an AIOps-driven IT operations management platform that unifies infrastructure monitoring, event correlation, incident management, runbook automation, and hybrid/multi-cloud visibility across on-premises, private cloud, and public cloud environments.
Who Is OpsRamp Best For?
OpsRamp is a strong fit for managed service providers and large enterprises running complex hybrid IT estates across on-premises and multi-cloud environments.
Why I Picked OpsRamp
OpsRamp earns its spot on my shortlist because its multi-tenant architecture is purpose-built for MSPs managing dozens of client environments from a single pane of glass. I particularly like its AIOps event correlation engine, which groups related alerts across tenants and cuts noise by up to 90%, so your team isn't drowning in tickets across client accounts. Its topology and service maps give you a live dependency view across hybrid estates spanning AWS, Azure, GCP, and on-prem, which is genuinely hard to replicate at that scale.
OpsRamp Key Features
- Runbook automation engine: Execute predefined remediation scripts automatically in response to detected issues, with RBAC-governed access to jobs and process workflows.
- Multi-tenant client management: Manage multiple client environments from a single platform instance, with per-tenant integration configuration and isolated data handling.
- Cloud cost reporting: Break down cloud spend by account, region, service, and instance type across AWS, Azure, and GCP with customizable date ranges.
- OpenTelemetry intake: Ingest metrics, logs, and traces from any OpenTelemetry-compatible source alongside eBPF-assisted auto-instrumentation for deep workload visibility.
OpsRamp Integrations
OpsRamp offers 3,000+ integrations, including ServiceNow, Jira Service Management, Zendesk, AWS, Microsoft Azure, Google Cloud Platform, Kubernetes, OpenTelemetry, and Prometheus. Its OAuth 2.0 REST API, webhooks, and JSON import/export support custom connections.
Pros and Cons
Pros:
- Hybrid and multi-cloud topology visualizations
- Up to 90 percent alert noise reduction
- Multi-tenant management for MSP client environments
Cons:
- Dashboard performance can lag at large scale
- Application monitoring features still maturing
Learn more about OpsRamp: Best for deep storage and GPU ops visibility
- Free demo available
- Pricing upon request
Visit WebsiteCustomer Rating:4.3/5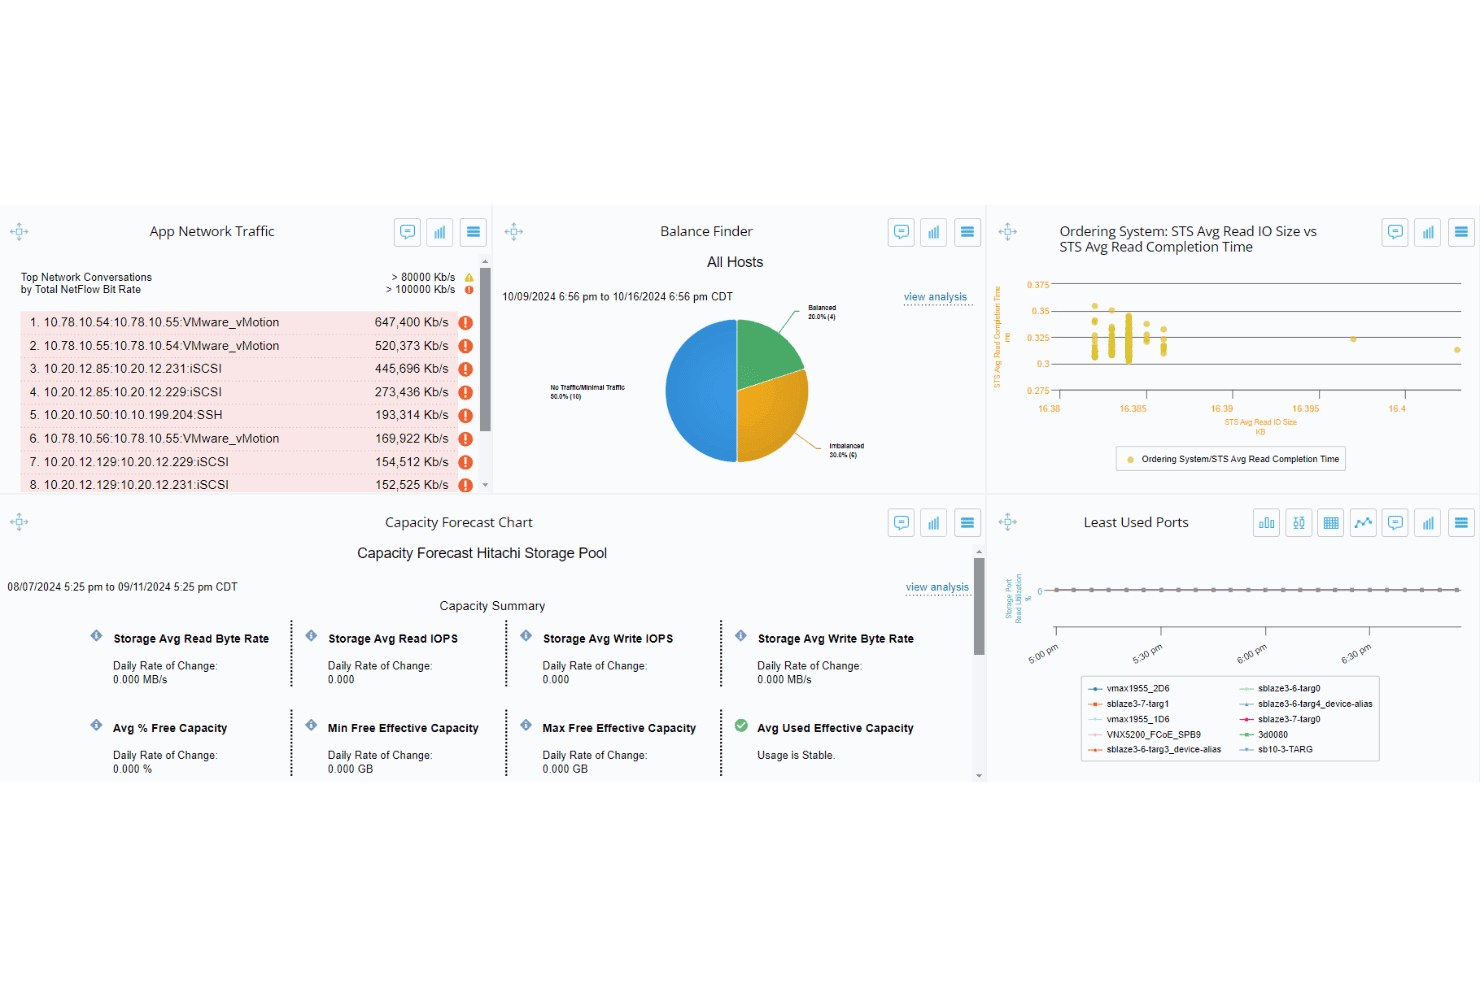
Virtana monitors network traffic, storage capacity, and host balance in one dashboard. Virtana is an AIOps and infrastructure observability platform that monitors hybrid environments across compute, storage, network, Kubernetes, and GPU infrastructure, with AI-driven event correlation, anomaly detection, and automated incident management built into its core.
Who Is Virtana Best For?
Virtana is a strong fit for infrastructure and NetOps engineers managing complex hybrid environments where storage depth, GPU workload visibility, and AI-driven incident correlation are non-negotiable.
Why I Picked Virtana
I picked Virtana as one of the best because no other platform on my shortlist collects storage metrics at this depth: 16,000+ metrics spanning block, NAS, SAN, SDS, and HCI environments, all correlated against compute and network context in real time. I'm especially impressed by its dedicated AI Factory Observability module, which tracks GPU utilization, idle capacity, throttling, and NVLink/PCIe throughput for teams running LLM training or inference workloads at scale. Its ML-based anomaly detection hits up to 95% accuracy, surfacing issues before thresholds breach rather than after the damage is done.
Virtana Key Features
- Agentic AI remediation: AI agents traverse your system dependency graph to autonomously investigate issues and execute governed remediation workflows without manual handoffs.
- Predictive capacity forecasting: Uses up to 12 months of historical data to forecast compute, storage, network, and GPU capacity needs up to a year out.
- ServiceNow bidirectional sync: Automatically creates, updates, and closes ServiceNow incidents based on detected events, with business criticality mapping and CMDB integration.
- Topology and dependency mapping: Continuously auto-discovers and maps relationships across applications, services, and infrastructure to maintain a live, queryable system model.
Virtana Integrations
Virtana has a native ServiceNow integration plus integrations with Slack, Microsoft Teams, PagerDuty, AWS, Azure, GCP, Kubernetes, VMware, and OpenTelemetry. REST APIs and an MCP server support custom integrations and AI-agent access.
Pros and Cons
Pros:
- AI-driven anomaly detection achieves high accuracy
- Tracks GPU and AI workload performance natively
- Collects 16,000+ storage metrics across environments
Cons:
- Review base is smaller than major competitors
- User interface visualizations can feel limited
Learn more about Virtana: Best for AI-driven full-stack release validation
- Free demo available
- From $4.50/1000 sessions
Visit WebsiteCustomer Rating:4.5/5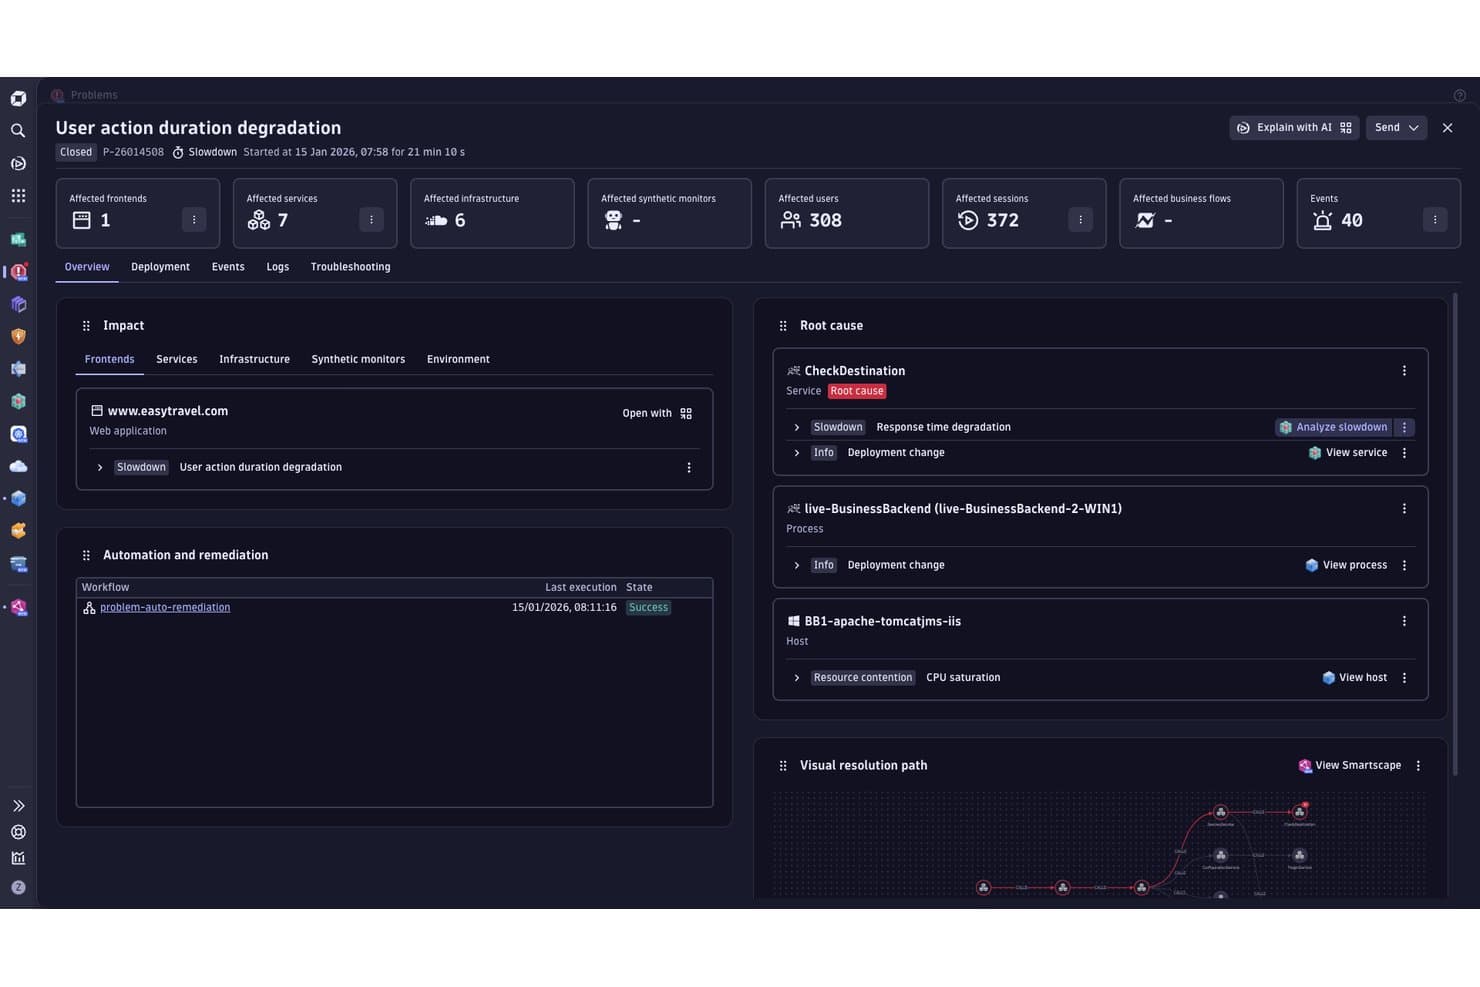
Dynatrace pinpoints root causes of performance issues automatically. Dynatrace is a full-stack IT operations management platform that spans infrastructure monitoring, AIOps-driven incident detection, log analytics, and workflow automation across hybrid and multi-cloud environments.
Who Is Dynatrace Best For?
Dynatrace is a strong fit for enterprise IT and SRE teams managing complex hybrid or multi-cloud environments who need AI-driven observability, automated incident response, and release validation at scale.
Why I Picked Dynatrace
I picked Dynatrace as one of the best because its Site Reliability Guardian is the most thorough release validation setup I've seen in this category: it automatically evaluates every deployment against predefined SLOs and KPIs before code reaches production, blocking bad releases without manual review. Pair that with Davis AI's ability to trace a production anomaly back to a single root cause across billions of live dependencies, and you get a platform that catches what slips past quality gates and explains exactly why.
Dynatrace Key Features
- Smartscape topology mapping: Auto-discovers and visualizes real-time dependencies across hosts, containers, services, and processes in hybrid and multi-cloud environments.
- Grail data lakehouse: Unifies metrics, logs, traces, events, and security signals in a single index-free store, queryable via DQL without schema configuration.
- AutomationEngine workflow builder: A no-code/low-code visual editor for building event-driven or scheduled automation workflows grounded in live observability data.
- Predictive alerting: Forecasts capacity and performance violations before they occur using continuously learned behavioral baselines across every monitored component.
Dynatrace Integrations
Dynatrace offers 900+ integrations through Dynatrace Hub, including ServiceNow, Jira Service Management, PagerDuty, Slack, Microsoft Teams, AWS, Azure, Google Cloud, and OpenTelemetry. Its REST API, webhooks, and AppEngine SDK support custom integrations.
Pros and Cons
Pros:
- Automated remediation with human-in-the-loop controls
- Davis AI pinpoints true root cause
- Single agent auto-discovers full-stack assets
Cons:
- SaaS-only limits options for air-gapped needs
- Consumption pricing difficult for budgeting
 Best for AI-driven alert-to-topology root cause ops
- 14-day free trial
- Pricing upon request
Visit WebsiteCustomer Rating:4.5/5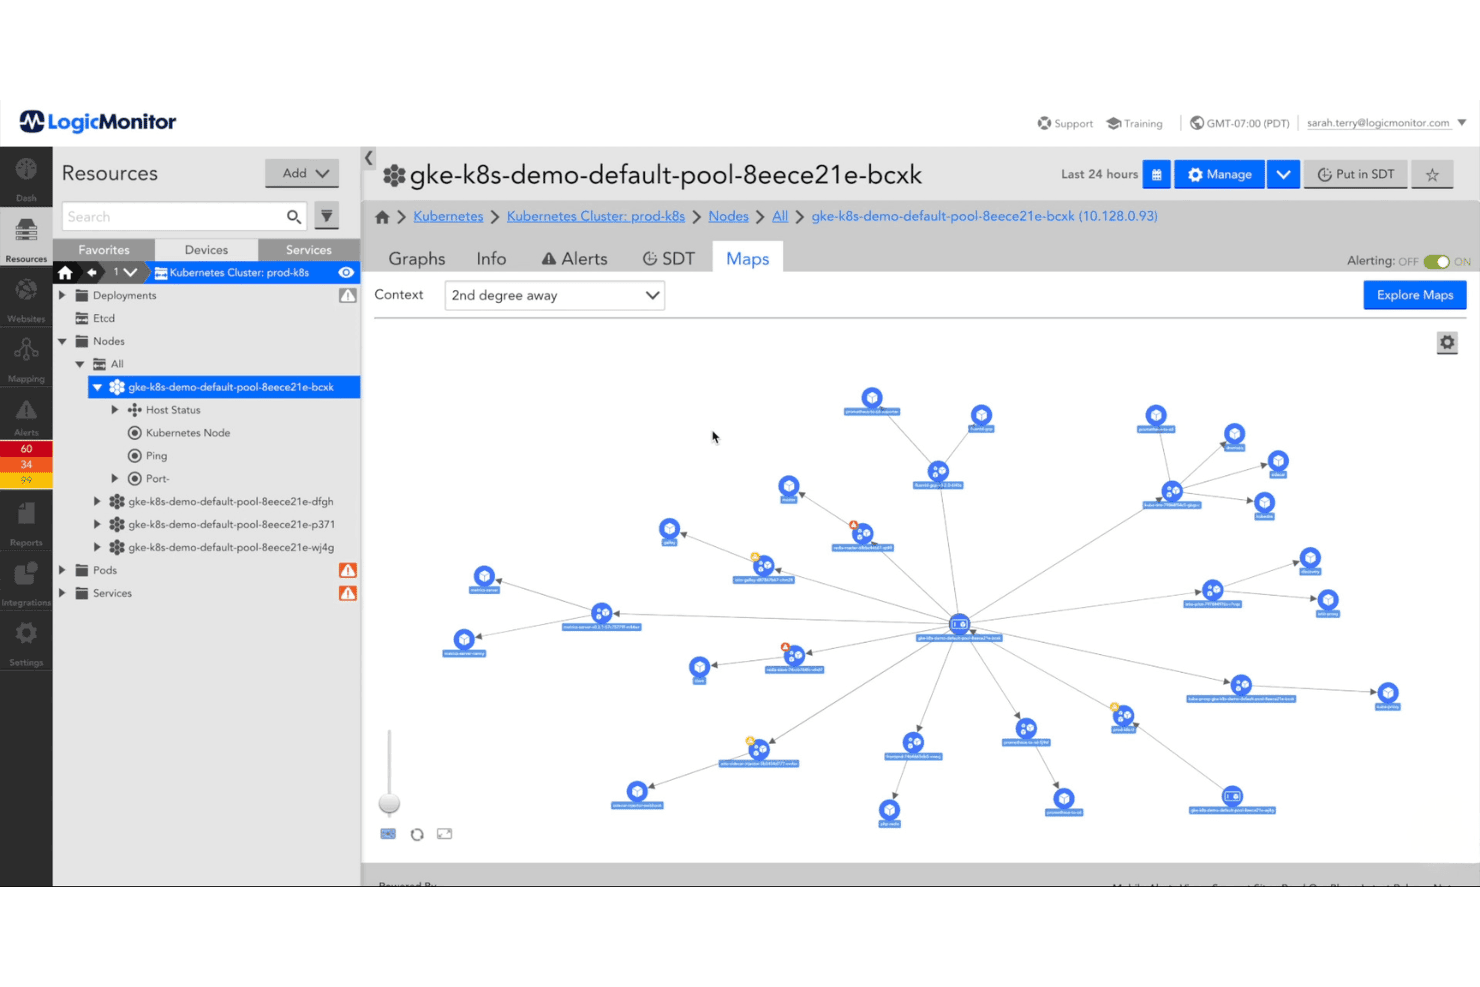
LogicMonitor maps Kubernetes node relationships with interactive network topology views. LogicMonitor is a full-stack IT operations management platform that covers infrastructure, network, cloud, container, and application monitoring alongside AIOps-driven alert correlation, topology mapping, and log analytics in a single unified platform.
Who Is LogicMonitor Best For?
LogicMonitor is a strong fit for infrastructure and network operations teams managing large, hybrid environments across on-premises and multi-cloud.
Why I Picked LogicMonitor
LogicMonitor earns its spot on my shortlist because of how tightly it connects alert correlation to topology-aware root cause analysis. Edwin AI compresses alert storms into prioritized, explainable incidents, and the ITOps Context Graph layers topology, telemetry, and change data together so you can pinpoint a probable root cause in minutes rather than hours. I've seen teams cut alert noise by 78% after deploying Edwin AI, which means on-call engineers spend less time triaging noise and more time resolving the actual issue.
LogicMonitor Key Features
- Full-stack infrastructure monitoring: Tracks servers, network devices, VMs, databases, storage, and containers across hybrid environments from a single platform.
- LM Exchange: Gives you access to over 2,000 pre-built LogicModules covering cloud providers, networking gear, databases, and applications.
- Log Analytics & Intelligence: Correlates log data with metrics in real time so you can investigate incidents without switching tools.
- Bidirectional ITSM integrations: Syncs alert and ticket lifecycles with ServiceNow, Jira Service Management, PagerDuty, ConnectWise, and Autotask.
LogicMonitor Integrations
LogicMonitor offers 2,000+ marketplace integrations through LM Exchange, plus native integrations with ServiceNow, Jira Service Management, PagerDuty, ConnectWise, and Datto Autotask. A documented REST API supports custom integrations.
Pros and Cons
Pros:
- Customizable dashboards for various IT roles
- Maps topology for fast root cause analysis
- Reduces alert noise with Edwin AI
Cons:
- Interface changes make navigation challenging
- Pricing structure is difficult to understand
Learn more about LogicMonitor: Best for transaction-level full-stack observability
- Free plan + free demo available
- Pricing upon request
Visit WebsiteCustomer Rating:4.3/5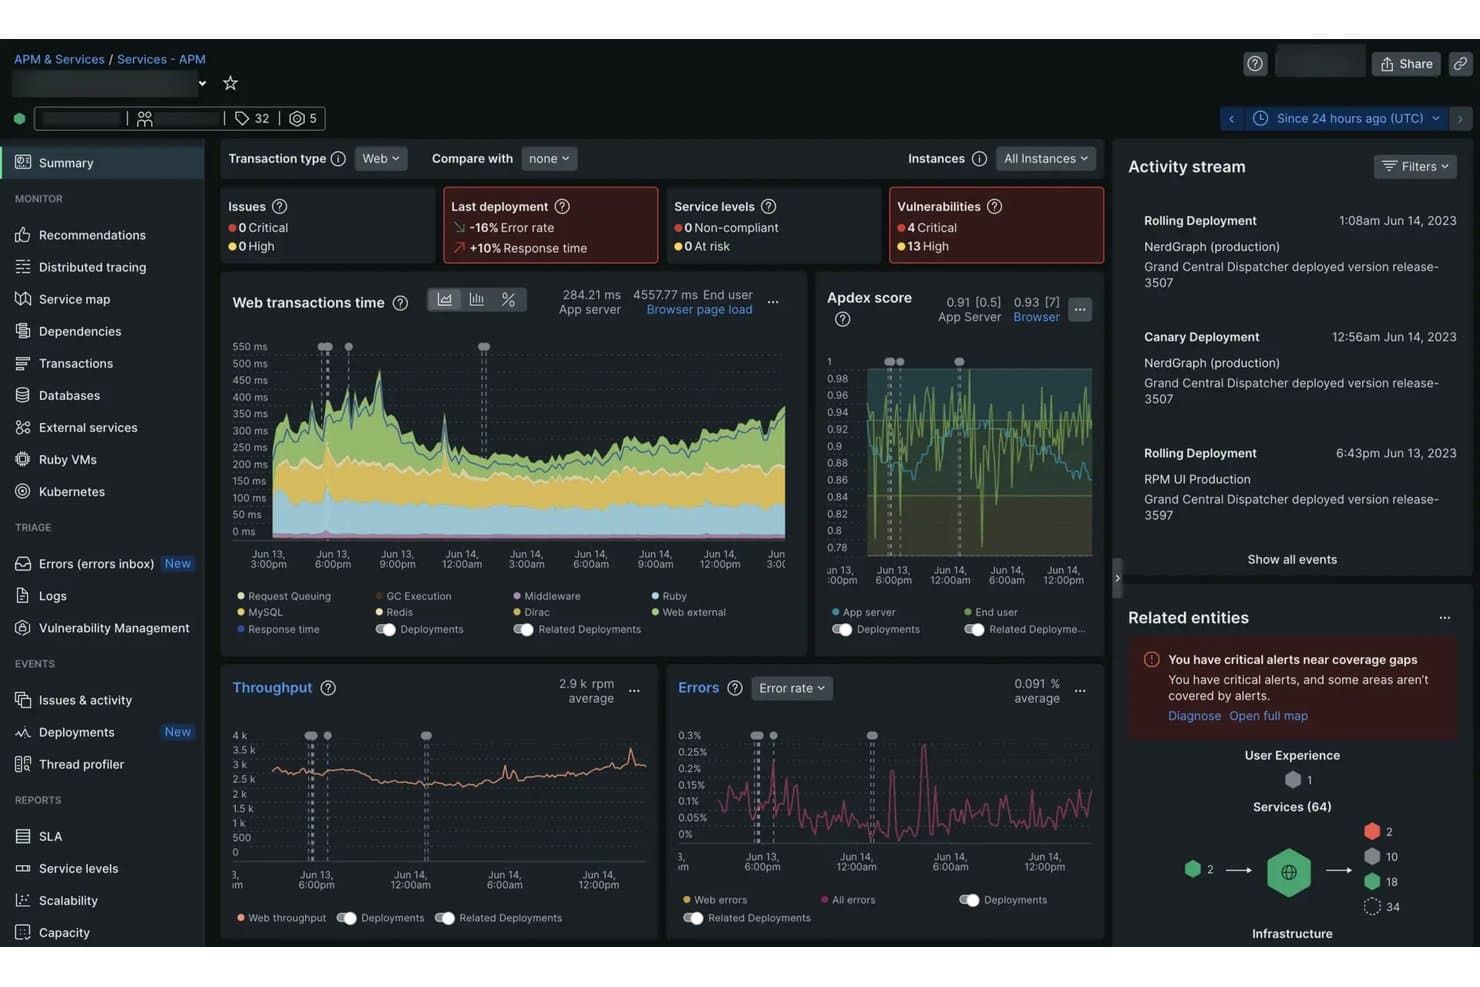
New Relic provides a full APM summary with performance metrics. New Relic is a full-stack observability platform that unifies metrics, logs, traces, and digital experience data across infrastructure, applications, cloud environments, and networks in a single interface.
Who Is New Relic Best For?
New Relic is a strong fit for SREs and infrastructure engineers managing complex, high-traffic production environments where transaction-level visibility across the full stack is non-negotiable.
Why I Picked New Relic
New Relic earns its spot on my shortlist because of Transaction 360, which correlates telemetry, alerts, and deployment changes at the individual transaction level and cuts MTTR by up to 5x. I also like how Autopilot agents autonomously investigate incidents using live telemetry and runbooks, then surface transparent, auditable reasoning rather than just firing off a remediation action. That combination of transaction-level tracing and agentic incident resolution is what makes New Relic my go-to for full-stack observability.
New Relic Key Features
- Smart Alerts: Dynamic threshold tuning uses historical volatility to minimize false positives and automatically routes alerts to the right team using entity tags.
- Cloud Cost Intelligence: Real-time cost tracking across AWS, Azure, GCP, and Kubernetes, with right-sizing recommendations tied to actual usage patterns and budget threshold alerts.
- Workflow Automation: A no-code, drag-and-drop canvas lets you build multi-step remediation workflows with conditional logic, loops, and live NRQL queries.
- Federated Logs: Query logs directly from S3 buckets without re-ingestion or data movement, supporting data residency and compliance requirements.
New Relic Integrations
New Relic offers 800+ pre-built integrations, including ServiceNow, Jira, PagerDuty, Slack, Microsoft Teams, AWS, Azure, Google Cloud Platform, Kubernetes, and VMware. NerdGraph, REST API, webhooks, OpenTelemetry, and Prometheus support custom connectivity.
Pros and Cons
Pros:
- Transparent AI-driven incident investigation
- Automates alert routing using entity tags
- Correlates metrics, logs, and traces instantly
Cons:
- Extended data retention needs paid upgrade
- Consumption-based pricing can escalate quickly
Learn more about New Relic: Best for CMDB-anchored hybrid IT ops at scale
- Free demo available
- Pricing upon request
Visit WebsiteCustomer Rating:4.4/5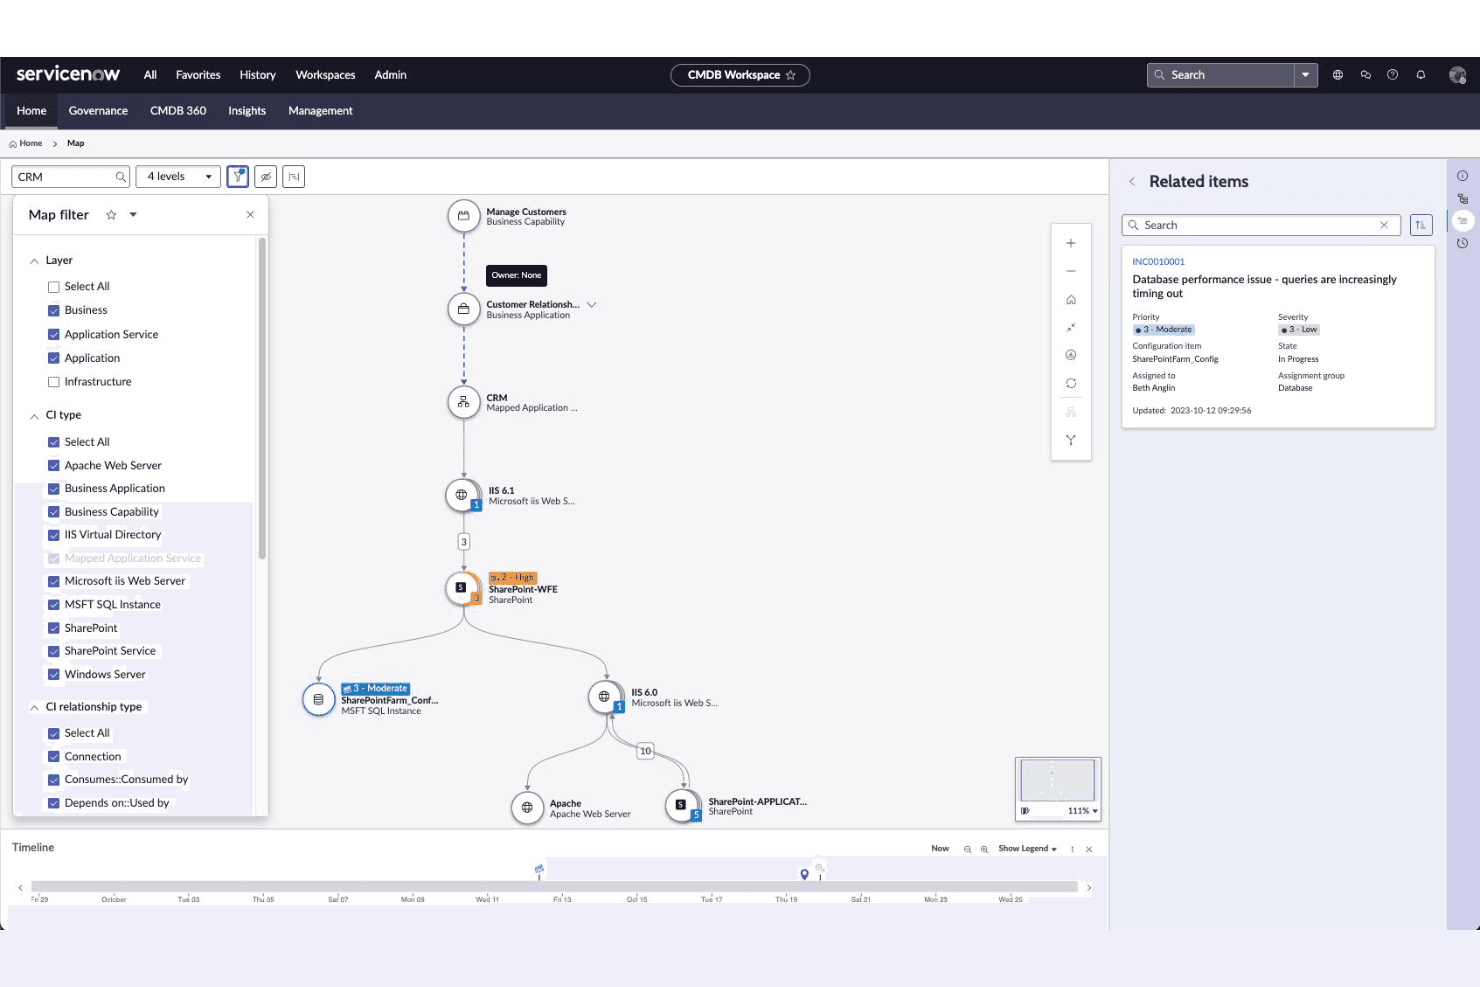
ServiceNow ITOM maps CRM app dependencies across infrastructure layers. ServiceNow ITOM is an enterprise IT operations management platform built around a continuously updated CMDB, offering agentless discovery, AIOps-powered event management, service mapping, cloud visibility, and automated orchestration across hybrid and multi-cloud environments.
Who Is ServiceNow ITOM Best For?
ServiceNow ITOM is built for large enterprises running complex hybrid IT estates where a continuously updated CMDB is the operational backbone.
Why I Picked ServiceNow ITOM
ServiceNow ITOM earns its spot on my shortlist because the CMDB isn't just a database here—it's the live operational backbone that Discovery and Service Graph Connectors continuously feed with real data from across your hybrid estate. I particularly like how Service Mapping automatically builds dependency visualizations between infrastructure and business services, so when an AWS instance degrades, you can see exactly which services are impacted before users notice. AIOps LEAP takes it further by mining closed incidents to generate and deploy automated remediation playbooks, complete with an ROI dashboard tracking what's actually been saved.
ServiceNow ITOM Key Features
- Health Log Analytics: Uses AI to analyze log data in real time, flagging anomalies and surfacing remediation recommendations before issues escalate.
- Synthetic Monitoring: Simulates end-user transactions to detect availability and performance problems before real users are affected.
- Cloud Accelerate: Automates cloud resource provisioning and deprovisioning while enforcing tagging, cost, and security policies across AWS, Azure, and GCP.
- Certificate Management: Automatically discovers and tracks TLS/PKI certificates across your environment and triggers renewal workflows before expiration.
ServiceNow ITOM Integrations
ServiceNow ITOM integrates with AWS, Microsoft Azure, Google Cloud Platform, Alibaba Cloud, Datadog, Dynatrace, Splunk, PagerDuty, Jenkins, and GitHub. REST and SOAP APIs, webhooks, and ServiceNow Store integrations support custom connectivity.
Pros and Cons
Pros:
- Multi-cloud discovery spans AWS, Azure, GCP
- GenAI automates incident triage and remediation
- CMDB drives real-time operations visibility
Cons:
- Advanced features require separate module licensing
- SaaS-only with no self-hosted option
Learn more about ServiceNow ITOM: Best for Cisco-native cross-domain service health ops
- Free demo available
- Pricing upon request
Visit WebsiteCustomer Rating:4.9/5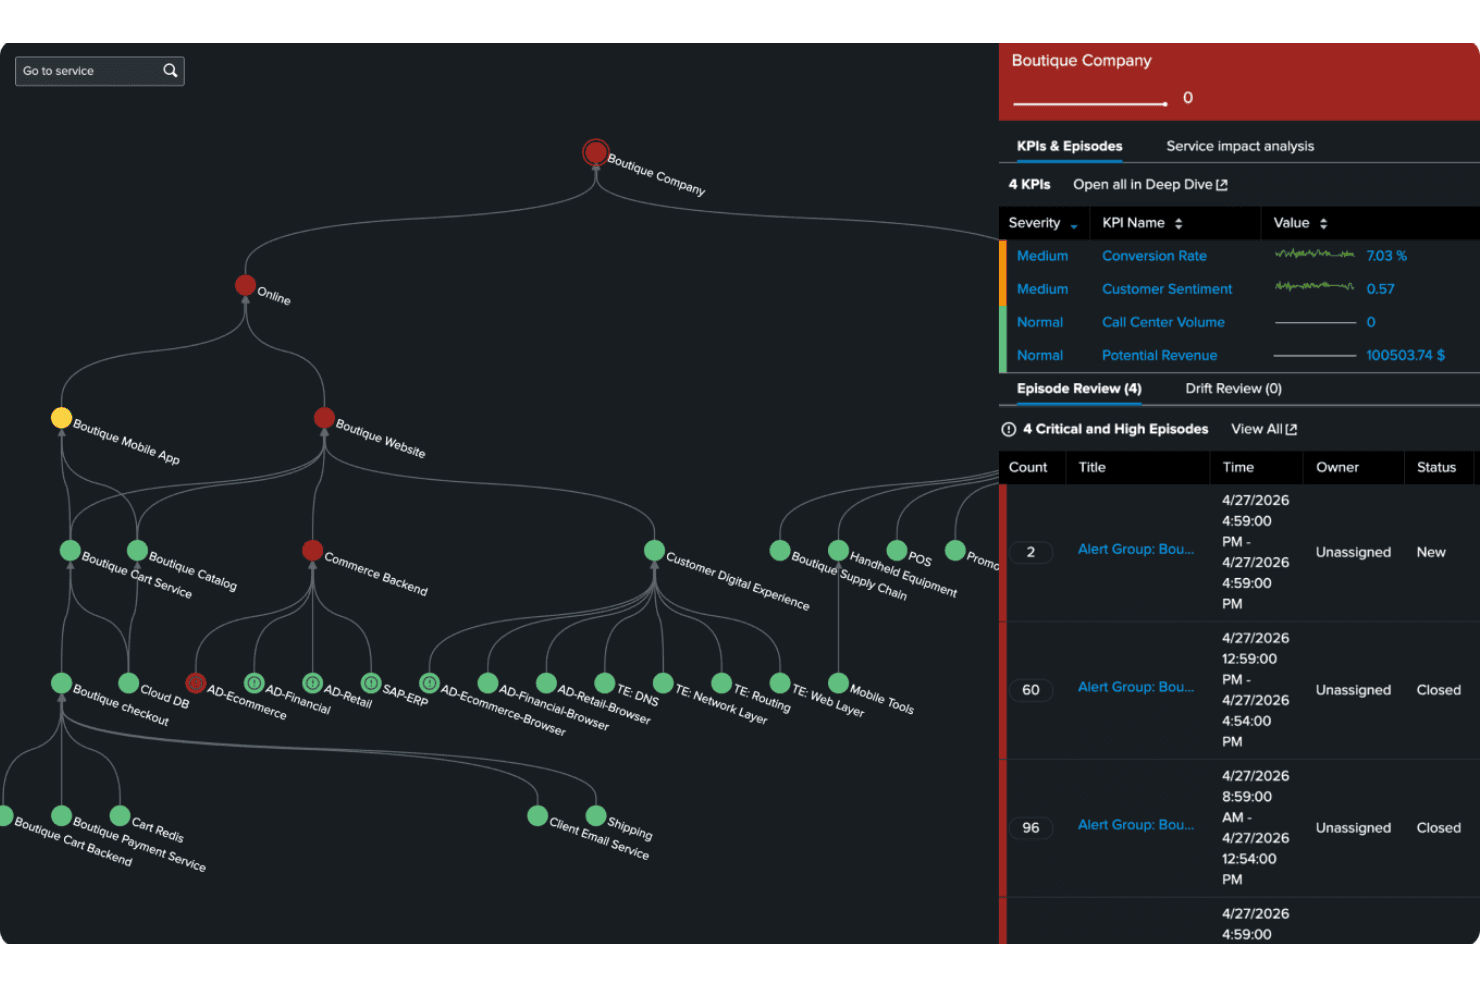
Splunk ITSI visualizes service health and episodes in a dependency map. Splunk IT Service Intelligence (ITSI) is an AIOps-driven IT operations management platform that delivers KPI-based service health scoring, AI-powered alert correlation, topology mapping, and cross-domain visibility across infrastructure, applications, and networks.
Who Is Splunk IT Service Intelligence Best For?
Splunk ITSI is a strong fit for enterprise IT operations teams—particularly those already running Splunk or operating within Cisco environments—who need to correlate service health across infrastructure, applications, and networks at scale.
Why I Picked Splunk IT Service Intelligence
Splunk ITSI earns its spot on my shortlist because of how it handles cross-domain service health in Cisco-native environments. I love that it pulls signals from Cisco ThousandEyes, Meraki, and Catalyst Center directly into its KPI-based health scoring model, so network-to-application visibility isn't stitched together manually. Its Event iQ engine then correlates those signals into consolidated episodes, cutting through alert noise before your team wastes time on duplicates.
Splunk IT Service Intelligence Key Features
- Glass Tables: Build pixel-perfect, drag-and-drop dashboards that map live service health scores to business KPIs like SLA attainment or revenue impact.
- Adaptive thresholding: ML models baseline each KPI's normal behavior over time, triggering alerts on statistical deviations rather than fixed thresholds.
- Episode Review workspace: A centralized triage interface where AI-correlated alert groups surface with severity scoring, impacted service context, and recommended next steps.
- Service dependency modeling: Define and visualize hierarchical relationships between business services, sub-services, hosts, and network devices to isolate root causes faster.
Splunk IT Service Intelligence Integrations
Splunk IT Service Intelligence integrates with ServiceNow, PagerDuty, Jira Cloud, Cisco ThousandEyes, Cisco Catalyst Center, Cisco Meraki, Splunk Observability Cloud, AppDynamics, and Red Hat Ansible Automation Platform. It also offers Splunkbase marketplace integrations, REST API access, Python SDKs, webhooks, and Kafka.
Pros and Cons
Pros:
- Highly customizable dashboards for business metrics
- Unified cross-domain monitoring for Cisco environments
- Advanced AI-driven alert correlation and triage
Cons:
- Implementation complexity for service and entity modeling
- High resource requirements for large deployments
Learn more about Splunk IT Service Intelligence: Best for agentic AI across mainframe-to-cloud ops
- Free demo available
- Pricing upon request
Visit WebsiteCustomer Rating:4/5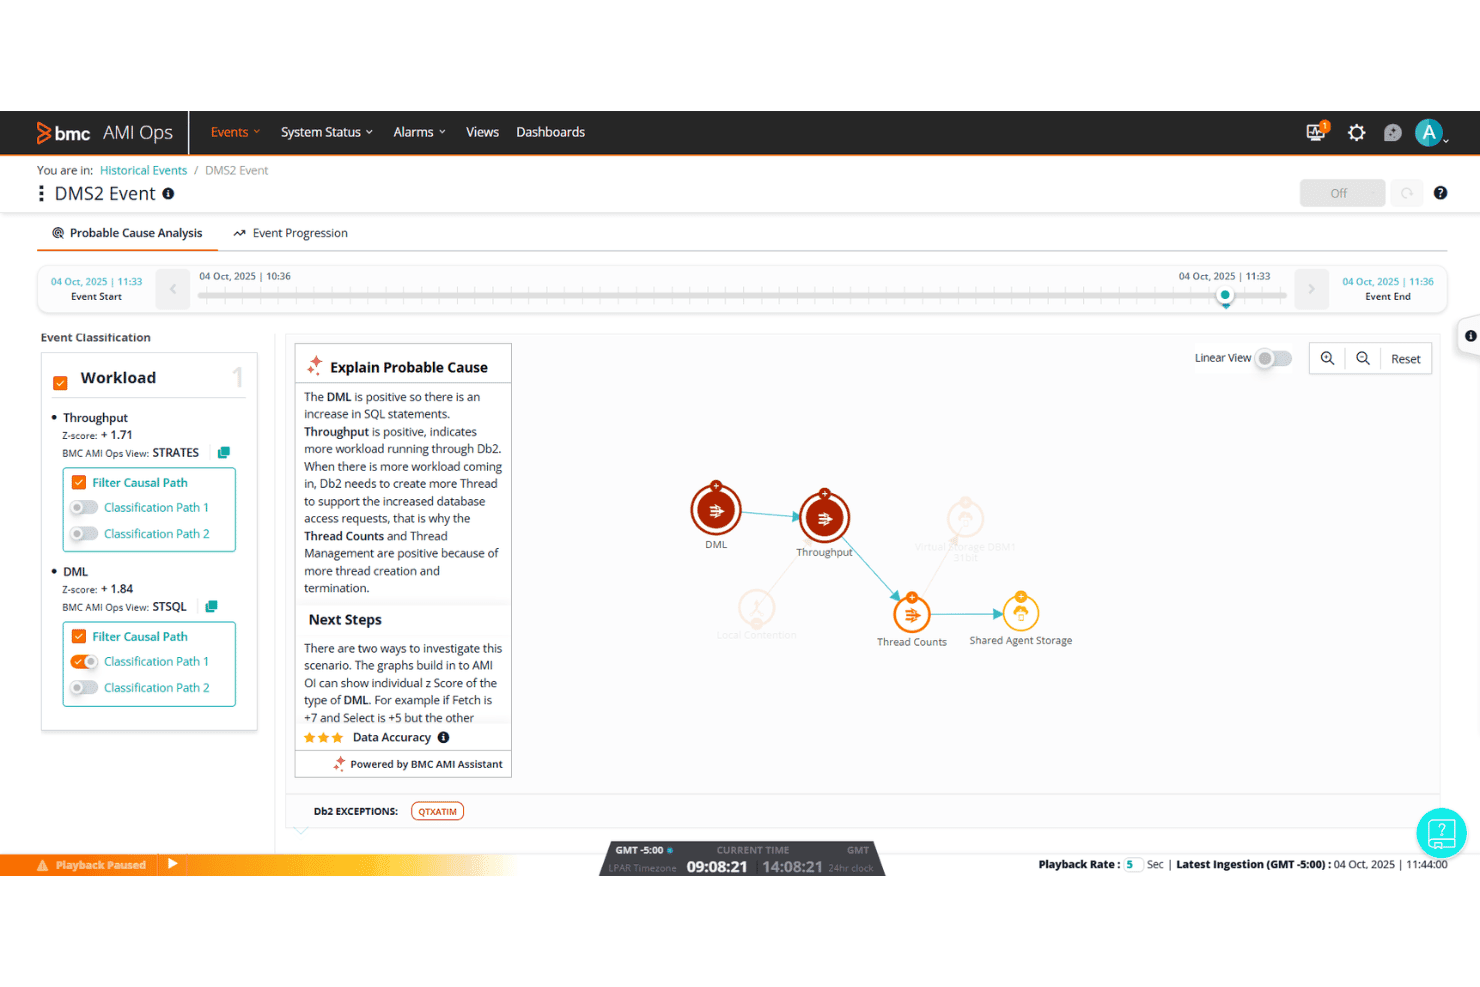
BMC Helix AIOps explains probable causes with AI-driven event analysis. BMC Helix AIOps is a cloud-native IT operations management platform that unifies event monitoring, AI-driven incident correlation, automated remediation, and topology mapping across on-premises, cloud, and mainframe environments.
Who Is BMC Helix AIOps Best For?
BMC Helix AIOps is built for large enterprises running complex hybrid environments that span mainframe systems, on-premises infrastructure, and multiple public clouds.
Why I Picked BMC Helix AIOps
BMC Helix AIOps earns its spot on my shortlist because it's one of the only platforms I've seen that genuinely spans mainframe-to-cloud without treating either end as an afterthought. I rely on HelixGPT's agentic AI capabilities, specifically the Agent Builder and Ops Swarmer, to handle autonomous incident triage across z/OS environments and Kubernetes clusters in the same workflow. The AI-driven situation correlation cuts alert noise by up to 90%, which in practice means my team isn't drowning in duplicate alerts across 600 dashboards.
BMC Helix AIOps Key Features
- Probable cause analysis: AI correlates topology and event data to identify the most likely root cause of a situation before manual investigation begins.
- HelixGPT Post Mortem Analyzer: Automatically generates detailed post-incident review summaries to support SRE and ops teams after resolution.
- Dynamic service blueprinting: Integrates with BMC Helix Discovery to auto-generate and continuously update service models that map dependencies across your hybrid environment.
- Role-based dashboard views: Segments operational data and reporting by role, giving each team member a filtered view of the metrics and events relevant to their function.
BMC Helix AIOps Integrations
BMC Helix AIOps integrates with BMC Helix ITSM, ServiceNow, AWS, Azure, Google Cloud Platform, Microsoft Teams, Slack, BMC Helix Discovery, and Jitterbit. It also supports REST APIs, CMDB connectivity, third-party monitoring tools, and AWS Marketplace deployment.
Pros and Cons
Pros:
- Automated topology and dependency mapping included
- AI-driven alert noise reduction up to 90%
- Native mainframe and hybrid cloud monitoring
Cons:
- Dashboard customization less intuitive than competitors
- Configuration requires significant technical expertise
Learn more about BMC Helix AIOps:
Other IT Operations Management Software
Here are some additional IT operations management software options that didn’t make it onto my shortlist, but are still worth checking out:
- 11DatadogBest for unified telemetry with FinOps built in
- 12ManageEngine OpManagerBest for no-code fault-to-fix workflow automation
- 13BigPandaBest for AI-driven change risk scoring
- 14PagerDutyBest for on-call incident response at scale
- 15ZabbixBest for open-source ops monitoring at any scale
- 16MoogsoftBest for ML-driven alert noise reduction
- 17CheckmkBest for service-based pricing across hybrid infra
- 18Ivanti NeuronsBest for ITSM-anchored IT and SecOps automation
- 19Grafana CloudBest for ML-guided full-stack ops observability
- 20SolarWinds Observability SaaSBest for NetOps-rooted full-stack observability
How I Evaluate IT Operations Management Software
When an alert storm hits at 2 a.m. and your team needs to trace a degraded API back to a misconfigured container in a hybrid cluster, the tools either hold up or they don't—so I split my evaluation into baseline functionality every platform must cover and the differentiators that separate good from great.
Core Functionality (Table Stakes For This List)
When I'm selecting tools for my list, I rank each one on a scale from 0 (does not offer the functionality) to 5 (excels in this area) for each core functionality listed below. I then calculate the tool's total score into a percentage, using 75% as a benchmark to help assess its overall fit for the list.
- Infrastructure & App Monitoring: I check whether the platform covers servers, networks, apps, and cloud resources with real-time metrics, logs, and traces.
- Alerting & Incident Management: Each tool's alert correlation, escalation policies, and incident workflows matter—especially how well it cuts through noise during an outage.
- IT Automation & Orchestration: I look for visual workflow builders, auto-remediation playbooks, and cross-platform runbooks that reduce manual toil on recurring tasks.
- Hybrid & Multi-Cloud Visibility: Unified dashboards across on-prem, AWS, Azure, and GCP are table stakes—I evaluate topology mapping and dynamic discovery depth.
- Reporting & Analytics Dashboards: Customizable dashboards with drill-downs, SLA/SLO tracking, and capacity forecasting tell me how well a tool supports planning conversations.
- Integrations & API Access: I evaluate prebuilt connectors to ITSM, DevOps, and chatops tools, plus REST API coverage for teams that need to build custom workflows.
Once I have a list of tools that meet the criteria, I consider what sets each platform apart.
Differentiating Factors (What Sets Vendors Apart)
Here's how I compare and contrast different vendors:
Standout Features
I evaluate how well each platform's AIOps engine baselines normal behavior and correlates related events into a single incident—during a noisy outage, the difference between 200 alerts and one actionable incident is hours of recovery time. Topology and dependency mapping matters just as much: I check whether the tool auto-discovers relationships across containers, hosts, and network paths so you can trace a failing checkout API back to an undersized pod without switching screens. I also look at built-in cloud cost visibility, since platforms like Datadog and Dynatrace now tie resource utilization directly to spend, helping you spot idle workloads before finance does.
Beyond Features
I evaluate total cost of ownership closely because ingestion-based pricing can spiral fast—adding custom metrics or doubling log volume in platforms like Datadog or New Relic often triggers surprise overages that dwarf the original quote. Deployment flexibility matters just as much; I check whether a vendor offers SaaS, self-hosted, and air-gapped options, since regulated industries frequently need on-prem control that pure-SaaS tools can't deliver. I also look at ecosystem depth, specifically bidirectional ITSM integrations and open API coverage, so operations data flows into existing DevOps and ChatOps workflows without custom glue code.
How to Choose IT Operations Management Software
When deciding which IT operations management software best fits your environment, start by focusing on your most pressing operational challenges:
| If your priority is... | Look for... |
|---|---|
| If your priority is...Fast, accurate root cause analysis | Look for...AI-based incident correlation and automated runbooks |
| If your priority is...Hybrid and multi-cloud environments | Look for...Native connectors for on-premise, AWS, Azure, and GCP |
| If your priority is...Reducing manual remediation tasks | Look for...Visual workflow builders with prebuilt automation |
| If your priority is...Controlling monitoring-related spend | Look for...Transparent, usage-based pricing and cost dashboards |
| If your priority is...Deep integrations with ITSM tools | Look for...Prebuilt connectors and open API documentation |
How to Vet Your Shortlist
- Test incident triage workflows: Run a 48-hour trial and simulate at least three types of outages to verify incident grouping and automated responses.
- Request a topology map demo: Ask the vendor to generate an end-to-end dependency map—including hybrid clusters—using live or redacted sample data.
- File a cross-platform ticket: Open a support ticket referencing a multi-cloud integration and document response accuracy and SLAs over a 3-day period.
- Evaluate reporting completeness: Review or export a sample analytics dashboard and confirm visibility into cost, SLA, and custom metrics for your actual stack.
- SaaS agility vs. self-host control: Decide whether rapid feature delivery in SaaS outweighs compliance and access needs met by on-prem or air-gapped deployments.
What Is IT Operations Management Software?
IT operations management software is a category of tools designed to monitor, automate, and manage IT infrastructure, applications, networks, and services across on-premises and cloud environments. These platforms help your team centralize alerts, maintain system health, manage incidents, and optimize resource usage. By consolidating operations data and automation, IT operations management software supports faster troubleshooting, drives efficiency, and enables your organization to scale technology reliably.
Features of IT Operations Management Software
When selecting IT operations management software, keep an eye out for the following key features:
- Infrastructure and application monitoring: Tracks servers, networks, containers, and applications in real time. Helps you spot abnormal system behavior, degraded performance, or outages before users are affected.
- Alerting and incident management: Centralizes alerts and streamlines escalation workflows. Enables your team to respond quickly, contextualize incidents, and track resolution from start to finish.
- Automation and orchestration: Provides tools to automate routine tasks and coordinate workflows across different environments. Reduces manual effort and mitigates human error during deployments or maintenance.
- Hybrid and multi-cloud support: Offers unified visibility across on-premise, private cloud, and public cloud infrastructure. Helps you manage complex environments as a single operational entity.
- Customizable dashboards and reporting: Lets you build dashboards and reports tailored to your needs. Supports trend analysis, SLA monitoring, and sharing insights with technical and business stakeholders.
- Integration and API access: Connects with ITSM, DevOps, and collaboration platforms. Enables your team to embed IT operations data directly into ticketing, chat, and other systems.
- Topology and dependency mapping: Visualizes the relationships between systems, services, and infrastructure components. Makes it easier to trace the root cause of incidents and understand operational risk.
- User and role-based access control: Allows you to define who can view or edit parts of your environment. Protects sensitive data and limits exposure based on user responsibilities.
- Capacity planning and forecasting: Analyzes trends in resource consumption to predict future needs. Helps you anticipate infrastructure upgrades and budget for growth.
- Change tracking and audit logs: Records configuration changes and user actions. Supports compliance requirements and helps troubleshoot past incidents by providing a clear change history.
Common IT Operations Management Software AI Features
Beyond the standard IT operations management software features listed above, many of these solutions are incorporating AI with features like:
- AI-driven anomaly detection: Uses machine learning to automatically identify unusual patterns or behaviors in system metrics, logs, or network traffic. This helps your team catch emerging issues before they escalate, even when thresholds haven’t been set manually.
- Automated root cause analysis: Applies AI algorithms to correlate events, logs, and performance data across your stack. This feature pinpoints the likely source of incidents, reducing the time your team spends investigating and accelerating recovery.
- Predictive incident forecasting: Leverages historical data and AI models to anticipate potential outages or performance degradations. This allows you to take proactive steps to prevent incidents and plan maintenance more effectively.
- Intelligent alert noise reduction: Uses AI to group related alerts, suppress duplicates, and prioritize notifications based on impact and context. This cuts down on alert fatigue and ensures your team focuses on the most important issues.
- AI-powered remediation suggestions: Analyzes incident data and past resolutions to recommend next steps or automated fixes. This helps your team respond faster and standardizes best practices across your operations.
Benefits of IT Operations Management Software
Implementing IT operations management software provides several benefits for your team and your business. Here are a few you can look forward to:
- Centralized visibility: Unify monitoring of servers, networks, applications, and cloud resources through a single dashboard, so your team stays ahead of issues across environments.
- Faster incident resolution: Use alert aggregation, AI-driven correlation, and automated root cause analysis features to quickly identify, prioritize, and respond to operational problems.
- Reduced manual effort: Automate recurring maintenance, remediation, and workflow tasks using prebuilt automation and orchestration tools, freeing up time for higher-value initiatives.
- Proactive risk management: Predict outages and resource bottlenecks with AI-powered anomaly detection and forecasting tools that surface potential problems before they escalate.
- Cost and resource optimization: Track infrastructure usage, application performance, and resource spend through reporting and analytics features, helping you manage budgets and capacity planning.
- Stronger security and compliance: Rely on user access controls, audit logs, and change tracking capabilities to keep sensitive data protected and support regulatory requirements.
- Seamless ecosystem integration: Connect ITSM, DevOps, and chat platforms using prebuilt integrations and open APIs, making it easier to embed operations data into the way your team already works.
Costs and Pricing of IT Operations Management Software
Selecting IT operations management software requires an understanding of the various pricing models and plans available. Costs vary based on features, team size, add-ons, and more. The table below summarizes common plans, their average prices, and typical features included in IT operations management software solutions:
Plan Comparison Table for IT Operations Management Software
| Plan Type | Average Price | Common Features |
|---|---|---|
| Plan TypeFree Plan | Average Price$0 | Common FeaturesBasic infrastructure monitoring, limited alerting, access for small teams, and community support. |
| Plan TypePersonal Plan | Average Price$10–$30/user/month | Common FeaturesReal-time monitoring, entry-level automation, basic dashboards, integration with popular tools, and email support. |
| Plan TypeBusiness Plan | Average Price$40–$80/user/month | Common FeaturesFull-stack monitoring, alerting and incident management, workflow automation, advanced dashboards, API access, and role-based access control. |
| Plan TypeEnterprise Plan | Average Price$90–$200/user/month | Common FeaturesHybrid and multi-cloud visibility, AI-powered features, custom SLAs, compliance support, dedicated integrations, and premium support. |
IT Operations Management Software FAQs
Here are some answers to common questions about IT operations management software:
How do you compare different IT operations management software platforms?
Start by listing your must-have features—like multi-cloud support, automation, and integration depth. Then, trial the platforms using common incident scenarios, and compare how each tool handles alerting, root cause analysis, and reporting. Total cost of ownership, ecosystem integrations, and deployment flexibility are also important to examine before making a final call.
Can IT operations management software automate incident response?
Yes, most modern IT operations management software lets you automate incident response through runbooks, workflow builders, and even AI-driven auto-remediation. This helps you cut down on manual steps and ensures a consistent response to recurring issues.
What integrations should I look for in IT operations management software?
Look for API access, prebuilt connectors to ITSM tools (like ServiceNow), chat platforms (like Slack or Microsoft Teams), and DevOps pipelines. Deep integrations let your team push alerts, trigger workflows, and sync tickets across your existing systems without custom middleware.
Does IT operations management software help with compliance and auditing?
Yes, strong IT operations management software tracks system changes, user actions, and provides audit logs needed for compliance. This is especially useful in regulated sectors where you need clear evidence of controls and a full change history for reporting.
How can I prevent unexpected costs with IT operations management software?
Always review how the platform bills for data ingestion, custom metrics, and user seats. Choose tools with transparent, usage-based pricing and in-app cost dashboards, so you can monitor spend and avoid surprise overages as your environment grows.
What’s the best way to get buy-in from stakeholders for a new IT operations management platform?
Show how the platform helps achieve business goals: faster incident resolution, proactive risk management, and improved reporting. Share a demo or pilot results, highlight expected efficiencies, and connect features to pain points your stakeholders recognize.