

Como alguém que tem explorado o vasto universo das aplicações, do SaaS e das ferramentas de monitorização de redes, compreendo a sua necessidade de alternativas eficientes e fiáveis ao Sumo Logic. O Sumo Logic é uma ferramenta de visualização de dados de topo que transforma dados de monitorização da nuvem em gráficos esclarecedores. Os benefícios são claros: simplifica a análise e a retenção de dados, oferecendo soluções na nuvem e no local. No entanto, o verdadeiro fator diferenciador é a sua vasta variedade de plug-ins, que lhe confere versatilidade para responder a necessidades diversas.
Os problemas que resolve centram-se na simplificação de processos complexos de gestão de dados. Poupa-lhe o incómodo de analisar grandes quantidades de dados de rede e ajuda a identificar as anomalias que requerem a sua atenção. Com as melhores alternativas ao seu alcance, pode escolher facilmente uma solução que corresponda às suas necessidades. Avance, explore estas opções e encontre a ferramenta mais adequada para si.
O que é o Sumo Logic?
O Sumo Logic é uma plataforma de observabilidade e gestão de registos baseada na nuvem que ajuda a recolher, analisar e visualizar dados de aplicações e infraestruturas. É utilizada por equipas de DevOps, analistas de segurança e programadores que precisam de monitorizar o estado dos sistemas, detetar problemas e investigar incidentes. As ferramentas de análise de registos, os painéis em tempo real e a deteção de ameaças ajudam a identificar erros, acompanhar o desempenho e responder a riscos. De modo geral, o Sumo Logic ajuda a sua equipa a compreender os dados dos sistemas e a agir mais rapidamente quando algo corre mal.
Why Trust Our Software Recommendations
6,700+
Reviews
20
Industry experts
16+
Evaluation factors
14
Years
Our team has been testing and reviewing software since 2012. As tech leaders ourselves, we know how difficult—and important—it is to choose the right software.
For this guide, we evaluated tools using hands-on testing and independent research, scoring tools using our selection criteria.
Our reviews reflect our human editorial judgment, not a sales pitch.
Expert reviewers:
- Paulo Gardini MiguelTech Director
 Tim FisherVP of AI
 Gabriel RosasTech Lead & Software Architect
 Christhian GruhnTech Lead & Platform Architect

Tabela de comparação das alternativas ao Sumo Logic
Esta tabela de comparação resume os detalhes de preços das minhas principais escolhas de alternativas ao Sumo Logic:
| Tool | Best For | Trial Info | Price | ||
|---|---|---|---|---|---|
| 1 | Best for distributed tracing | Free plan + 14-day trial + free demo available | From $26/month (billed annually) | Website | |
| 2 | Best for network traffic monitoring | Free plan + 30-day trial + demo available | From $10/month | Website | |
| 3 | Best for developers linking logs to code-level traces | Free demo available | Pricing upon request | Website | |
| 4 | Best for AI-driven observability across full-stack ops | 15-day free trial | From $7/month | Website | |
| 5 | Best for unifying logs, metrics, and traces in one view | Free plan available | From $15/month (billed annually) | Website | |
| 6 | Best for hybrid IT infrastructure monitoring at scale | 15-day free trial + free demo available | From $19/month | Website | |
| 7 | Best for self-managed log search at terabyte scale | 60-day free trial | Pricing upon request | Website | |
| 8 | Best for linking app performance to business impact | 30-day free trial | From $6/vCPU/month (billed annually) | Website | |
| 9 | Best for full-stack observability with built-in AI | Free plan available | From $10/user/month | Website | |
| 10 | Best for modern engineers needing robust log management | Free plan available | From $29/user/month (billed annually) | Website |


Avaliações das melhores alternativas ao Sumo Logic
Abaixo encontram-se os meus resumos detalhados das melhores alternativas ao Sumo Logic que entraram na minha lista restrita. As minhas avaliações analisam detalhadamente as principais funcionalidades, vantagens & desvantagens, integrações e casos de utilização ideais de cada ferramenta, para o ajudar a encontrar a melhor opção para si.
 Best for distributed tracing
- Free plan + 14-day trial + free demo available
- From $26/month (billed annually)
Visit WebsiteCustomer Rating:4.5/5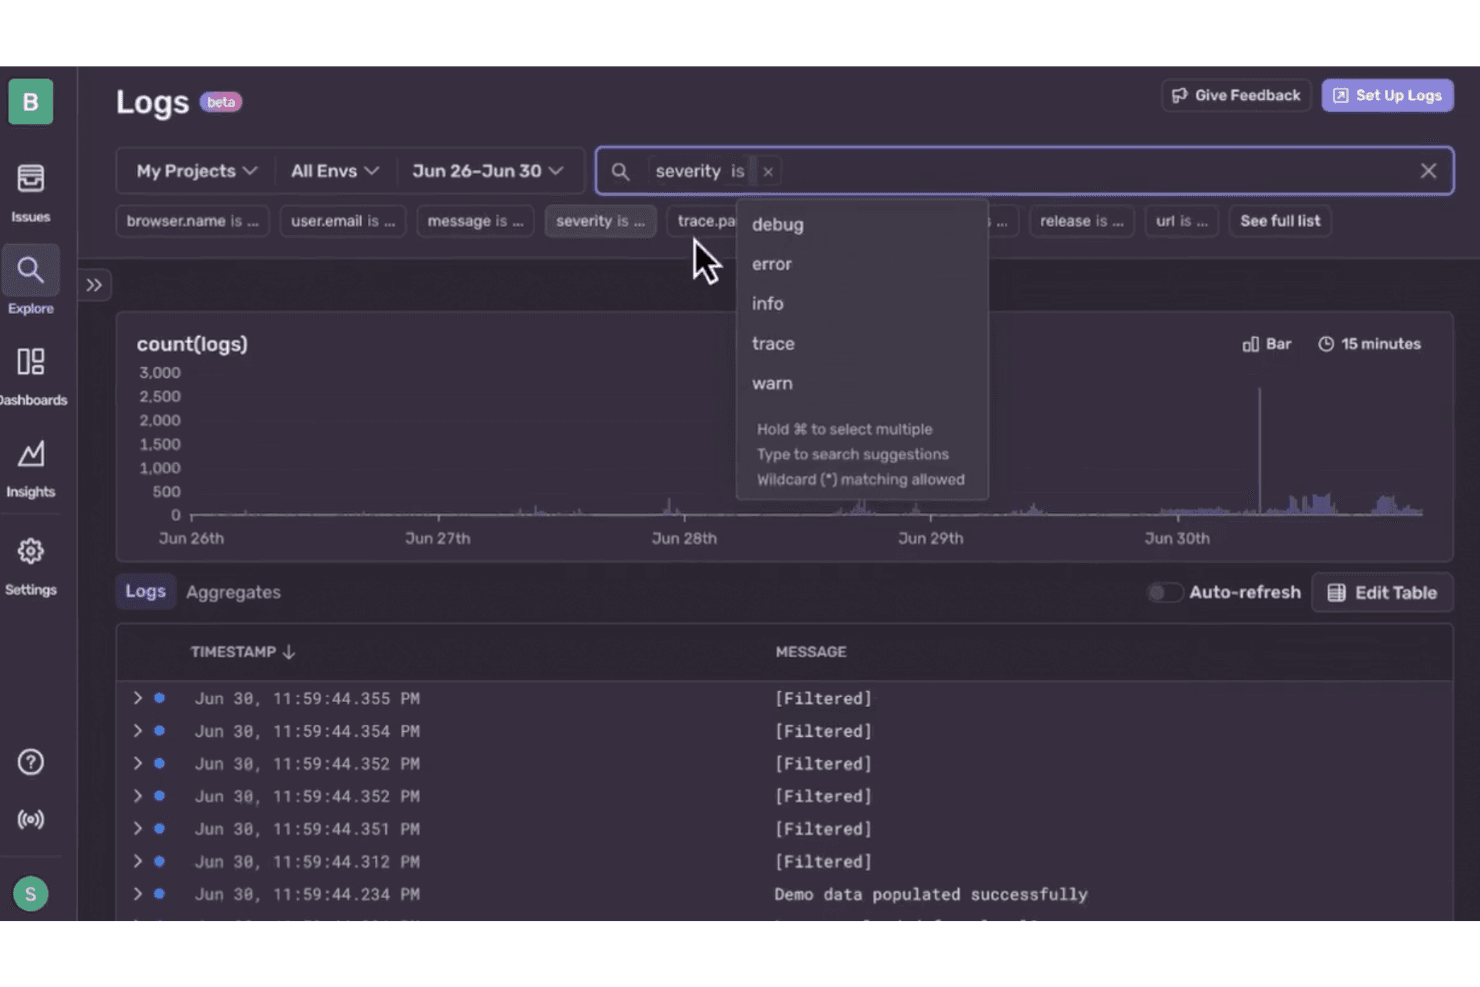
Sentry lets users filter logs by severity level for targeted debugging. Sentry is an application monitoring platform for software and IT teams that connects errors, logs, and performance data to help pinpoint causes of outages and user-facing issues.
Who Is Sentry Best For?
Sentry suits software engineering and DevOps teams that need to trace requests across distributed services and find where latency or failures begin.
Why I Picked Sentry
When a request crosses several services, I want to see where it slows down or fails. I picked Sentry as a Best for distributed tracing option because its Trace View connects errors with spans across services, helping me pinpoint a slow database call or failing dependency. That context helps when investigating application issues beyond log search alone.
Sentry Key Features
- Log search and filters: Query structured logs by message, severity, and custom attributes.
- Livestream logs: Watch incoming log events in a live view.
- Log-based alerts: Set alerts for log patterns or anomalies.
- Log dashboards: Add charts from log queries to dashboards.
Sentry Integrations
Sentry offers integrations with GitHub, GitLab, Bitbucket, Jira, Azure DevOps, Slack, Microsoft Teams, PagerDuty, Discord, and Opsgenie. Its integration platform, webhooks, and REST API support custom integrations.
Pros and Cons
Pros:
- Release context helps pinpoint regressions
- Stack traces include breadcrumbs and user context
- Cross-service traces connect errors with spans
Cons:
- Event quotas can interrupt trace visibility
- Application focus leaves infrastructure monitoring elsewhere
Learn more about Sentry: Best for network traffic monitoring
- Free plan + 30-day trial + demo available
- From $10/month
Visit WebsiteCustomer Rating:4.7/5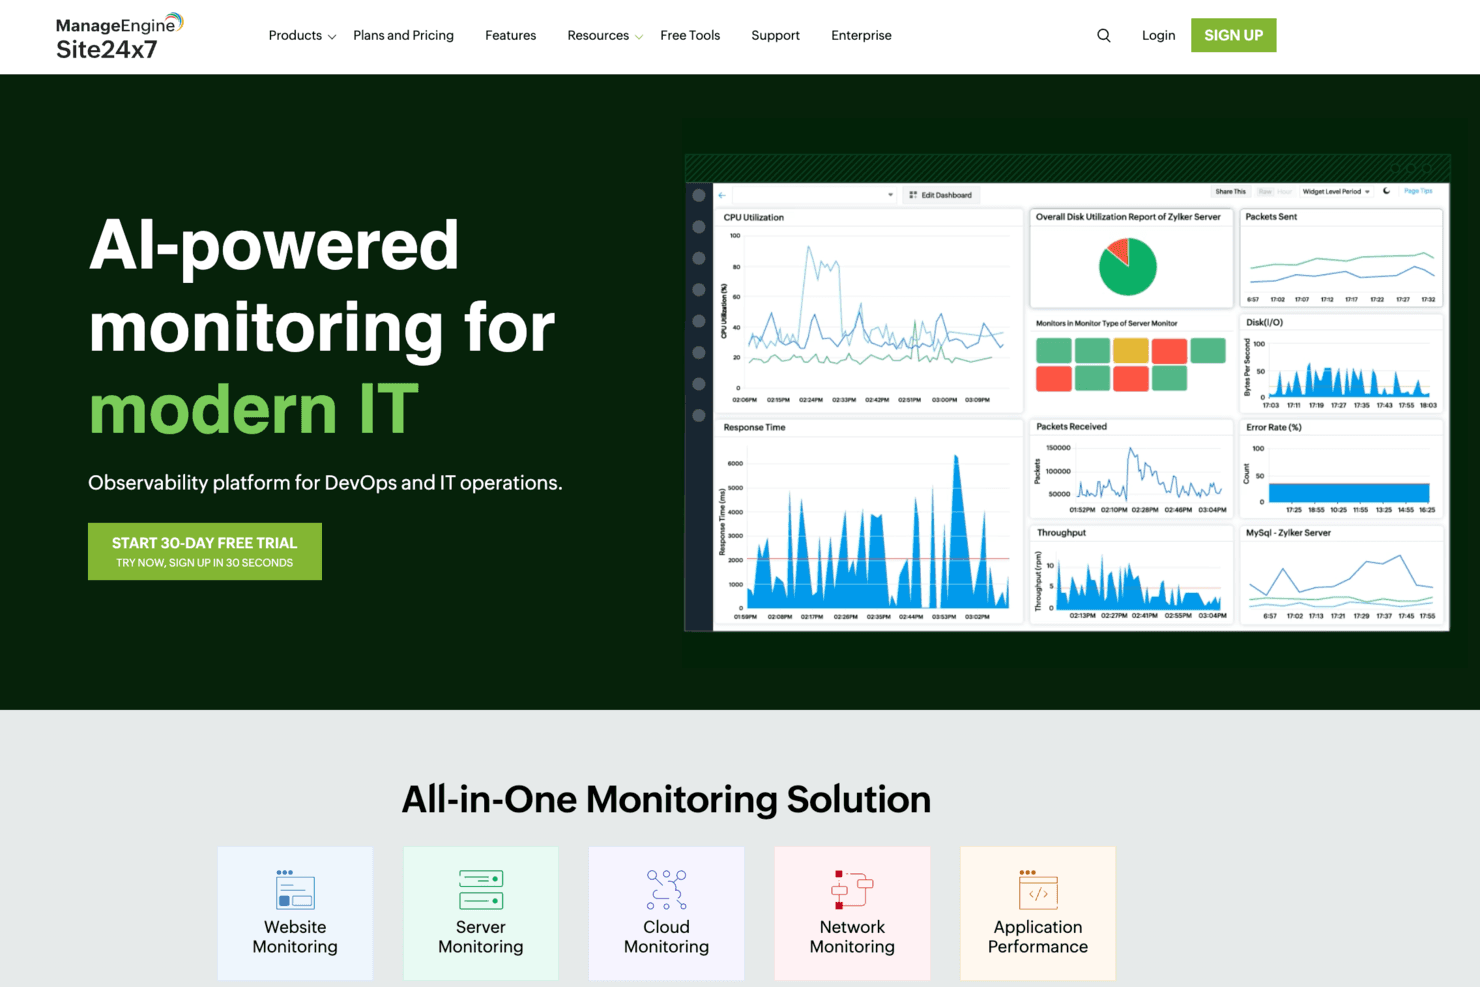
Site24x7 provides AI-powered monitoring dashboards for DevOps and IT teams. Site24x7 combines log management with cloud-based IT monitoring, helping infrastructure teams investigate issues across servers, applications, and services.
Who Is Site24x7 Best For?
Network administrators overseeing distributed or hybrid environments can monitor traffic patterns and identify network performance issues with Site24x7.
Why I Picked Site24x7
I picked Site24x7 for the “Best for network traffic monitoring” use case because it pairs log management with network visibility. NetFlow analysis breaks traffic down by device, interface, application, and conversation, so I can investigate which host or service drove a bandwidth spike.
Site24x7 Key Features
- Log collection: Collects server, application, and cloud logs through its agent, API, Fluentd, or Logstash.
- Log type support: Monitors more than 100 log types, including syslog, Windows event, and Kubernetes audit logs.
- Log-based alerts: Sets thresholds on log data and notifies predefined user groups.
- Log tagging: Applies predefined or custom rules to categorize logs and create alerts.
Site24x7 Integrations
Site24x7 documents integrations with ServiceNow, PagerDuty, Jira Service Management, Slack, Microsoft Teams, Opsgenie, Zendesk, and Zapier. It also provides a REST API for custom integrations.
Pros and Cons
Pros:
- Reviewers praise centralized dashboards and proactive alerts
- Unifies network and log incident context
- NetFlow pinpoints bandwidth-heavy applications and conversations
Cons:
- Alert noise and metric delays need tuning
- Flow analysis requires an on-premises poller
Learn more about Site24x7: Best for developers linking logs to code-level traces
- Free demo available
- Pricing upon request
Visit WebsiteCustomer Rating:4.7/5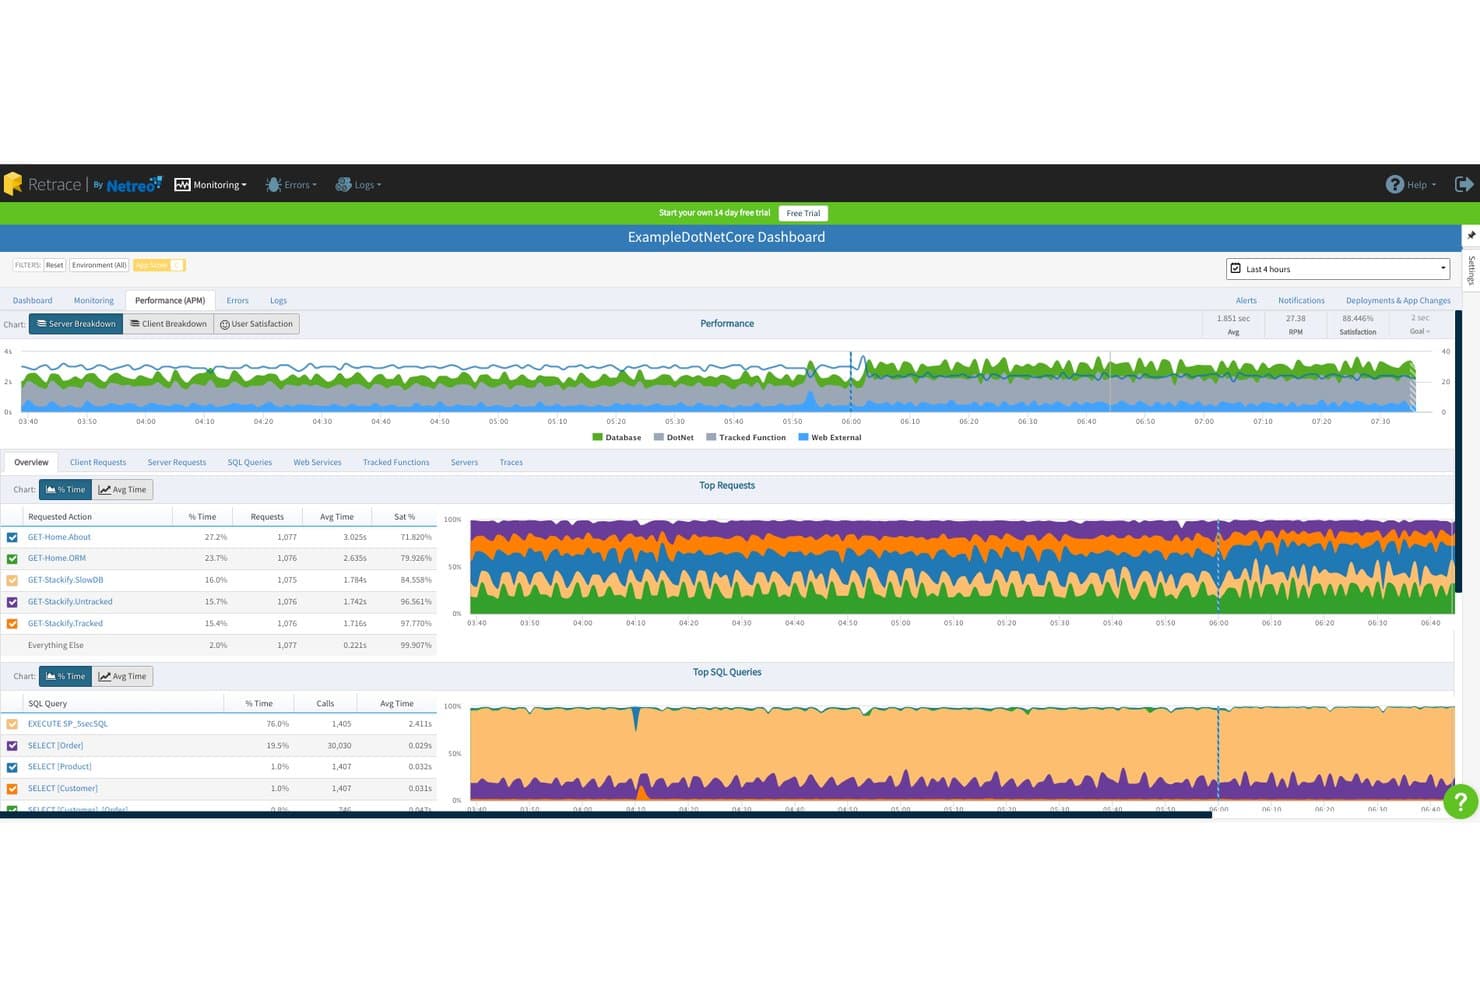
Stackify tracks request performance and SQL queries in its APM dashboard. For developers diagnosing production issues across application logs and performance data, Stackify helps connect errors and slowdowns so teams can investigate failures faster.
Who Is Stackify Best For?
Stackify suits software development teams that need application performance monitoring and error tracking to support day-to-day application maintenance.
Why I Picked Stackify
I picked Stackify as “Best for developers needing comprehensive application performance tools” because it connects production errors with slowdowns. Its application logs, error tracking, and performance data help me trace a slow request to related errors during an incident.
Stackify Key Features
- Full-text search: Search log messages and filter by fields or tags.
- Structured log properties: Search structured entries by custom properties and tags.
- Real-time log tailing: Follow incoming log entries as they arrive.
- Saved-query alerts: Run saved searches on a schedule and alert when results match set criteria.
Stackify Integrations
Retrace documents integrations with Slack, Jira, Axosoft, Azure, Octopus, and Bamboo. It also supports custom connections through HTTP APIs and webhooks, with a documented Zapier webhook setup.
Pros and Cons
Pros:
- Deployment markers link releases to performance changes
- Code-level traces expose slow SQL dependencies
- Correlates exceptions with surrounding application logs
Cons:
- Reviewers report limited dashboard customization
- Product reaches end of life March 2027
Learn more about Stackify: Best for AI-driven observability across full-stack ops
- 15-day free trial
- From $7/month
Visit WebsiteCustomer Rating:4.5/5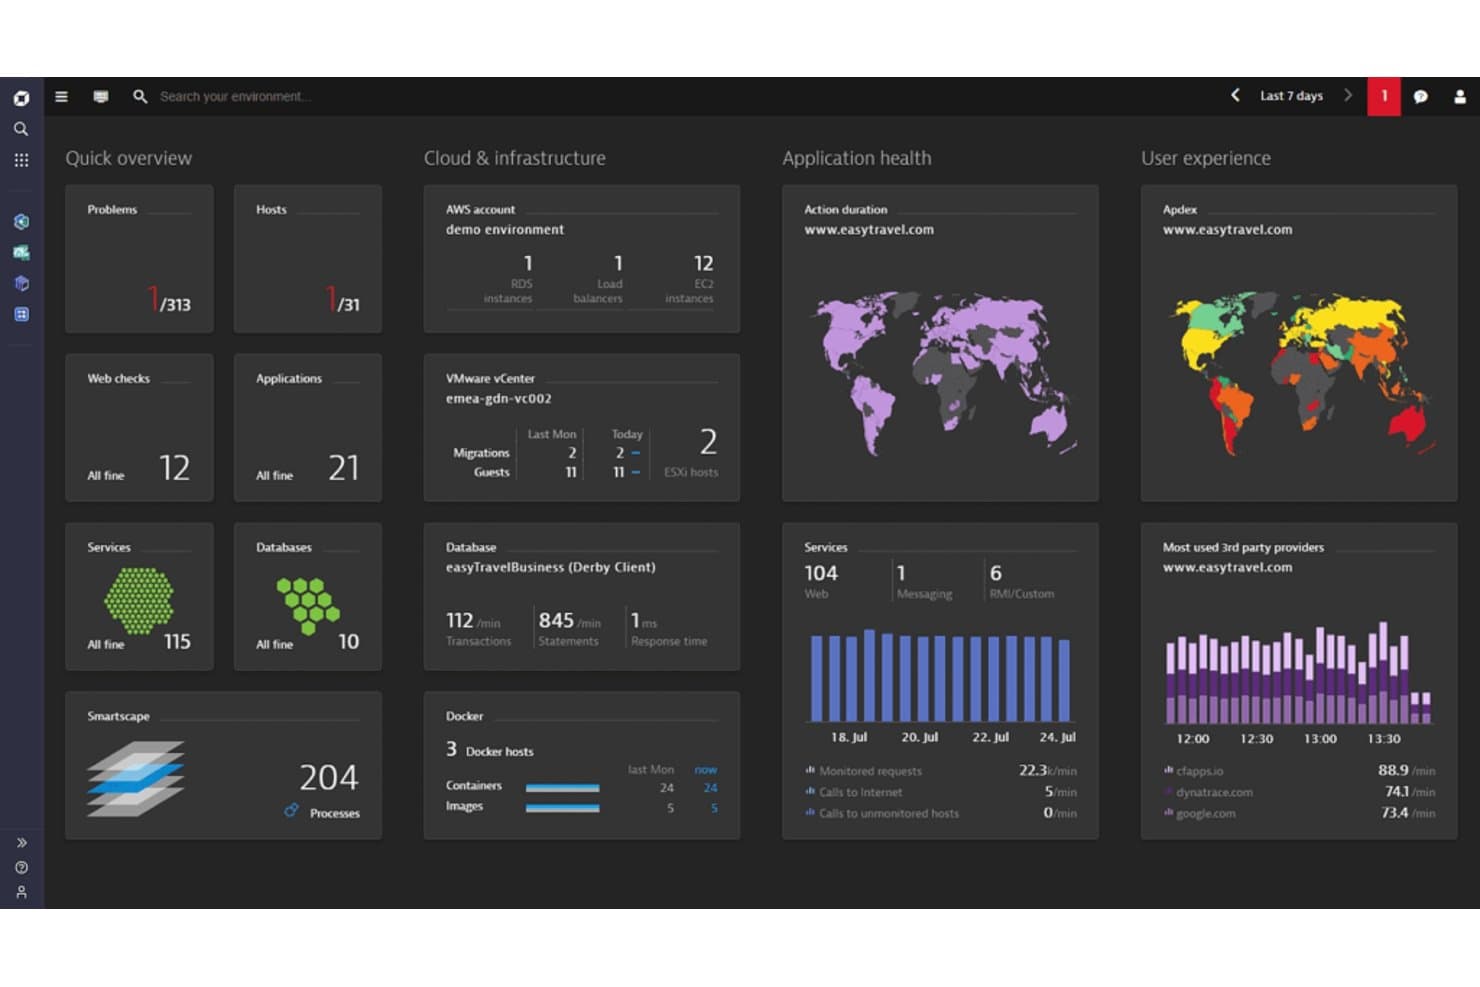
A photo of Dynatrace's cloud visibility dashboard. Dynatrace is an observability platform for IT and software teams that connects log, application, and infrastructure data to help trace service issues and investigate performance problems across complex environments.
Who Is Dynatrace Best For?
Software engineering and IT operations teams can use Dynatrace to apply AI assistance when analyzing application performance and software issues.
Why I Picked Dynatrace
I picked Dynatrace as a Sumo Logic alternative for organizations prioritizing AI-assistance in software intelligence. Its Davis AI analyzes application, log, and infrastructure data to help connect a service slowdown with its likely cause. I like that teams can trace an issue across these signals instead of investigating each data source in isolation.
Dynatrace Key Features
- Log ingestion: Collect logs from hosts, Kubernetes, cloud services, and applications.
- Log processing rules: Parse, transform, and enrich logs before storage.
- Log search and filtering: Query logs by content, fields, and time range.
- Log dashboards: Create dashboards with visualizations based on log data.
Dynatrace Integrations
Dynatrace’s integration catalog lists 750+ integrations, including GitHub, Jira, Slack, and ServiceNow; Workflows also offers connectors for AWS, Kubernetes, Microsoft Teams, PagerDuty, GitLab, and Jenkins. Dynatrace provides APIs for custom integrations.
Pros and Cons
Pros:
- Unified logs, metrics, traces, and user monitoring
- OneAgent automates discovery across complex environments
- Davis AI correlates signals to identify root causes
Cons:
- Dashboard configuration can require manual effort
- DQL syntax takes time to learn
 Best for unifying logs, metrics, and traces in one view
- Free plan available
- From $15/month (billed annually)
Visit WebsiteCustomer Rating:4.5/5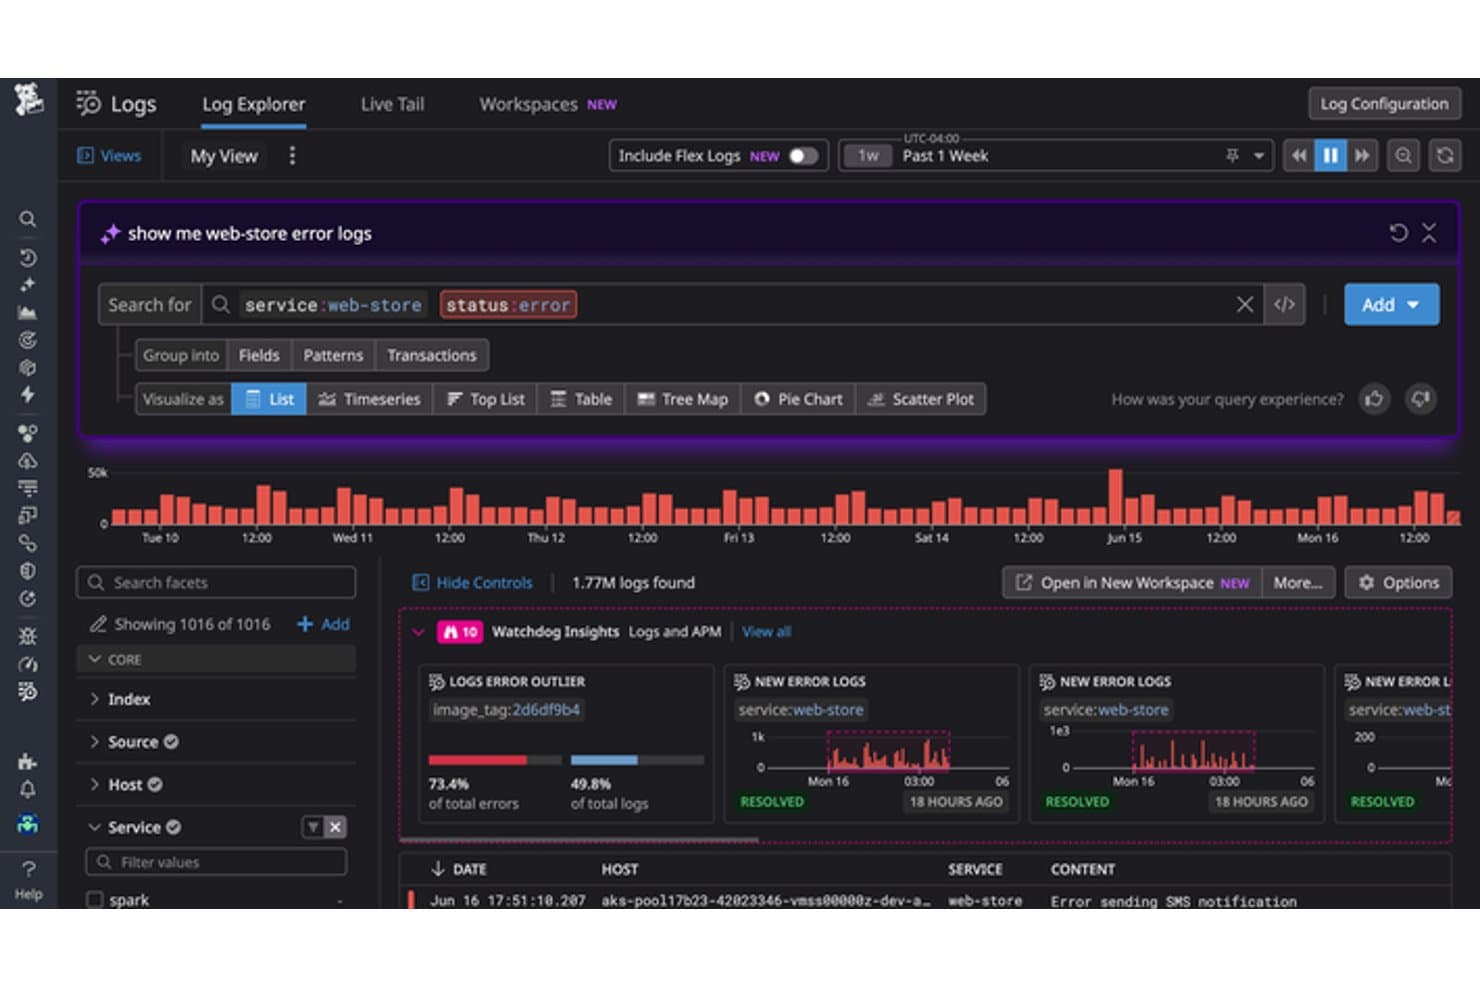
Datadog lets users query and analyze error logs with AI-assisted search. Datadog gives infrastructure and operations teams a log management platform for investigating incidents across applications and infrastructure, helping make troubleshooting distributed systems less fragmented.
Who Is Datadog Best For?
Datadog suits IT operations, SRE, and platform teams that need to correlate infrastructure and application data during incident response.
Why I Picked Datadog
Datadog earns a place on my Sumo Logic alternatives list because it’s Best for those who need unified metrics, traces, and logs. I like that Log Explorer lets me filter and investigate log events, then correlate them with traces and infrastructure metrics using trace IDs and tags. When a checkout request fails, I can follow its errors across services and inspect related system signals.
Datadog Key Features
- Live Tail: Streams indexed and non-indexed logs in near real time.
- Log processing pipelines: Parse and enrich logs with configurable processors.
- Log archives: Forward ingested logs to cloud storage for long-term retention.
- Log-based metrics: Create count or distribution metrics from matching logs.
Datadog Integrations
Datadog offers more than 1,000 built-in integrations, including AWS, Azure, Google Cloud, Kubernetes, Slack, PagerDuty, and Jira. It also provides an API for custom integrations.
Pros and Cons
Pros:
- Live Tail surfaces events in near real time
- Log Explorer speeds high-volume incident investigations
- Correlates logs, traces, and infrastructure metrics
Cons:
- Complex setup can require extra configuration time
- High log volumes can drive unpredictable costs
 Best for hybrid IT infrastructure monitoring at scale
- 15-day free trial + free demo available
- From $19/month
Visit WebsiteCustomer Rating:4.5/5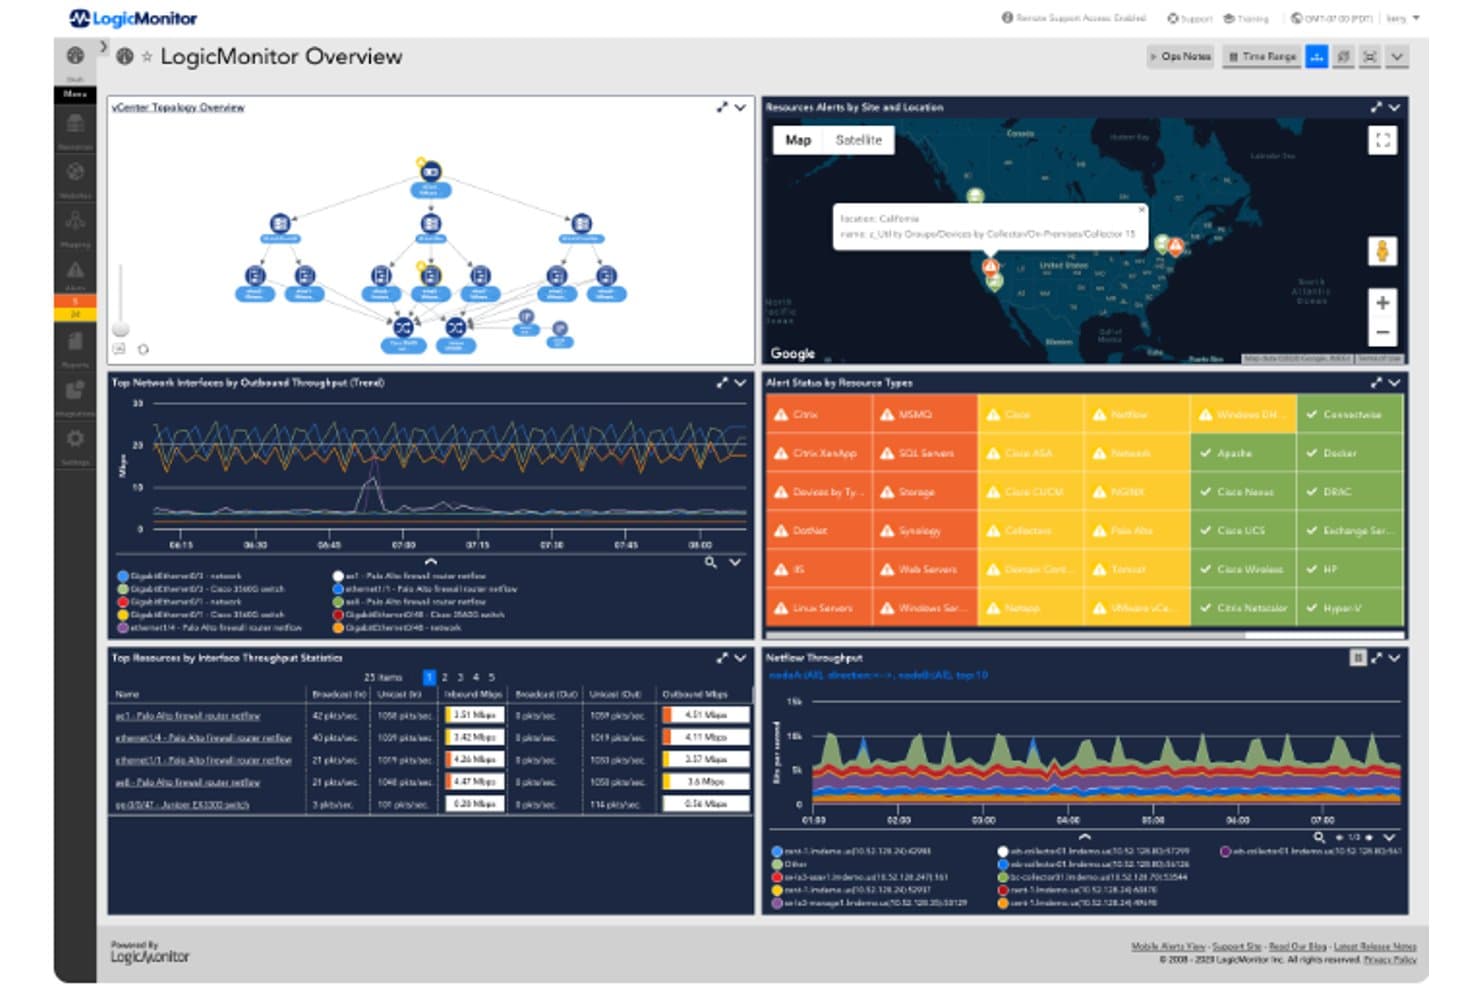
LogicMonitor unifies network, infrastructure, and alert monitoring in one dashboard. For teams comparing Sumo Logic alternatives, LogicMonitor is a cloud-based observability platform that brings infrastructure metrics and logs into one view, helping IT and DevOps teams investigate outages and performance issues across complex environments.
Who Is LogicMonitor Best For?
LogicMonitor suits IT operations teams that need automated monitoring across complex infrastructure environments.
Why I Picked LogicMonitor
I picked LogicMonitor because its focus matches the USP: Best for IT operations and DevOps needing automated infrastructure monitoring. I like that it brings infrastructure metrics and logs into one view, so I can investigate a service slowdown alongside related log events. Automated monitoring across complex environments also helps teams spot infrastructure issues without relying on manual checks.
LogicMonitor Key Features
- Log query language: Search logs by resource, resource group, and time range.
- Log source filters: Set include or exclude criteria for collected log events.
- Regex-based log alerts: Match log patterns with regular expressions to trigger alerts.
- Log anomaly profiles: Review resource behavior and identify deviations from expected patterns.
LogicMonitor Integrations
LogicMonitor documents 3,000+ out-of-the-box technology integrations; preconfigured alert and workflow integrations include Slack, PagerDuty, ServiceNow, Jira Service Management, ConnectWise, and Datto Autotask. Its REST API supports custom integrations.
Pros and Cons
Pros:
- Health dashboards and alerts earn user praise
- Log and metric correlation supports investigations
- Broad monitoring across hybrid infrastructure
Cons:
- Cloud monitoring depends on internet connectivity
- Custom reports need substantial configuration
Learn more about LogicMonitor: Best for self-managed log search at terabyte scale
- 60-day free trial
- Pricing upon request
Visit WebsiteCustomer Rating:4.4/5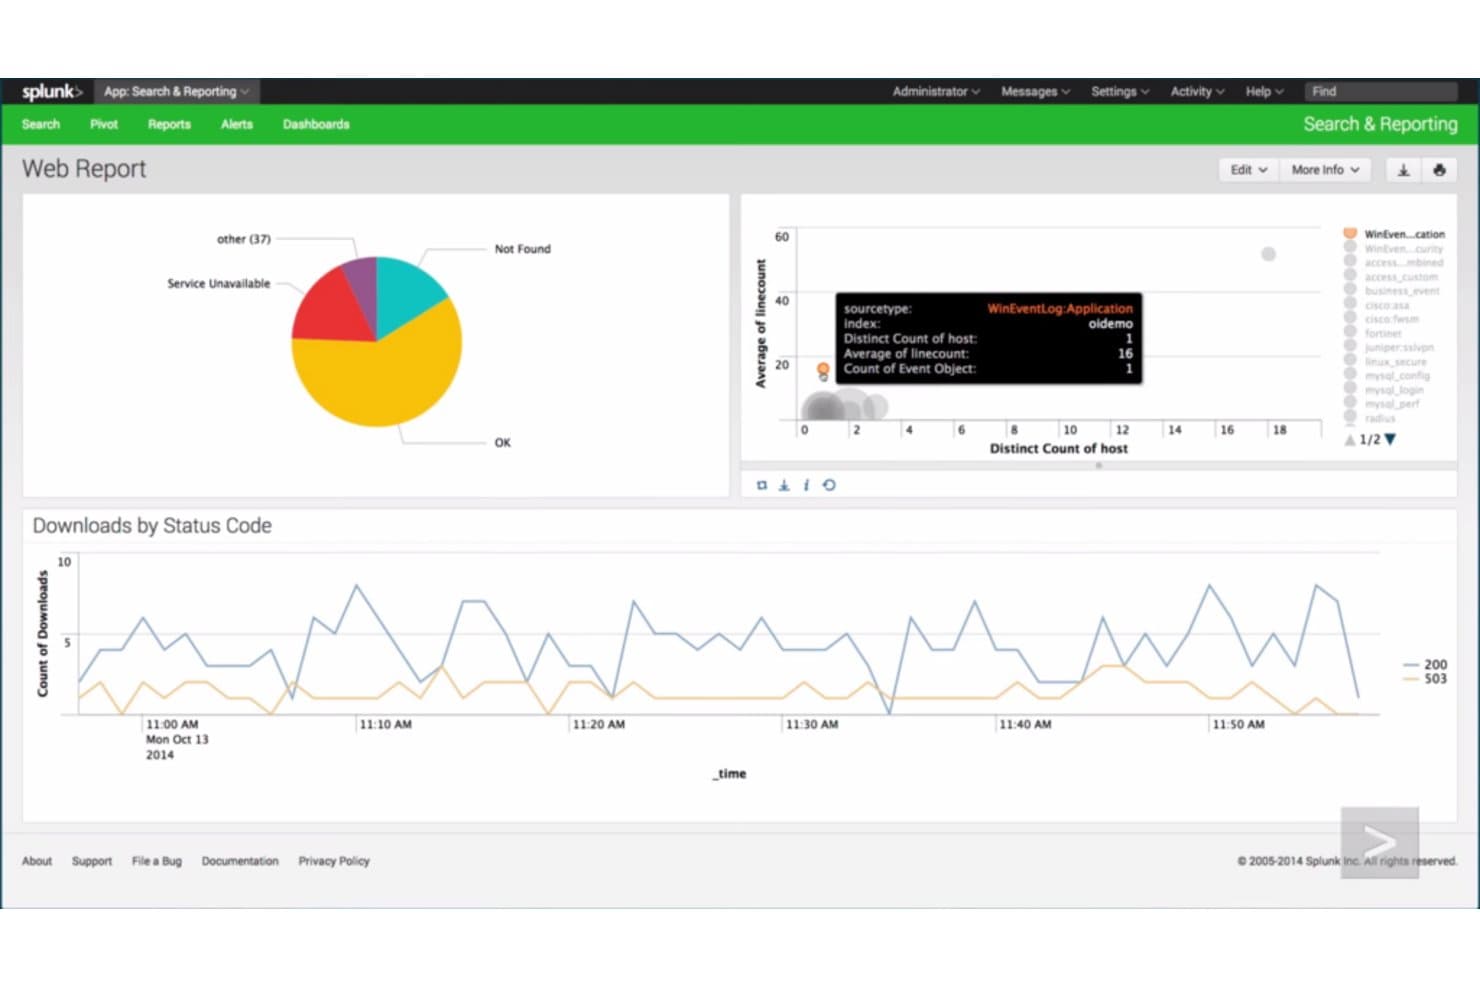
Splunk Enterprise visualizes web traffic and downloads across interactive dashboards. Splunk Enterprise gives infrastructure and security teams a searchable view of machine data across on-premises and cloud systems, helping them investigate incidents and diagnose service problems.
Who Is Splunk Enterprise Best For?
Splunk Enterprise suits IT and security teams at organizations with complex infrastructure that need to collect and analyze machine data across many systems.
Why I Picked Splunk Enterprise
I picked Splunk Enterprise because it matches “Best for businesses requiring high-powered data collection and analytics.” It indexes machine data from on-premises and cloud systems for cross-source searches, while SPL searches and alerts help me trace an outage across application and infrastructure logs.
Splunk Enterprise Key Features
- Dashboards: Build visual panels from search results to monitor logs and metrics.
- Scheduled reports: Run saved searches on a schedule and share their results.
- Role-based access controls: Set user permissions for data, searches, and administrative tasks.
- Field extraction: Extract fields from event data to make log attributes easier to inspect.
Splunk Enterprise Integrations
Splunk Enterprise has 1,000+ apps and add-ons available through Splunkbase, including options for AWS, Microsoft Windows, and Google Cloud Platform; availability and support vary by add-on. It also provides REST APIs and SDKs for custom integrations, plus HTTP Event Collector for sending events to Splunk.
Pros and Cons
Pros:
- Custom dashboards support incident investigations
- Searches machine data across hybrid environments
- Correlates events across systems with SPL
Cons:
- Searches can slow at high volumes
- SPL queries require specialist expertise
Learn more about Splunk Enterprise: Best for linking app performance to business impact
- 30-day free trial
- From $6/vCPU/month (billed annually)
Visit WebsiteCustomer Rating:4.3/5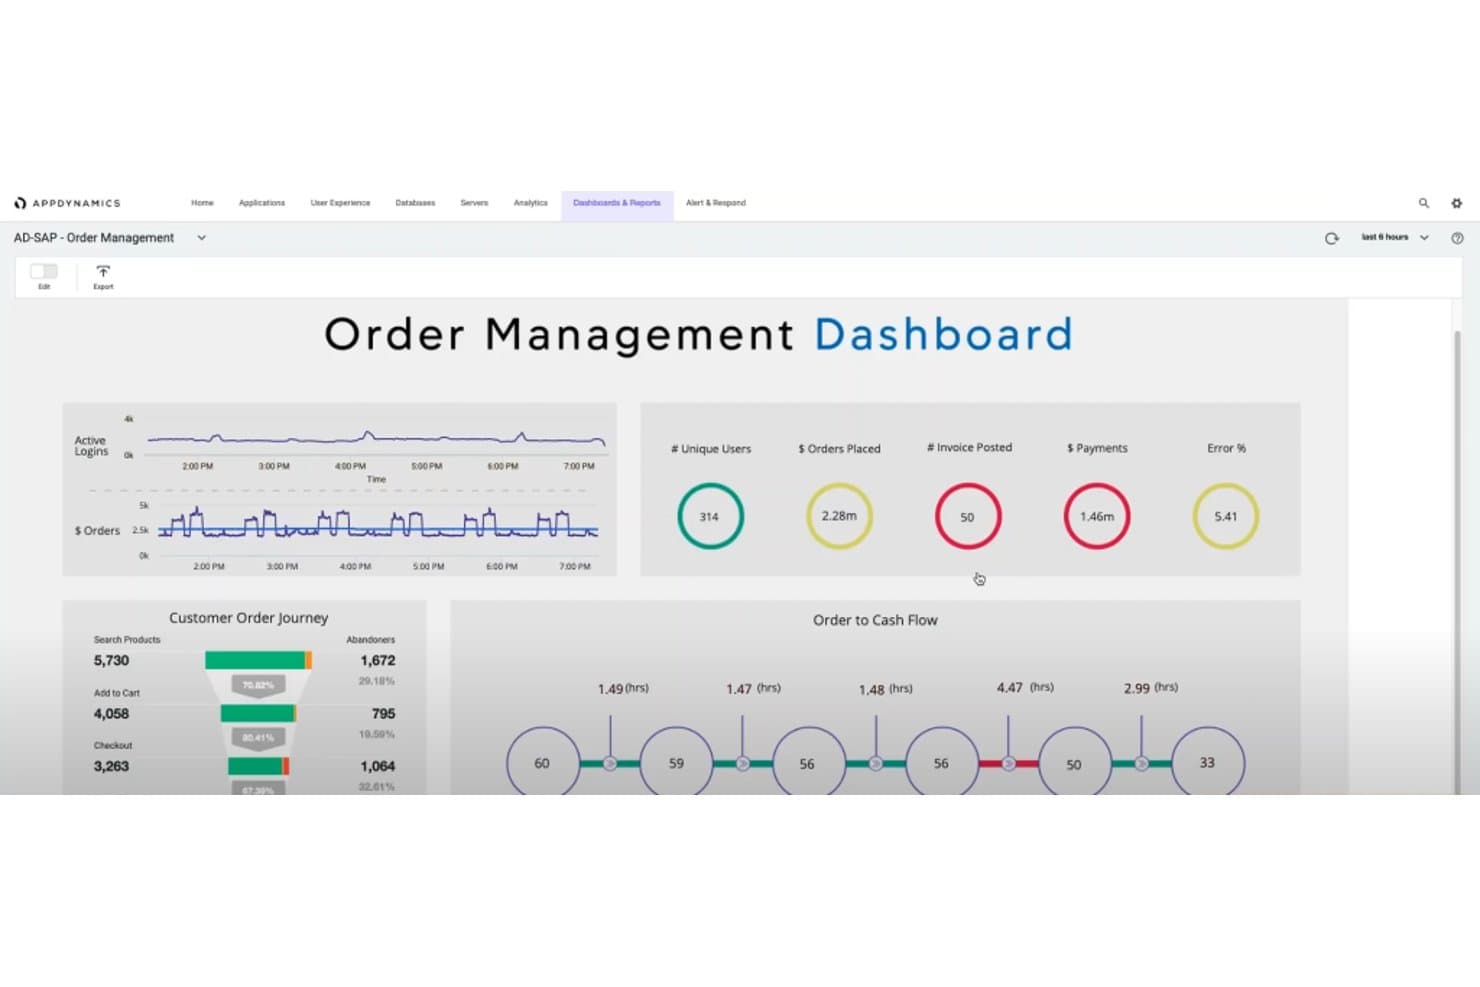
AppDynamics tracks order management KPIs and customer journey flows. AppDynamics is an application performance monitoring platform for IT teams that need to connect application behavior with log data to investigate errors, slowdowns, and service disruptions.
Who Is AppDynamics Best For?
AppDynamics suits IT operations and application teams that need to monitor performance across complex, interconnected business services.
Why I Picked AppDynamics
I picked AppDynamics for this Beyond Sumo Logic shortlist because it’s Best for businesses seeking end-to-end performance monitoring. I like how it connects business transaction monitoring with log data, so I can trace a slow checkout request and inspect related errors. That link helps me distinguish an application fault from an infrastructure issue during an incident.
AppDynamics Key Features
- Log analytics: Analyze log data with Analytics and visualize results in dashboards.
- Pattern monitoring: Configure text strings or regular expressions to count matches in log files.
- Rotated file monitoring: Monitor log files that keep growing and rotate into multiple files.
- Log metrics and alerts: Track file sizes and match counts as metrics for health rules.
AppDynamics Integrations
AppDynamics documents nine built-in integration modules, including Jira Actions, ServiceNow, and Splunk, and supports connecting with Splunk Cloud Platform or Splunk Enterprise. It also offers REST APIs for custom integrations and automation.
Pros and Cons
Pros:
- Flow maps connect application and infrastructure health
- Code-level snapshots speed root-cause diagnosis
- Business transaction traces expose failing service hops
Cons:
- Cloud-native monitoring trails newer observability platforms
- Agent setup demands substantial upfront configuration
Learn more about AppDynamics: Best for full-stack observability with built-in AI
- Free plan available
- From $10/user/month
Visit WebsiteCustomer Rating:4.3/5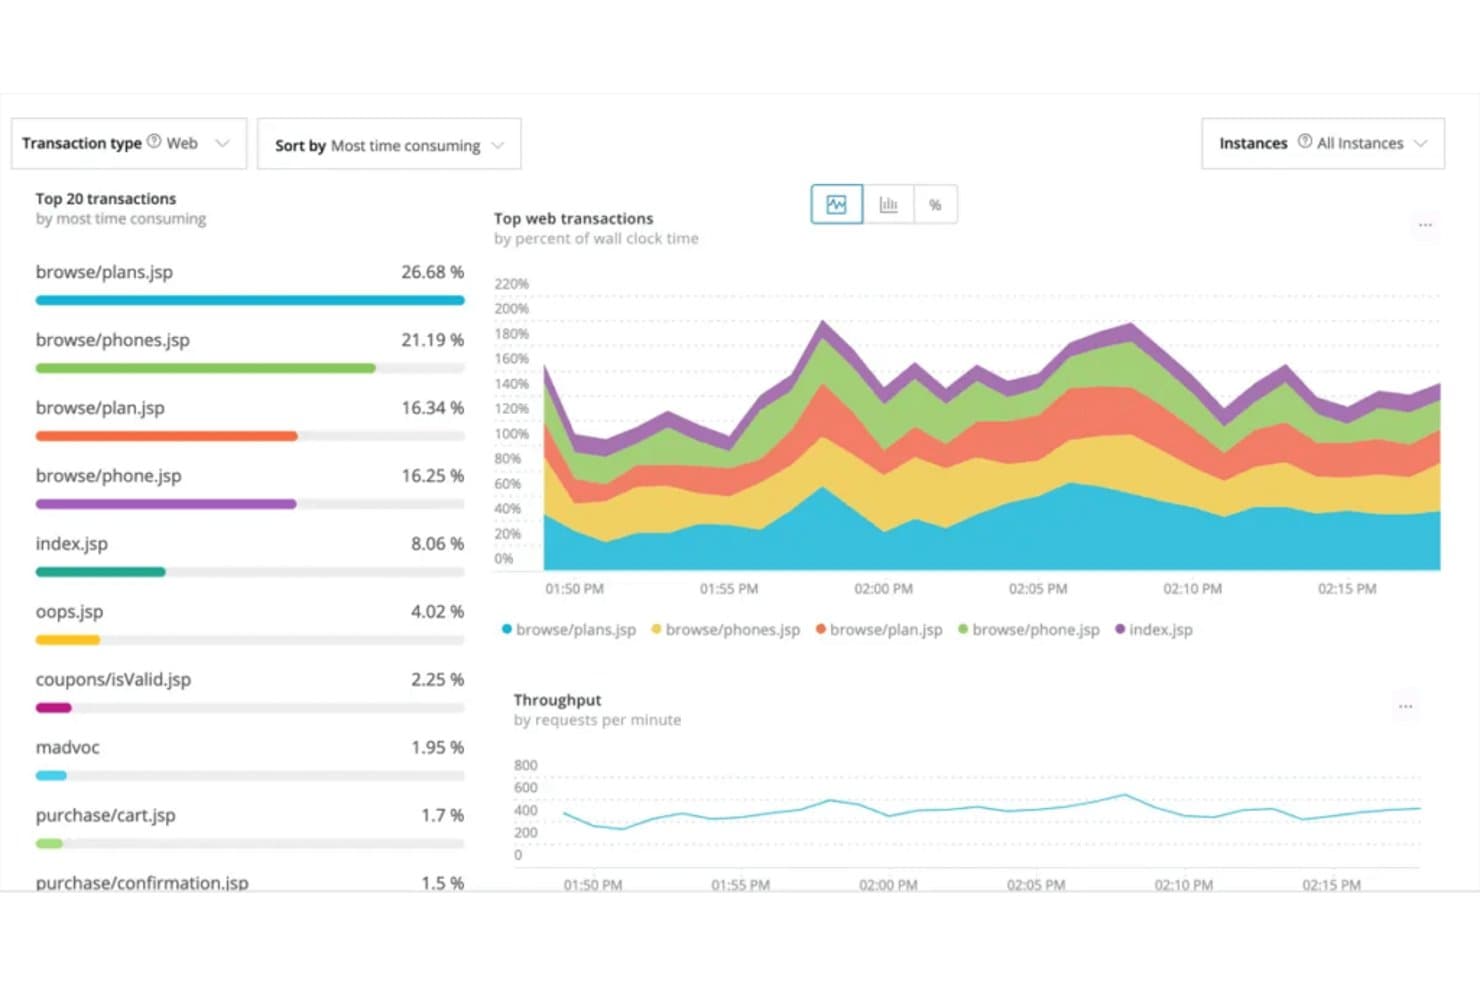
New Relic tracks top web transactions by time consumption and throughput. New Relic is a cloud-based observability platform for IT and DevOps teams that brings logs, metrics, and traces together to help investigate outages, find application issues, and monitor infrastructure performance.
Who Is New Relic Best For?
New Relic suits IT and DevOps teams that need to connect application, infrastructure, and service data to investigate incidents across complex environments.
Why I Picked New Relic
I picked New Relic, best for full-stack observability with applied intelligence, because Logs in Context connects log events with related traces and services. When an alert points to errors across services, applied intelligence correlates signals into issues, helping me investigate the incident through connected logs and traces.
New Relic Key Features
- NRQL log queries: Search and filter log events with New Relic Query Language.
- Log parsing: Apply built-in or custom rules to extract searchable attributes from logs.
- Log patterns: Group similar messages to review recurring patterns and changes over time.
- Data partitions: Organize log data into partitions for targeted queries.
New Relic Integrations
New Relic’s Instant Observability catalog includes 700+ integrations and quickstarts, with options for AWS, Azure, Google Cloud, Kubernetes, Apache, Cassandra, MySQL, NGINX, Redis, and Oracle Database. You can also use New Relic APIs or Flex to send data from custom integrations.
Pros and Cons
Pros:
- AI summaries speed log alert triage
- NRQL queries logs and telemetry together
- Correlates logs with traces and services
Cons:
- Ingestion growth makes budgets unpredictable
- Busy interface slows log investigations
Learn more about New Relic: Best for modern engineers needing robust log management
- Free plan available
- From $29/user/month (billed annually)
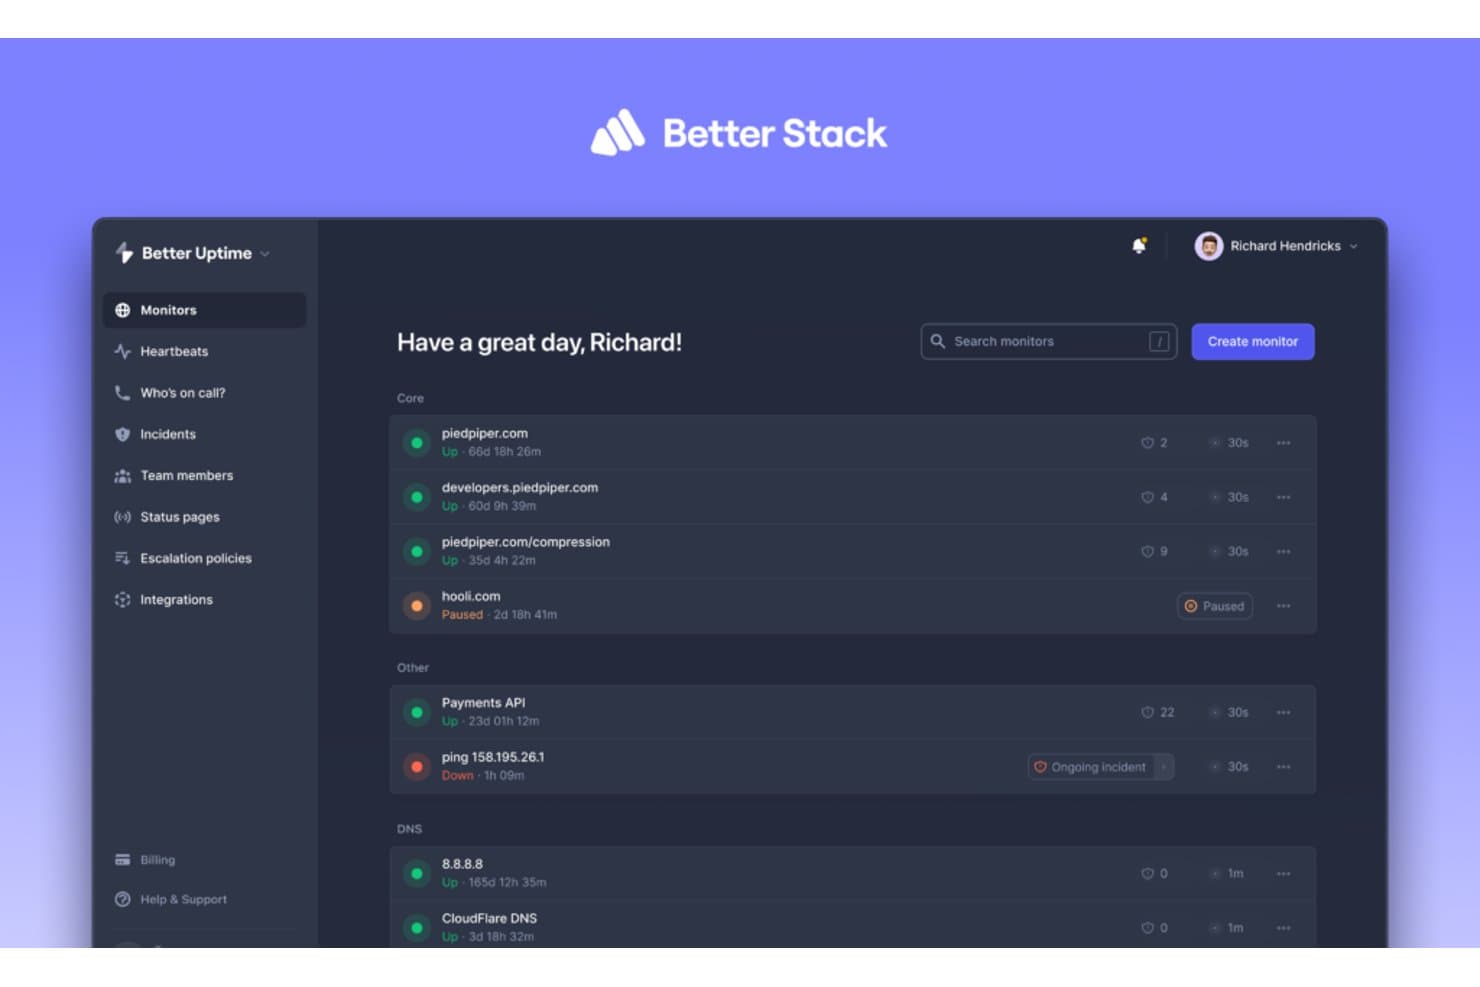
Better Stack lets users monitor uptime across multiple services at once. Better Stack combines log management and service monitoring for engineering teams that need to investigate production errors, spot infrastructure issues, and respond to incidents.
Who Is Better Stack Best For?
Better Stack suits engineering and infrastructure teams that need to search application logs and monitor services during incident response.
Why I Picked Better Stack
I picked Better Stack as “Best for modern engineers needing robust log management” because its live tail and SQL-based search help me trace production errors through incoming logs. I also use log alerts to catch recurring failures and investigate them during incidents.
Better Stack Key Features
- Log source integrations: Collect logs from applications, Docker, Kubernetes, Vector, Syslog, or OpenTelemetry.
- Automatic parsing: Parse logs based on the selected source type.
- VRL transformations: Redact personal data or discard unwanted events before storage.
- Configurable retention: Set log retention periods separately for each source.
Better Stack Integrations
Better Stack supports log ingestion from Docker, Kubernetes, PostgreSQL, Cloudflare, JavaScript/Node.js, and Python, with forwarding via Vector, Fluent Bit, Logstash, Fluentd, or Syslog. It also offers an HTTP API for custom log ingestion and connects with Zapier.
Pros and Cons
Pros:
- Log alerts connect investigations with incident response
- SQL queries pair with visual log filters
- Live-tail search helps trace production errors
Cons:
- No self-hosted option for strict data control
- Log-management workflows can feel clumsy
Learn more about Better Stack:
Outras alternativas ao Sumo Logic
Eis algumas alternativas adicionais ao Sumo Logic que não entraram na minha lista restrita, mas que vale a pena conhecer:
- 11Grafana CloudBest for visualizing and analyzing metrics from mixed sources
- 12GraylogBest for large-scale log management and analysis in real-time
- 13Logz.ioBest for cloud-native organizations valuing AI-powered insights
- 14LogRhythmBest for enterprises requiring advanced security information and event management
- 15Hosted GraphiteGood for detailed metrics visualization and alerting
- 16CoralogixGood for automated anomaly and trend detection in logs
- 17LogglyGood for troubleshooting with centralized log analysis
- 18MoogsoftGood for reducing noise in IT alerts with AI-driven insights
- 19LogEntriesGood for real-time log data search, visualization, and alerting
- 20LogstashGood for dynamic data collection and enrichment pipeline
- 21Amazon CloudWatchGood for monitoring AWS resources and applications in real-time
- 22IBM Instana ObservabilityGood for real-time application performance monitoring
- 23LogPointGood for compliance management and proactive threat hunting
- 24IBM Security QRadar SuiteGood for centralized security incident detection and response
- 25Fluent BitGood for lightweight log processing and forwarding
- 26Trellix Security ManagerGood for threat intelligence and management across large enterprise networks
- 27NXLogGood for multi-platform log collection and routing
Avaliações de outro software
How I Evaluate Sumo Logic Alternatives
I split my evaluation into two layers: the baseline capabilities every viable tool must have, and the differentiators that matter most for teams drowning in cloud logs or chasing down incident root causes.
Core Functionality (Table Stakes For This List)
When I'm selecting tools for my list, I rank each one on a scale from 0 (does not offer the functionality) to 5 (excels in this area) for each core functionality listed below. Then, I calculate the tool's total score into a percentage. Each tool needs to achieve a minimum total score of 75% to be considered for inclusion.
- Log Aggregation & Ingestion: I evaluate how many sources a tool can ingest from out of the box—think Kubernetes pods, cloud VPCs, containerized apps, and legacy syslog servers all feeding into one pipeline.
- Real-Time Search & Query: Fast, expressive querying matters when you're mid-incident. I check how each tool handles complex queries across large datasets and whether its query language supports parsing, filtering, and aggregation.
- Metrics & Observability: I look for unified views that bring logs, metrics, and traces together. A tool that forces you to pivot between disconnected dashboards to correlate a latency spike with an error log slows down troubleshooting.
- Alerting & Anomaly Detection: Good alerting goes beyond static thresholds. I evaluate whether each tool offers ML-based anomaly detection and flexible routing to channels like Slack, PagerDuty, or webhook endpoints.
- Security Analytics & SIEM: For SecOps teams, I check whether the platform supports threat detection, event correlation, and compliance reporting for frameworks like SOC 2, HIPAA, or PCI-DSS.
- Cloud-Native & Integrations: Each tool should plug into the ecosystems teams already use. I look for pre-built integrations with AWS, Azure, GCP, and common DevOps toolchains alongside open API access.
Once I have a list of tools that meet this criteria, I consider what sets each platform apart.
Differentiating Factors (What Sets Vendors Apart)
Here's how I compare and contrast different vendors:
Standout Features
Distributed tracing is a big one—I look for native OpenTelemetry support that lets you follow a single request across dozens of microservices to isolate exactly where latency spikes. Customizable data tiers also matter because they directly affect cost; tools that offer hot, warm, and cold storage with rehydration give you more control over retention budgets. I also evaluate AI-powered insights, where platforms surface root causes or anomalies automatically instead of requiring manual query work during a 2 a.m. incident.
Beyond Features
Pricing model is one of the first things I evaluate. Log volumes can spike during incidents, so I check whether a vendor's billing structure penalizes you for those surges or offers predictable costs. Deployment flexibility matters too—teams in regulated industries often need self-hosted or air-gapped options alongside SaaS. I also look at scalability track records, since a platform that queries well at 500 GB per day may struggle at 5 TB. Compliance certifications like SOC 2 and HIPAA tell me whether a tool is enterprise-ready out of the gate.
Por que procurar uma alternativa ao Sumo Logic?
Embora o Sumo Logic seja uma boa escolha como plataforma de gestão de registos, existem vários motivos pelos quais alguns utilizadores procuram soluções alternativas. Poderá estar à procura de uma alternativa ao Sumo Logic porque…
- Os preços não acompanham bem volumes elevados de dados.
- O desempenho das consultas abranda com grandes conjuntos de dados.
- A interface de utilizador pode parecer demasiado complexa para novos utilizadores.
- As funcionalidades avançadas exigem uma curva de aprendizagem acentuada.
- A integração com algumas ferramentas não é tão fluida.
- As opções de alertas parecem demasiado limitadas para as suas necessidades.
Se alguma destas situações lhe parece familiar, veio ao sítio certo. A minha lista inclui várias opções de plataformas de gestão de registos mais adequadas a equipas que enfrentam estes desafios com o Sumo Logic e procuram soluções alternativas.
Principais funcionalidades do Sumo Logic
Eis algumas das principais funcionalidades do Sumo Logic, para ajudar a comparar as soluções alternativas e verificar o que oferecem:
- Controlo de acesso baseado em funções: Permite definir quem pode ver ou fazer o quê na sua equipa.
- Análise de registos: Permite recolher, pesquisar e analisar dados de registos em todos os seus sistemas.
- Painéis em tempo real: Ajudam a monitorizar métricas importantes em tempo real, para que a sua equipa possa reagir rapidamente.
- Alertas: Notificam a sua equipa quando ocorre algo invulgar ou importante nos seus dados.
- Arquivo de dados: Permite armazenar dados históricos para fins de conformidade ou análises futuras.
- Arquitetura nativa da nuvem: Proporciona à sua equipa flexibilidade através de uma gestão de registos escalável e baseada na nuvem.
- Análise de segurança: Ajuda a detetar ameaças ou violações de políticas utilizando os seus dados de registos.
- Integrações: Liga-se facilmente a serviços como AWS, GCP, Azure e Kubernetes.
- Linguagem de consulta: Permite explorar detalhadamente os dados utilizando uma linguagem de pesquisa flexível e pormenorizada.
- Informações obtidas através de aprendizagem automática: Identificam padrões ou anomalias que possam exigir atenção.