

O software de gestão de operações de TI ajuda a gerir — e a compreender — toda a sua infraestrutura de TI, abrangendo a monitorização, a automatização, a segurança e o estado dos serviços em ambientes locais e na cloud.
Esta lista foi criada para CTOs e líderes de TI que precisam de uma visão unificada, de uma análise mais rápida da causa-raiz e de soluções preparadas para operações híbridas e multinuvem. Encontrará opções para automatização orientada por IA, observabilidade aprofundada, integrações de segurança nativas e a capacidade de personalização necessária para expandir o que é mais importante.
Why Trust Our Software Recommendations
6,700+
Reviews
20
Industry experts
16+
Evaluation factors
14
Years
Our team has been testing and reviewing software since 2012. As tech leaders ourselves, we know how difficult—and important—it is to choose the right software.
For this guide, we evaluated tools using hands-on testing and independent research, scoring tools using our selection criteria.
Our reviews reflect our human editorial judgment, not a sales pitch.
Expert reviewers:
- Paulo Gardini MiguelTech Director
 Tim FisherVP of AI
 Gabriel RosasTech Lead & Software Architect
 Christhian GruhnTech Lead & Platform Architect

Tabela comparativa de software de gestão de operações de TI
Compare os preços e as principais especificações das minhas principais escolhas de software de gestão de operações de TI na tabela abaixo.
| Tool | Best For | Trial Info | Price | ||
|---|---|---|---|---|---|
| 1 | Best for AI-driven full-stack release validation | 15-day free trial | From $7/month | Website | |
| 2 | Best for unified telemetry with FinOps built in | Free plan available | From $15/month (billed annually) | Website | |
| 3 | Best for SecOps-fused log and metrics ops | 14-day free trial | Pricing upon request | Website | |
| 4 | Best for OTel-native full-stack ops visibility | 7-day free trial | From $0.07/GB | Website | |
| 5 | Best for MSP-grade multi-tenant hybrid ITOps | Free demo available | Pricing upon request | Website | |
| 6 | Best for AI-driven alert-to-topology root cause ops | 15-day free trial + free demo available | From $19/month | Website | |
| 7 | Best for transaction-level full-stack observability | Free plan available | From $10/user/month | Website | |
| 8 | Best for CMDB-anchored hybrid IT ops at scale | Free demo available | Pricing upon request | Website | |
| 9 | Best for Cisco-native cross-domain service health ops | Free demo available | Pricing upon request | Website | |
| 10 | Best for agentic AI across mainframe-to-cloud ops | Free demo available | Pricing upon request | Website |


Análises do melhor software de gestão de operações de TI
Seguem-se os meus resumos detalhados do melhor software de gestão de operações de TI que entrou na minha seleção. As minhas análises apresentam uma visão detalhada das funcionalidades, dos melhores casos de utilização e das integrações de cada plataforma, para o ajudar a encontrar a mais adequada às suas necessidades.
 Best for AI-driven full-stack release validation
- 15-day free trial
- From $7/month
Visit WebsiteCustomer Rating:4.5/5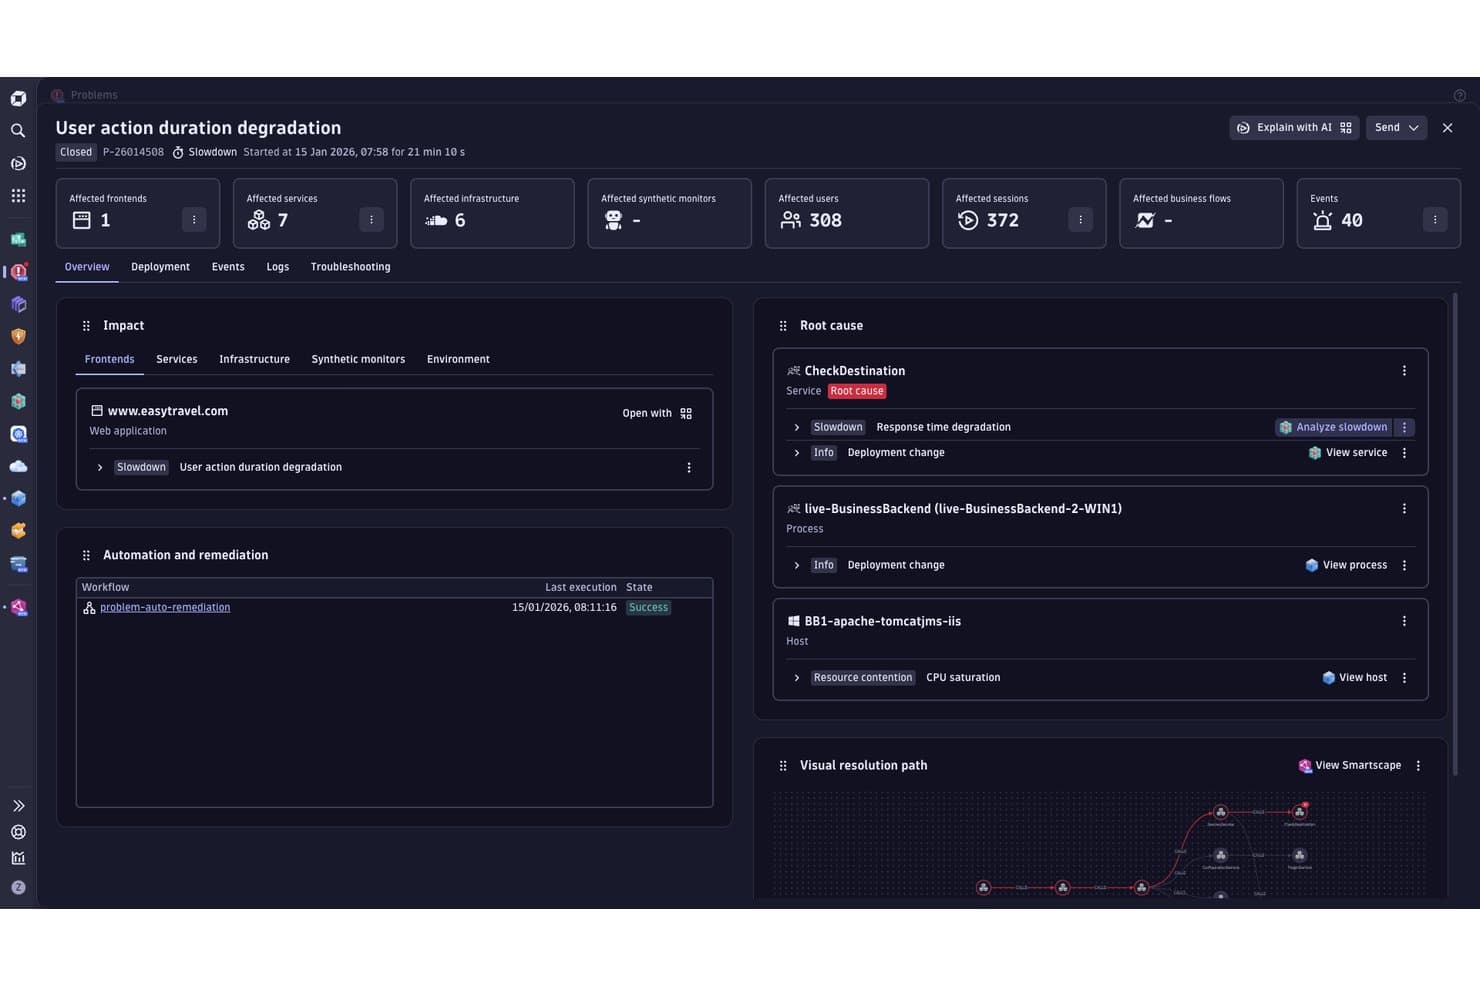
Dynatrace pinpoints root causes of performance issues automatically. Dynatrace is a full-stack IT operations management platform that spans infrastructure monitoring, AIOps-driven incident detection, log analytics, and workflow automation across hybrid and multi-cloud environments.
Who Is Dynatrace Best For?
Dynatrace is a strong fit for enterprise IT and SRE teams managing complex hybrid or multi-cloud environments who need AI-driven observability, automated incident response, and release validation at scale.
Why I Picked Dynatrace
I picked Dynatrace as one of the best because its Site Reliability Guardian is the most thorough release validation setup I've seen in this category: it automatically evaluates every deployment against predefined SLOs and KPIs before code reaches production, blocking bad releases without manual review. Pair that with Davis AI's ability to trace a production anomaly back to a single root cause across billions of live dependencies, and you get a platform that catches what slips past quality gates and explains exactly why.
Dynatrace Key Features
- Smartscape topology mapping: Auto-discovers and visualizes real-time dependencies across hosts, containers, services, and processes in hybrid and multi-cloud environments.
- Grail data lakehouse: Unifies metrics, logs, traces, events, and security signals in a single index-free store, queryable via DQL without schema configuration.
- AutomationEngine workflow builder: A no-code/low-code visual editor for building event-driven or scheduled automation workflows grounded in live observability data.
- Predictive alerting: Forecasts capacity and performance violations before they occur using continuously learned behavioral baselines across every monitored component.
Dynatrace Integrations
Dynatrace offers 900+ integrations through Dynatrace Hub, including ServiceNow, Jira Service Management, PagerDuty, Slack, Microsoft Teams, AWS, Azure, Google Cloud, and OpenTelemetry. Its REST API, webhooks, and AppEngine SDK support custom integrations.
Pros and Cons
Pros:
- Automated remediation with human-in-the-loop controls
- Davis AI pinpoints true root cause
- Single agent auto-discovers full-stack assets
Cons:
- SaaS-only limits options for air-gapped needs
- Consumption pricing difficult for budgeting
 Best for unified telemetry with FinOps built in
- Free plan available
- From $15/month (billed annually)
Visit WebsiteCustomer Rating:4.5/5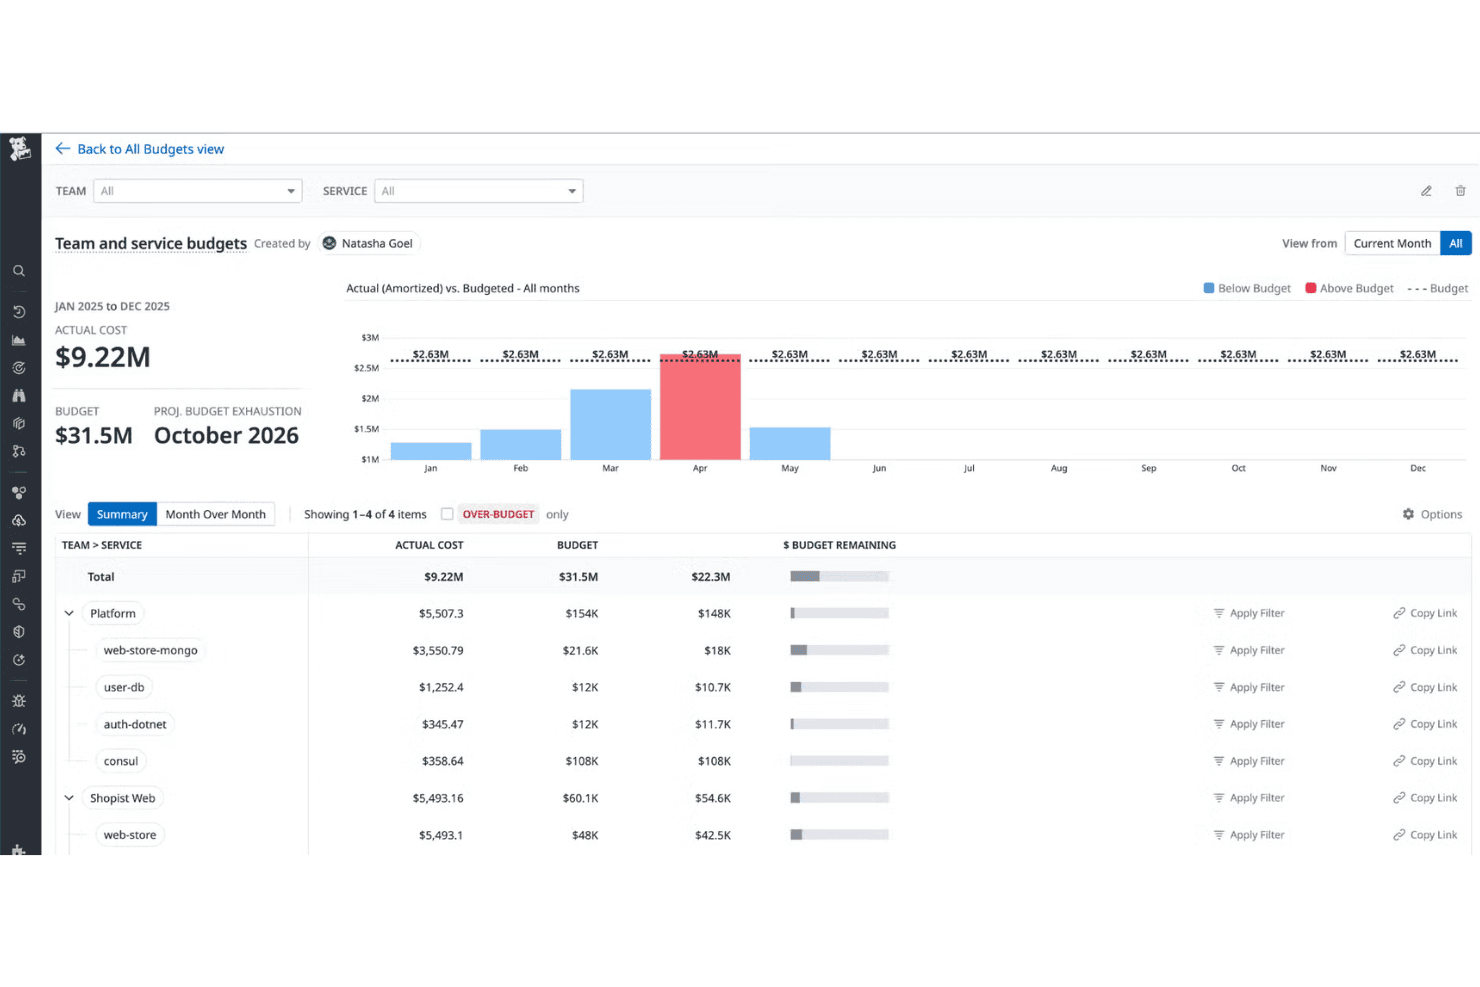
Datadog tracks team and service budgets against actual cloud spending. Datadog is a cloud-based IT operations management and observability platform that unifies infrastructure monitoring, APM, log management, network monitoring, incident management, AIOps, and workflow automation across hybrid and multi-cloud environments.
Who Is Datadog Best For?
Datadog is a strong fit for engineering and IT operations teams managing complex, multi-cloud or hybrid environments who need infrastructure monitoring, APM, and cloud cost visibility in one place.
Why I Picked Datadog
Datadog earns its spot on my shortlist because it's the only platform I've used where full-stack telemetry and cloud cost visibility genuinely live in the same place. I love that Cloud Cost Management ties infrastructure metrics directly to spend across AWS, Azure, GCP, and OCI, so when Watchdog flags a CPU anomaly on a Kubernetes cluster, I can see the cost impact without switching tools. The built-in FinOps layer, combined with AI-powered anomaly detection across metrics, logs, and traces, makes it uniquely suited to teams who need operational and financial accountability in one view.
Datadog Key Features
- Watchdog anomaly detection: An AI engine that automatically identifies performance anomalies across infrastructure metrics, APM traces, and logs without requiring manual threshold configuration.
- On-call scheduling and escalation policies: Configurable on-call rotations with routing rules and multi-channel notifications via SMS, voice, push, and email.
- Workflow Automation builder: A visual, low-code interface with 1,750+ prebuilt actions and 150+ blueprints for automating incident response, DevOps, and security workflows.
- Cloud Security Posture Management (CSPM): Continuous configuration checks across cloud accounts and containers mapped to 15+ compliance frameworks, including PCI DSS, HIPAA, and SOC 2.
Datadog Integrations
Datadog offers 1,000+ vendor-backed integrations, including AWS, Microsoft Azure, Google Cloud Platform, ServiceNow, Jira, PagerDuty, Slack, Microsoft Teams, Kubernetes, and Prometheus. Its REST API and SDKs support custom integrations.
Pros and Cons
Pros:
- End-to-end incident management built in
- AI anomaly detection helps reduce alert noise
- Unified view of infrastructure, apps, and costs
Cons:
- No self-hosted deployment for non-government users
- Modular pricing leads to unpredictable costs
 Best for SecOps-fused log and metrics ops
- 14-day free trial
- Pricing upon request
Visit WebsiteCustomer Rating:4.3/5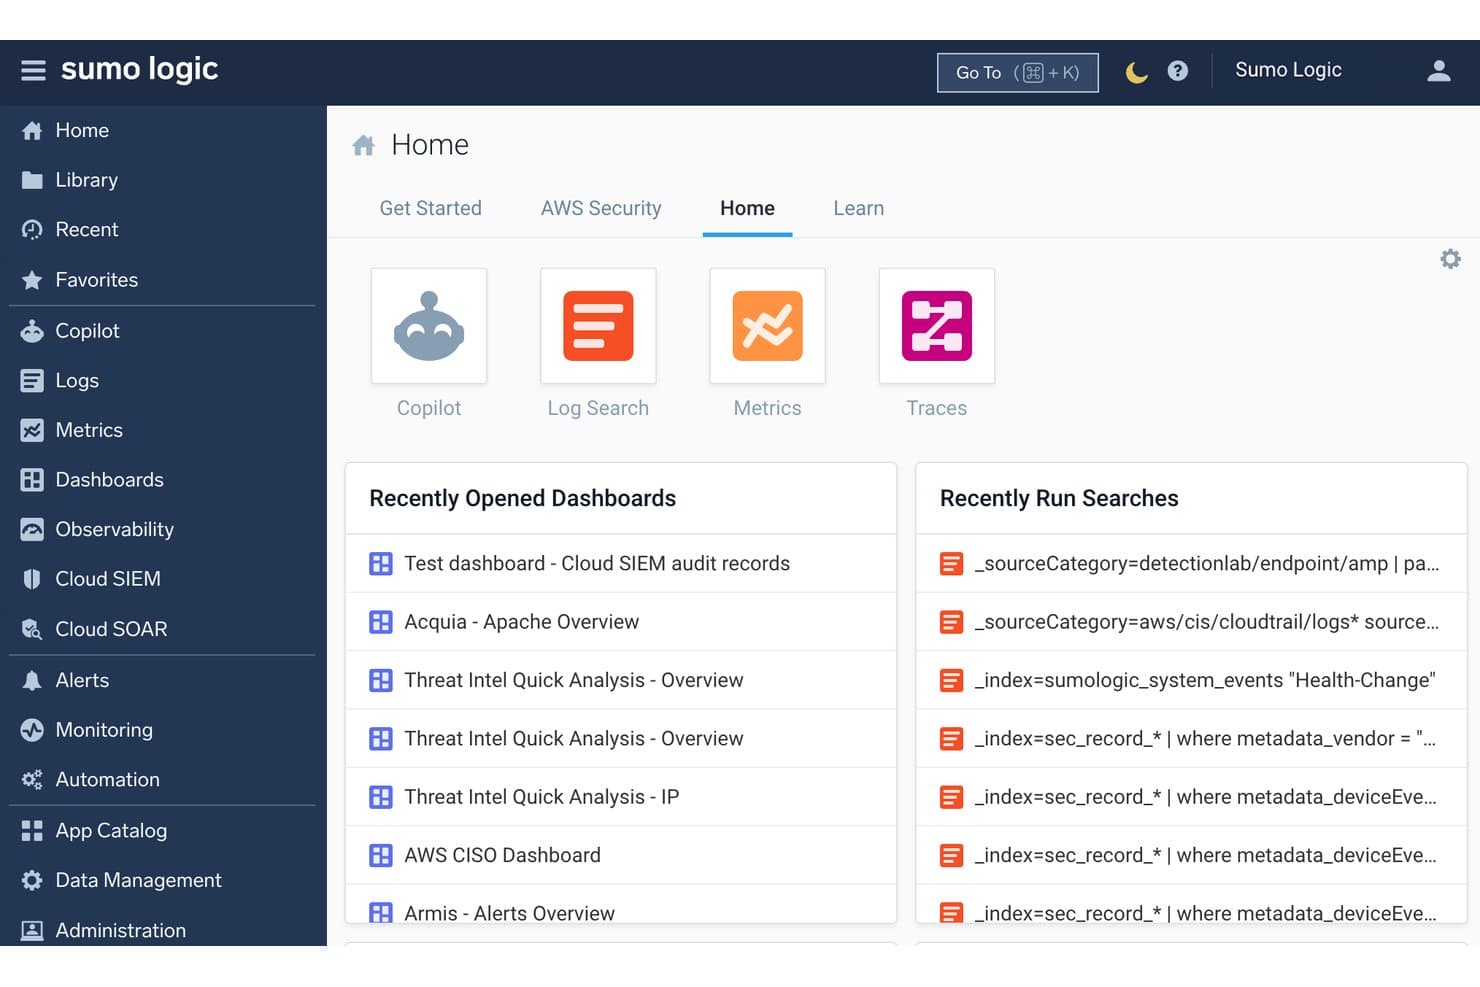
Sumo Logic gives teams quick access to log search, metrics, and recent activity. Sumo Logic is a cloud-native IT operations management platform that unifies log analytics, infrastructure monitoring, metrics, distributed tracing, and security operations into a single SaaS-based observability and SIEM solution.
Who Is Sumo Logic Best For?
Sumo Logic is a strong fit for security-conscious IT and operations teams that need log analytics, metrics, and SIEM capabilities in a single SaaS platform.
Why I Picked Sumo Logic
Sumo Logic earns its spot on my shortlist because it's one of the few platforms that collapses log analytics and security operations into a single, genuinely unified SaaS tool. I like how its patented LogReduce and LogExplain operators surface root causes directly from raw log data, cutting the manual pattern-hunting that slows incident resolution. The Dojo AI multi-agent platform also stands out: the SOC Analyst Agent automates tier-1 alert triage and delivers evidence-backed verdicts, which my team finds invaluable when SecOps and ITOps workflows overlap.
Sumo Logic Key Features
- AI-driven metrics monitors: ML-based anomaly detection auto-tunes seasonal baselines on your metrics data, cutting false-positive alert volume.
- Multi-org management: A parent org controls monitors, dashboards, roles, and access across child organizations from a single centralized interface.
- Compliance reporting dashboards: Prebuilt dashboards map your data against PCI, HIPAA, GDPR, SOX, and ISO frameworks for continuous posture visibility.
- OpenTelemetry Distribution Agent: A single unified agent collects logs, metrics, and traces across Linux, Windows, macOS, and 25+ source configurations.
Sumo Logic Integrations
Sumo Logic offers 450+ integrations, including ServiceNow, PagerDuty, Jira, Slack, Microsoft Teams, AWS, Microsoft Azure, Google Cloud Platform, Kubernetes, and Docker. It also provides REST APIs, webhooks, Terraform, SumoQL, and an Open Integration Framework for custom connectivity.
Pros and Cons
Pros:
- Centralizes logs, metrics, and traces in one platform
- Compliance dashboards map directly to major frameworks
- Dojo AI automates incident triage and resolution
Cons:
- Querying large historical data sets can be slow
- Advanced automation favors security over IT operations
 Best for OTel-native full-stack ops visibility
- 7-day free trial
- From $0.07/GB
Visit WebsiteCustomer Rating:4.3/5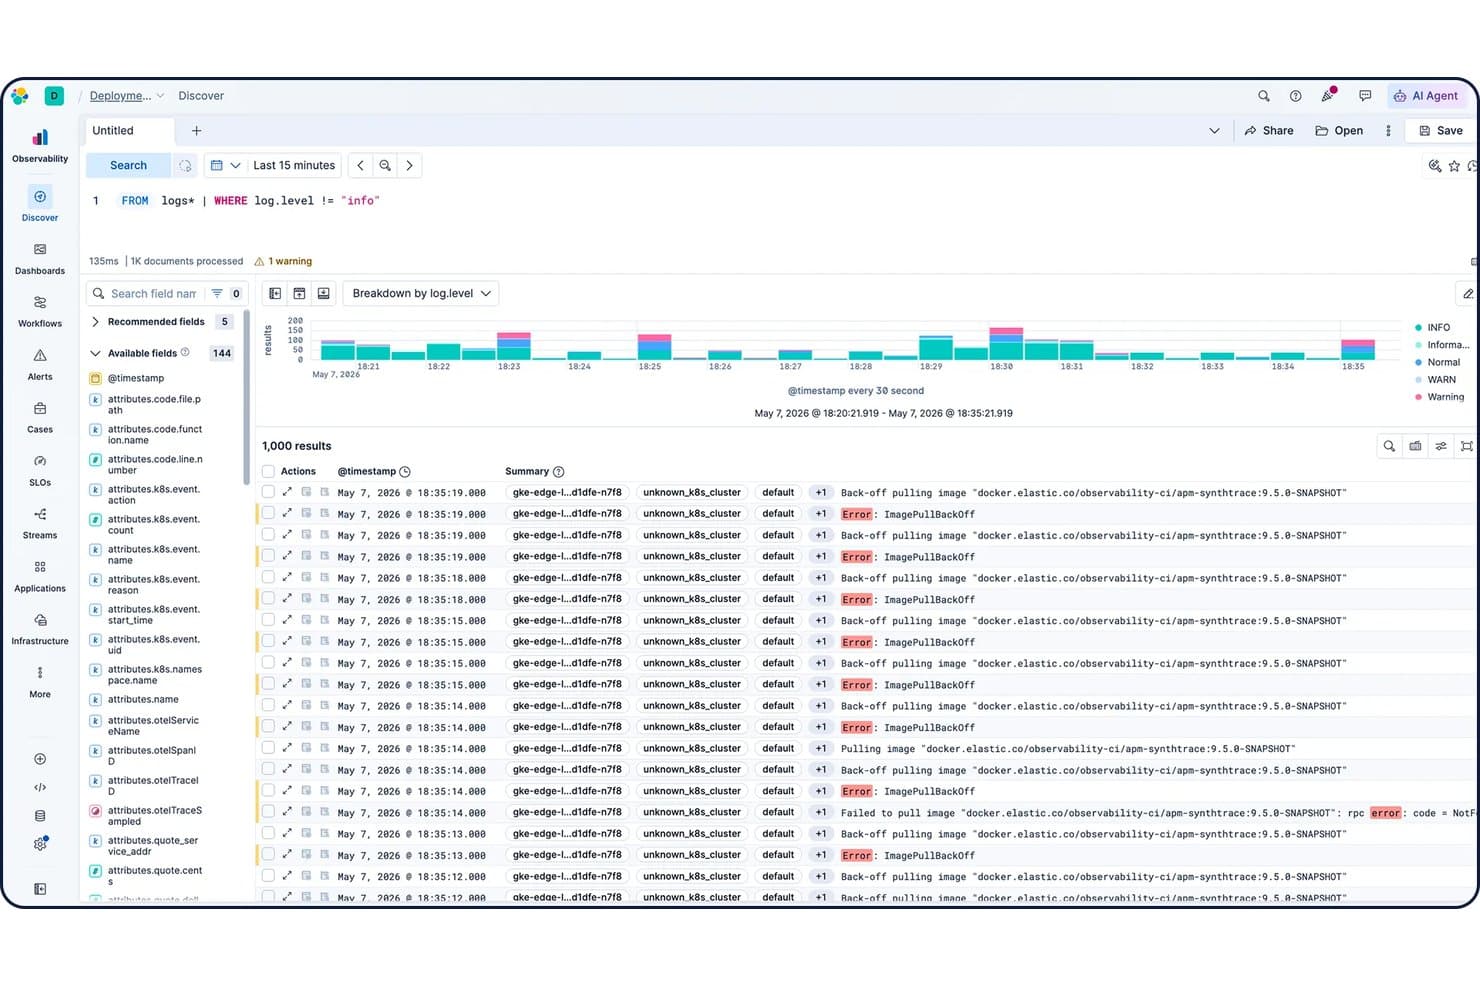
Elastic Observability filters logs by level in the Discover view. Elastic Observability is a full-stack observability platform that unifies log monitoring, infrastructure metrics, APM, distributed tracing, synthetic monitoring, and AIOps across on-premises, cloud, and hybrid environments.
Who Is Elastic Observability Best For?
Elastic Observability is a strong fit for SREs and infrastructure engineers at mid-to-large enterprises who need unified log, metric, trace, and APM visibility across hybrid and multi-cloud environments—especially teams already invested in OpenTelemetry.
Why I Picked Elastic Observability
Elastic Observability earns its spot on my shortlist because it's one of the few platforms built OpenTelemetry-first, meaning your logs, metrics, traces, and APM data all land in a single schema without forcing you to wrestle with proprietary agents. I particularly like the zero-config ML layer: 100+ preconfigured anomaly detection jobs run automatically across every data stream, so when Comcast-scale ingestion happens, your team isn't manually tuning models. The Streams-based log parsing and ES|QL query engine make pinpointing root causes across hybrid environments genuinely fast.
Elastic Observability Key Features
- Synthetic monitoring: Run lightweight and full browser tests against user journeys using a global managed testing infrastructure or private on-premises locations.
- Service Level Objective (SLO) tracking: Define, monitor, and report on reliability targets directly within Kibana alongside your existing dashboards and alerts.
- Kibana alerting: Configure rule-based alerts across APM, metrics, uptime, and security data using form-based setup with multi-channel notification support.
- 550+ prebuilt integrations: Connect to cloud providers, ITSM tools, security platforms, and data sources using prebuilt agents and agentless collectors.
Elastic Observability Integrations
Elastic Observability offers 550+ prebuilt integrations, including AWS, Microsoft Azure, Google Cloud Platform, ServiceNow, Jira, PagerDuty, Slack, Microsoft Teams, Kubernetes, and OpenTelemetry. It also supports REST APIs, webhooks, Elastic Agent, Logstash, Beats, and OpenTelemetry collectors for custom connectivity.
Pros and Cons
Pros:
- OTel-native ingestion avoids vendor lock-in
- Zero-config ML detects anomalies automatically
- Unified visibility across hybrid and multi-cloud
Cons:
- Documentation lacking for complex OTel setups
- Native on-call scheduling is not included
Learn more about Elastic Observability: Best for MSP-grade multi-tenant hybrid ITOps
- Free demo available
- Pricing upon request
Visit WebsiteCustomer Rating:4.1/5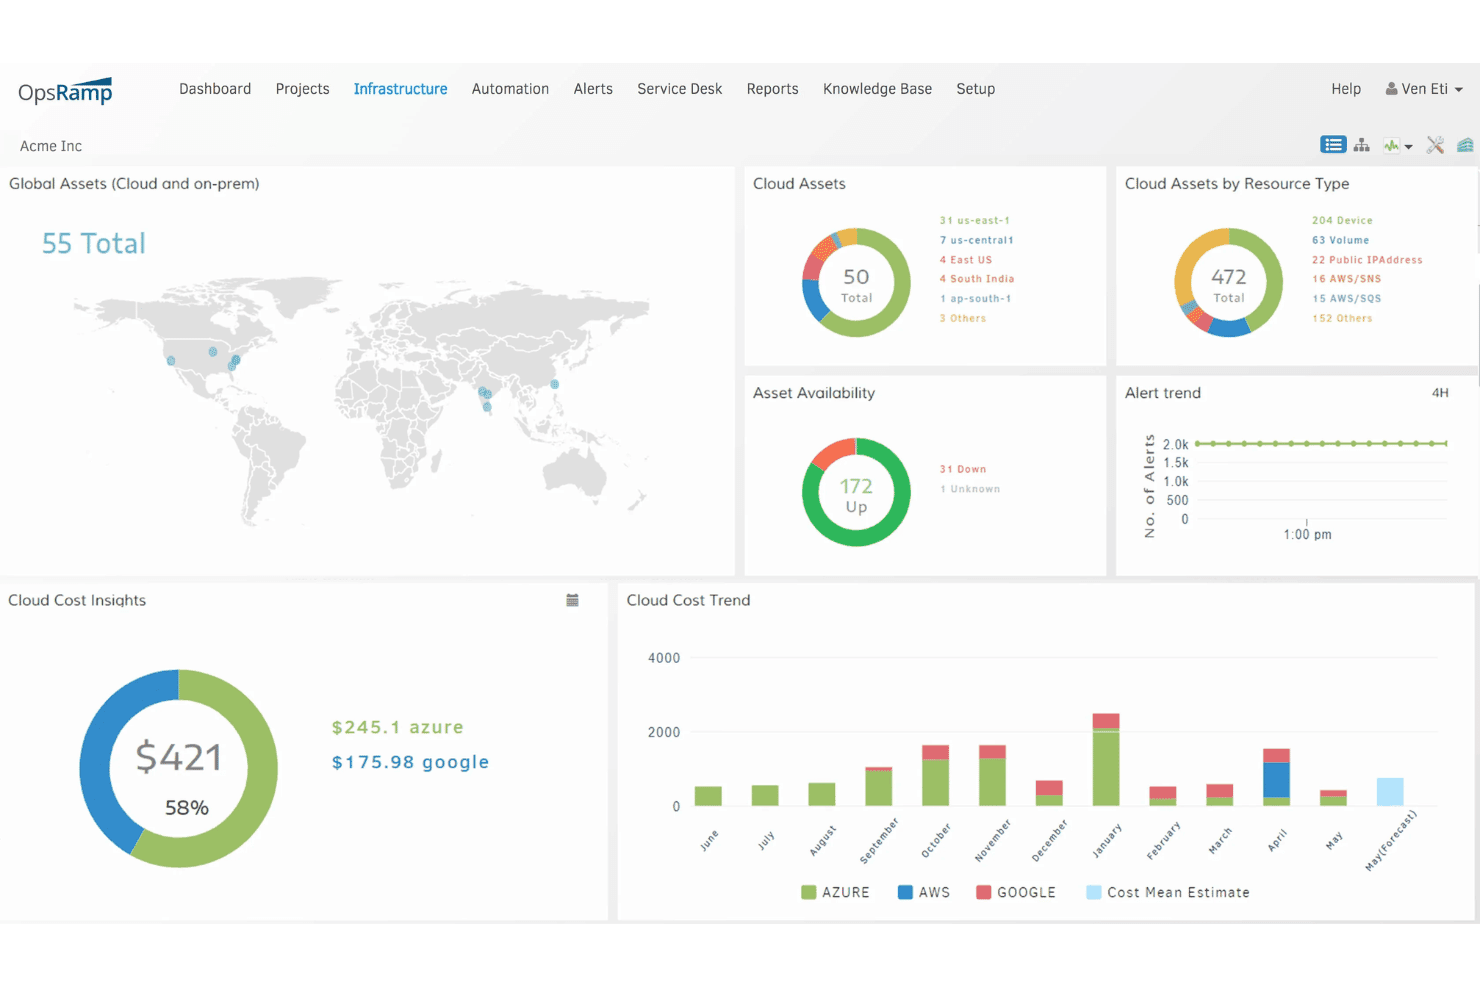
OpsRamp gives users a unified view of cloud costs, assets, and alerts. HPE OpsRamp is an AIOps-driven IT operations management platform that unifies infrastructure monitoring, event correlation, incident management, runbook automation, and hybrid/multi-cloud visibility across on-premises, private cloud, and public cloud environments.
Who Is OpsRamp Best For?
OpsRamp is a strong fit for managed service providers and large enterprises running complex hybrid IT estates across on-premises and multi-cloud environments.
Why I Picked OpsRamp
OpsRamp earns its spot on my shortlist because its multi-tenant architecture is purpose-built for MSPs managing dozens of client environments from a single pane of glass. I particularly like its AIOps event correlation engine, which groups related alerts across tenants and cuts noise by up to 90%, so your team isn't drowning in tickets across client accounts. Its topology and service maps give you a live dependency view across hybrid estates spanning AWS, Azure, GCP, and on-prem, which is genuinely hard to replicate at that scale.
OpsRamp Key Features
- Runbook automation engine: Execute predefined remediation scripts automatically in response to detected issues, with RBAC-governed access to jobs and process workflows.
- Multi-tenant client management: Manage multiple client environments from a single platform instance, with per-tenant integration configuration and isolated data handling.
- Cloud cost reporting: Break down cloud spend by account, region, service, and instance type across AWS, Azure, and GCP with customizable date ranges.
- OpenTelemetry intake: Ingest metrics, logs, and traces from any OpenTelemetry-compatible source alongside eBPF-assisted auto-instrumentation for deep workload visibility.
OpsRamp Integrations
OpsRamp offers 3,000+ integrations, including ServiceNow, Jira Service Management, Zendesk, AWS, Microsoft Azure, Google Cloud Platform, Kubernetes, OpenTelemetry, and Prometheus. Its OAuth 2.0 REST API, webhooks, and JSON import/export support custom connections.
Pros and Cons
Pros:
- Hybrid and multi-cloud topology visualizations
- Up to 90 percent alert noise reduction
- Multi-tenant management for MSP client environments
Cons:
- Dashboard performance can lag at large scale
- Application monitoring features still maturing
Learn more about OpsRamp: Best for AI-driven alert-to-topology root cause ops
- 15-day free trial + free demo available
- From $19/month
Visit WebsiteCustomer Rating:4.5/5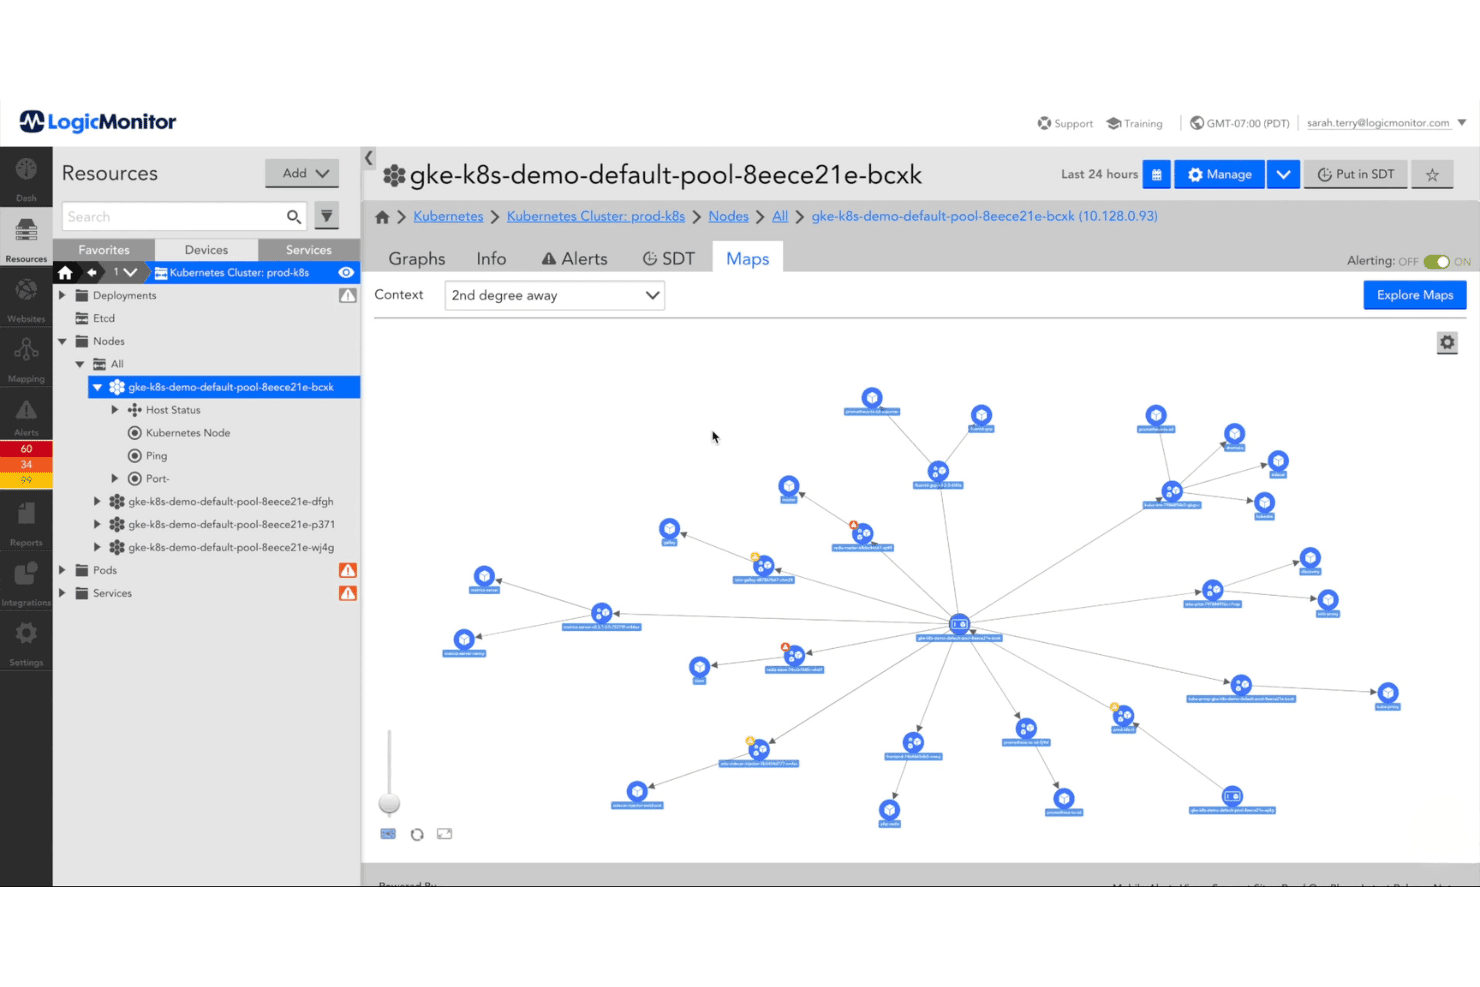
LogicMonitor maps Kubernetes node relationships with interactive network topology views. LogicMonitor is a full-stack IT operations management platform that covers infrastructure, network, cloud, container, and application monitoring alongside AIOps-driven alert correlation, topology mapping, and log analytics in a single unified platform.
Who Is LogicMonitor Best For?
LogicMonitor is a strong fit for infrastructure and network operations teams managing large, hybrid environments across on-premises and multi-cloud.
Why I Picked LogicMonitor
LogicMonitor earns its spot on my shortlist because of how tightly it connects alert correlation to topology-aware root cause analysis. Edwin AI compresses alert storms into prioritized, explainable incidents, and the ITOps Context Graph layers topology, telemetry, and change data together so you can pinpoint a probable root cause in minutes rather than hours. I've seen teams cut alert noise by 78% after deploying Edwin AI, which means on-call engineers spend less time triaging noise and more time resolving the actual issue.
LogicMonitor Key Features
- Full-stack infrastructure monitoring: Tracks servers, network devices, VMs, databases, storage, and containers across hybrid environments from a single platform.
- LM Exchange: Gives you access to over 2,000 pre-built LogicModules covering cloud providers, networking gear, databases, and applications.
- Log Analytics & Intelligence: Correlates log data with metrics in real time so you can investigate incidents without switching tools.
- Bidirectional ITSM integrations: Syncs alert and ticket lifecycles with ServiceNow, Jira Service Management, PagerDuty, ConnectWise, and Autotask.
LogicMonitor Integrations
LogicMonitor offers 2,000+ marketplace integrations through LM Exchange, plus native integrations with ServiceNow, Jira Service Management, PagerDuty, ConnectWise, and Datto Autotask. A documented REST API supports custom integrations.
Pros and Cons
Pros:
- Customizable dashboards for various IT roles
- Maps topology for fast root cause analysis
- Reduces alert noise with Edwin AI
Cons:
- Interface changes make navigation challenging
- Pricing structure is difficult to understand
Learn more about LogicMonitor: Best for transaction-level full-stack observability
- Free plan available
- From $10/user/month
Visit WebsiteCustomer Rating:4.3/5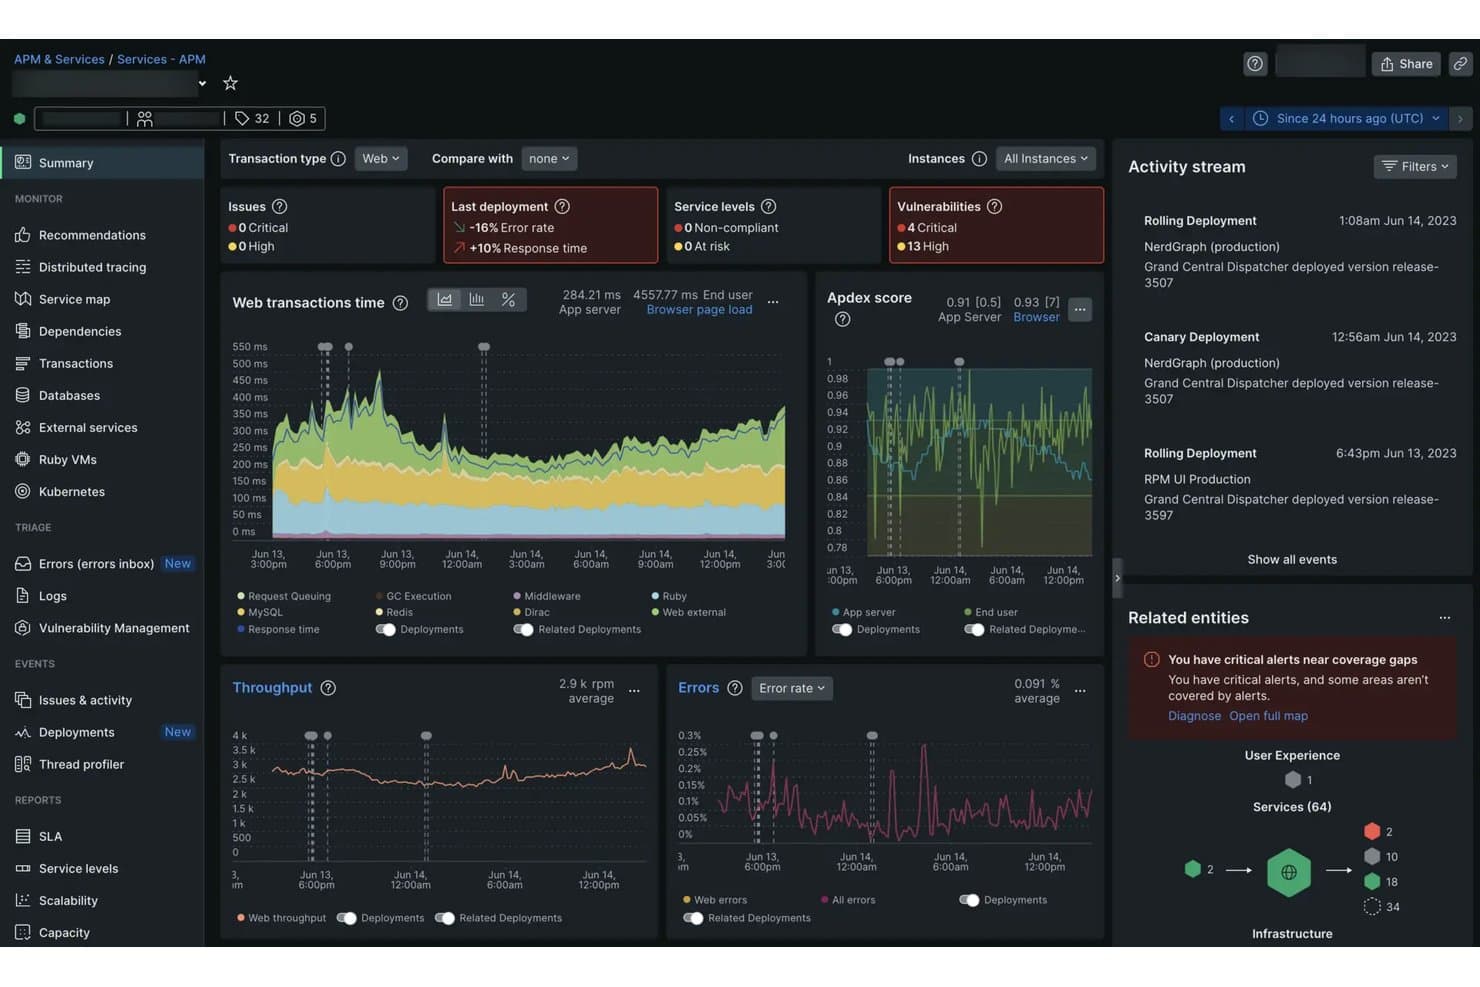
New Relic provides a full APM summary with performance metrics. New Relic is a full-stack observability platform that unifies metrics, logs, traces, and digital experience data across infrastructure, applications, cloud environments, and networks in a single interface.
Who Is New Relic Best For?
New Relic is a strong fit for SREs and infrastructure engineers managing complex, high-traffic production environments where transaction-level visibility across the full stack is non-negotiable.
Why I Picked New Relic
New Relic earns its spot on my shortlist because of Transaction 360, which correlates telemetry, alerts, and deployment changes at the individual transaction level and cuts MTTR by up to 5x. I also like how Autopilot agents autonomously investigate incidents using live telemetry and runbooks, then surface transparent, auditable reasoning rather than just firing off a remediation action. That combination of transaction-level tracing and agentic incident resolution is what makes New Relic my go-to for full-stack observability.
New Relic Key Features
- Smart Alerts: Dynamic threshold tuning uses historical volatility to minimize false positives and automatically routes alerts to the right team using entity tags.
- Cloud Cost Intelligence: Real-time cost tracking across AWS, Azure, GCP, and Kubernetes, with right-sizing recommendations tied to actual usage patterns and budget threshold alerts.
- Workflow Automation: A no-code, drag-and-drop canvas lets you build multi-step remediation workflows with conditional logic, loops, and live NRQL queries.
- Federated Logs: Query logs directly from S3 buckets without re-ingestion or data movement, supporting data residency and compliance requirements.
New Relic Integrations
New Relic offers 800+ pre-built integrations, including ServiceNow, Jira, PagerDuty, Slack, Microsoft Teams, AWS, Azure, Google Cloud Platform, Kubernetes, and VMware. NerdGraph, REST API, webhooks, OpenTelemetry, and Prometheus support custom connectivity.
Pros and Cons
Pros:
- Transparent AI-driven incident investigation
- Automates alert routing using entity tags
- Correlates metrics, logs, and traces instantly
Cons:
- Extended data retention needs paid upgrade
- Consumption-based pricing can escalate quickly
Learn more about New Relic: Best for CMDB-anchored hybrid IT ops at scale
- Free demo available
- Pricing upon request
Visit WebsiteCustomer Rating:4.4/5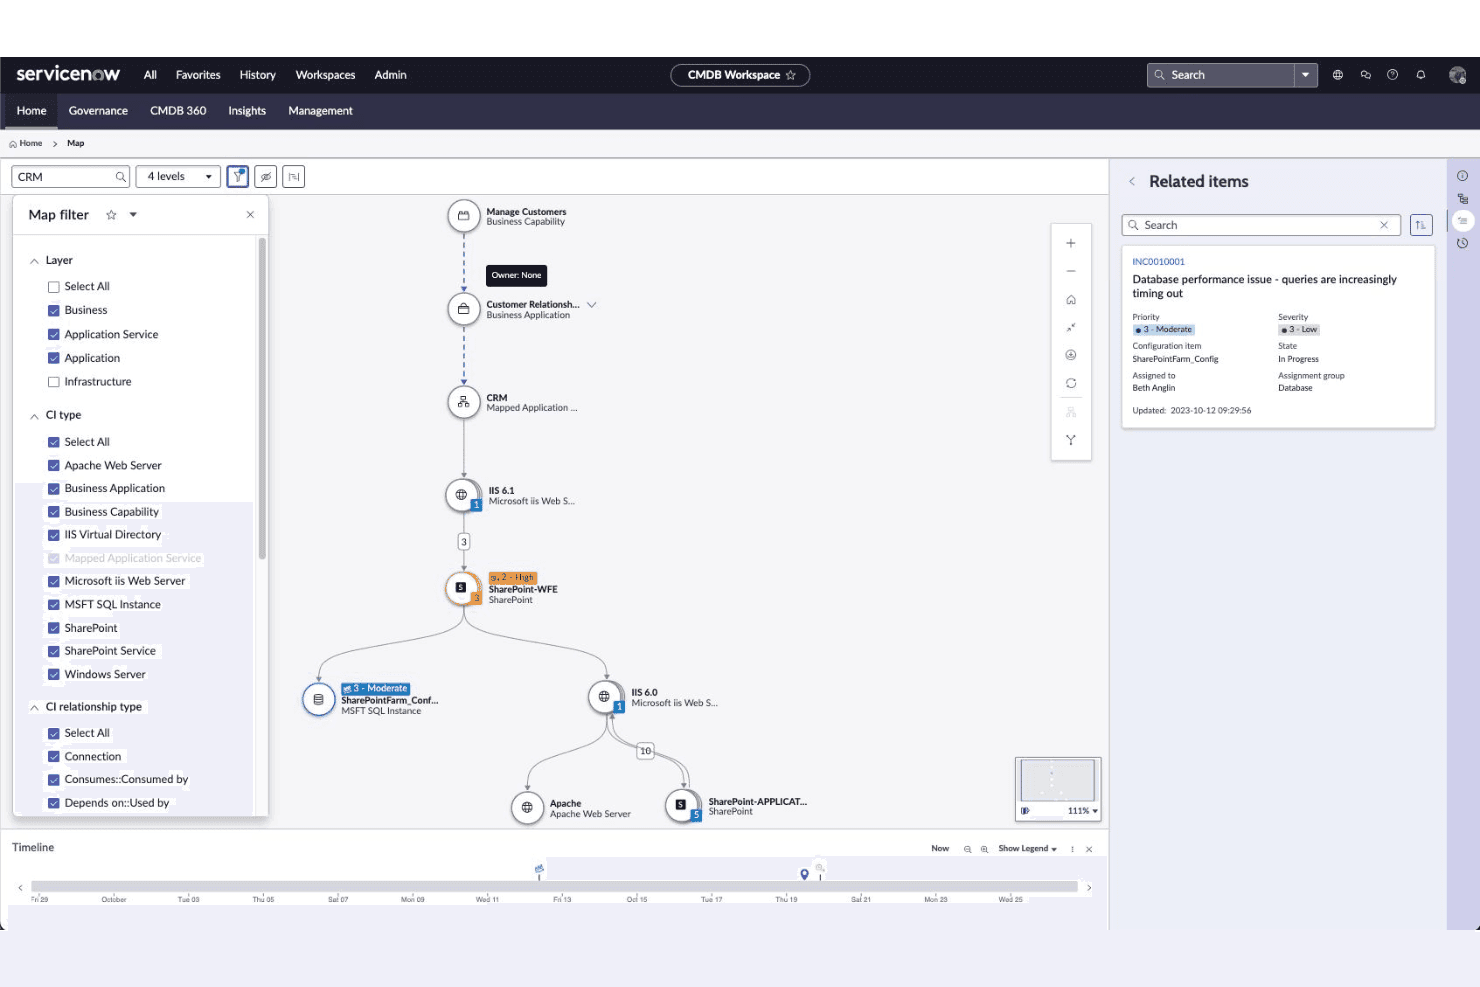
ServiceNow ITOM maps CRM app dependencies across infrastructure layers. ServiceNow ITOM is an enterprise IT operations management platform built around a continuously updated CMDB, offering agentless discovery, AIOps-powered event management, service mapping, cloud visibility, and automated orchestration across hybrid and multi-cloud environments.
Who Is ServiceNow ITOM Best For?
ServiceNow ITOM is built for large enterprises running complex hybrid IT estates where a continuously updated CMDB is the operational backbone.
Why I Picked ServiceNow ITOM
ServiceNow ITOM earns its spot on my shortlist because the CMDB isn't just a database here—it's the live operational backbone that Discovery and Service Graph Connectors continuously feed with real data from across your hybrid estate. I particularly like how Service Mapping automatically builds dependency visualizations between infrastructure and business services, so when an AWS instance degrades, you can see exactly which services are impacted before users notice. AIOps LEAP takes it further by mining closed incidents to generate and deploy automated remediation playbooks, complete with an ROI dashboard tracking what's actually been saved.
ServiceNow ITOM Key Features
- Health Log Analytics: Uses AI to analyze log data in real time, flagging anomalies and surfacing remediation recommendations before issues escalate.
- Synthetic Monitoring: Simulates end-user transactions to detect availability and performance problems before real users are affected.
- Cloud Accelerate: Automates cloud resource provisioning and deprovisioning while enforcing tagging, cost, and security policies across AWS, Azure, and GCP.
- Certificate Management: Automatically discovers and tracks TLS/PKI certificates across your environment and triggers renewal workflows before expiration.
ServiceNow ITOM Integrations
ServiceNow ITOM integrates with AWS, Microsoft Azure, Google Cloud Platform, Alibaba Cloud, Datadog, Dynatrace, Splunk, PagerDuty, Jenkins, and GitHub. REST and SOAP APIs, webhooks, and ServiceNow Store integrations support custom connectivity.
Pros and Cons
Pros:
- Multi-cloud discovery spans AWS, Azure, GCP
- GenAI automates incident triage and remediation
- CMDB drives real-time operations visibility
Cons:
- Advanced features require separate module licensing
- SaaS-only with no self-hosted option
Learn more about ServiceNow ITOM: Best for Cisco-native cross-domain service health ops
- Free demo available
- Pricing upon request
Visit WebsiteCustomer Rating:4.9/5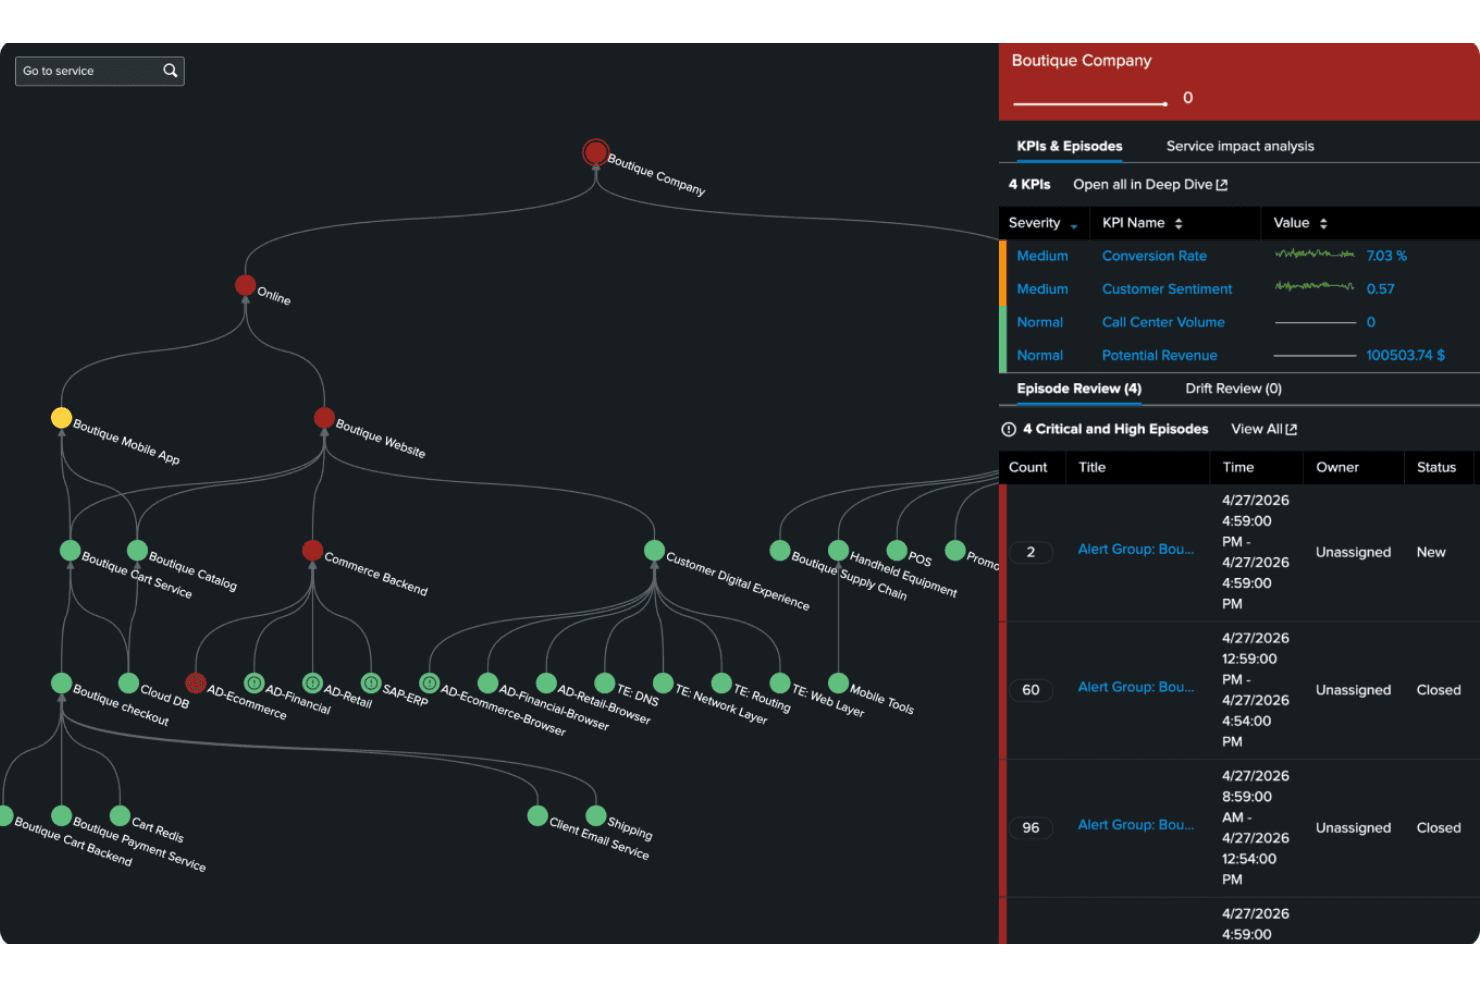
Splunk ITSI visualizes service health and episodes in a dependency map. Splunk IT Service Intelligence (ITSI) is an AIOps-driven IT operations management platform that delivers KPI-based service health scoring, AI-powered alert correlation, topology mapping, and cross-domain visibility across infrastructure, applications, and networks.
Who Is Splunk IT Service Intelligence Best For?
Splunk ITSI is a strong fit for enterprise IT operations teams—particularly those already running Splunk or operating within Cisco environments—who need to correlate service health across infrastructure, applications, and networks at scale.
Why I Picked Splunk IT Service Intelligence
Splunk ITSI earns its spot on my shortlist because of how it handles cross-domain service health in Cisco-native environments. I love that it pulls signals from Cisco ThousandEyes, Meraki, and Catalyst Center directly into its KPI-based health scoring model, so network-to-application visibility isn't stitched together manually. Its Event iQ engine then correlates those signals into consolidated episodes, cutting through alert noise before your team wastes time on duplicates.
Splunk IT Service Intelligence Key Features
- Glass Tables: Build pixel-perfect, drag-and-drop dashboards that map live service health scores to business KPIs like SLA attainment or revenue impact.
- Adaptive thresholding: ML models baseline each KPI's normal behavior over time, triggering alerts on statistical deviations rather than fixed thresholds.
- Episode Review workspace: A centralized triage interface where AI-correlated alert groups surface with severity scoring, impacted service context, and recommended next steps.
- Service dependency modeling: Define and visualize hierarchical relationships between business services, sub-services, hosts, and network devices to isolate root causes faster.
Splunk IT Service Intelligence Integrations
Splunk IT Service Intelligence integrates with ServiceNow, PagerDuty, Jira Cloud, Cisco ThousandEyes, Cisco Catalyst Center, Cisco Meraki, Splunk Observability Cloud, AppDynamics, and Red Hat Ansible Automation Platform. It also offers Splunkbase marketplace integrations, REST API access, Python SDKs, webhooks, and Kafka.
Pros and Cons
Pros:
- Highly customizable dashboards for business metrics
- Unified cross-domain monitoring for Cisco environments
- Advanced AI-driven alert correlation and triage
Cons:
- Implementation complexity for service and entity modeling
- High resource requirements for large deployments
Learn more about Splunk IT Service Intelligence: Best for agentic AI across mainframe-to-cloud ops
- Free demo available
- Pricing upon request
Visit WebsiteCustomer Rating:4/5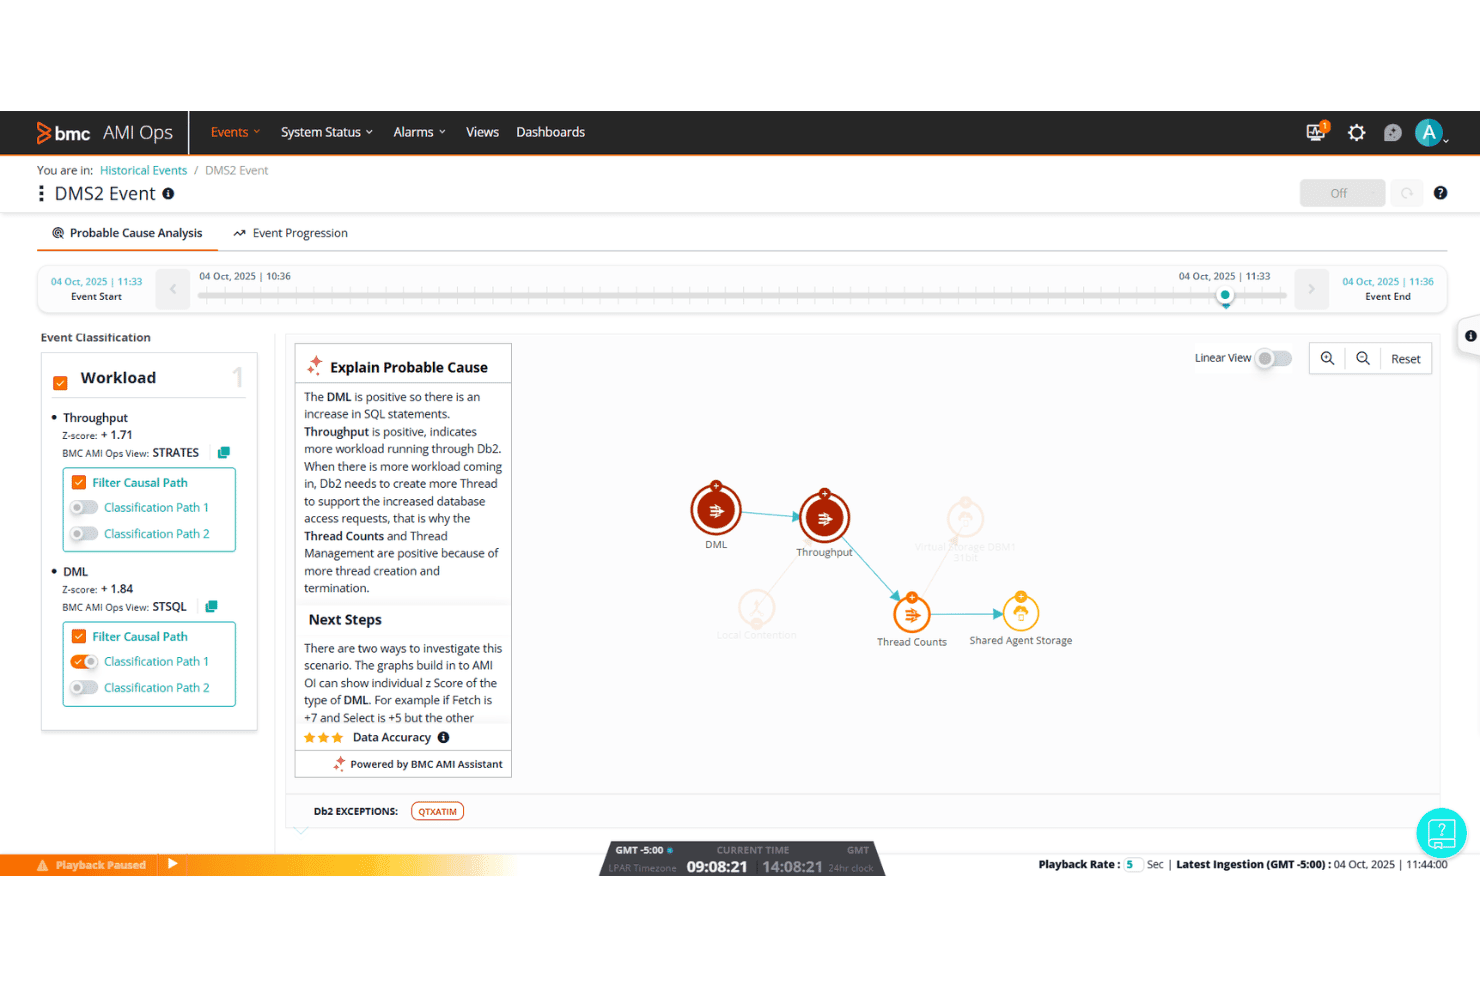
BMC Helix AIOps explains probable causes with AI-driven event analysis. BMC Helix AIOps is a cloud-native IT operations management platform that unifies event monitoring, AI-driven incident correlation, automated remediation, and topology mapping across on-premises, cloud, and mainframe environments.
Who Is BMC Helix AIOps Best For?
BMC Helix AIOps is built for large enterprises running complex hybrid environments that span mainframe systems, on-premises infrastructure, and multiple public clouds.
Why I Picked BMC Helix AIOps
BMC Helix AIOps earns its spot on my shortlist because it's one of the only platforms I've seen that genuinely spans mainframe-to-cloud without treating either end as an afterthought. I rely on HelixGPT's agentic AI capabilities, specifically the Agent Builder and Ops Swarmer, to handle autonomous incident triage across z/OS environments and Kubernetes clusters in the same workflow. The AI-driven situation correlation cuts alert noise by up to 90%, which in practice means my team isn't drowning in duplicate alerts across 600 dashboards.
BMC Helix AIOps Key Features
- Probable cause analysis: AI correlates topology and event data to identify the most likely root cause of a situation before manual investigation begins.
- HelixGPT Post Mortem Analyzer: Automatically generates detailed post-incident review summaries to support SRE and ops teams after resolution.
- Dynamic service blueprinting: Integrates with BMC Helix Discovery to auto-generate and continuously update service models that map dependencies across your hybrid environment.
- Role-based dashboard views: Segments operational data and reporting by role, giving each team member a filtered view of the metrics and events relevant to their function.
BMC Helix AIOps Integrations
BMC Helix AIOps integrates with BMC Helix ITSM, ServiceNow, AWS, Azure, Google Cloud Platform, Microsoft Teams, Slack, BMC Helix Discovery, and Jitterbit. It also supports REST APIs, CMDB connectivity, third-party monitoring tools, and AWS Marketplace deployment.
Pros and Cons
Pros:
- Automated topology and dependency mapping included
- AI-driven alert noise reduction up to 90%
- Native mainframe and hybrid cloud monitoring
Cons:
- Dashboard customization less intuitive than competitors
- Configuration requires significant technical expertise
Learn more about BMC Helix AIOps:
Outro software de gestão de operações de TI
Eis algumas opções adicionais de software de gestão de operações de TI que não entraram na minha seleção, mas que ainda vale a pena consultar:
- 11VirtanaBest for deep storage and GPU ops visibility
- 12ManageEngine OpManagerBest for no-code fault-to-fix workflow automation
- 13BigPandaBest for AI-driven change risk scoring
- 14PagerDutyBest for on-call incident response at scale
- 15ZabbixBest for open-source ops monitoring at any scale
- 16MoogsoftBest for ML-driven alert noise reduction
- 17CheckmkBest for service-based pricing across hybrid infra
- 18Ivanti NeuronsBest for ITSM-anchored IT and SecOps automation
- 19Grafana CloudBest for ML-guided full-stack ops observability
- 20SolarWinds Observability SaaSBest for NetOps-rooted full-stack observability
How I Evaluate IT Operations Management Software
When an alert storm hits at 2 a.m. and your team needs to trace a degraded API back to a misconfigured container in a hybrid cluster, the tools either hold up or they don't—so I split my evaluation into baseline functionality every platform must cover and the differentiators that separate good from great.
Core Functionality (Table Stakes For This List)
When I'm selecting tools for my list, I rank each one on a scale from 0 (does not offer the functionality) to 5 (excels in this area) for each core functionality listed below. I then calculate the tool's total score into a percentage, using 75% as a benchmark to help assess its overall fit for the list.
- Infrastructure & App Monitoring: I check whether the platform covers servers, networks, apps, and cloud resources with real-time metrics, logs, and traces.
- Alerting & Incident Management: Each tool's alert correlation, escalation policies, and incident workflows matter—especially how well it cuts through noise during an outage.
- IT Automation & Orchestration: I look for visual workflow builders, auto-remediation playbooks, and cross-platform runbooks that reduce manual toil on recurring tasks.
- Hybrid & Multi-Cloud Visibility: Unified dashboards across on-prem, AWS, Azure, and GCP are table stakes—I evaluate topology mapping and dynamic discovery depth.
- Reporting & Analytics Dashboards: Customizable dashboards with drill-downs, SLA/SLO tracking, and capacity forecasting tell me how well a tool supports planning conversations.
- Integrations & API Access: I evaluate prebuilt connectors to ITSM, DevOps, and chatops tools, plus REST API coverage for teams that need to build custom workflows.
Once I have a list of tools that meet the criteria, I consider what sets each platform apart.
Differentiating Factors (What Sets Vendors Apart)
Here's how I compare and contrast different vendors:
Standout Features
I evaluate how well each platform's AIOps engine baselines normal behavior and correlates related events into a single incident—during a noisy outage, the difference between 200 alerts and one actionable incident is hours of recovery time. Topology and dependency mapping matters just as much: I check whether the tool auto-discovers relationships across containers, hosts, and network paths so you can trace a failing checkout API back to an undersized pod without switching screens. I also look at built-in cloud cost visibility, since platforms like Datadog and Dynatrace now tie resource utilization directly to spend, helping you spot idle workloads before finance does.
Beyond Features
I evaluate total cost of ownership closely because ingestion-based pricing can spiral fast—adding custom metrics or doubling log volume in platforms like Datadog or New Relic often triggers surprise overages that dwarf the original quote. Deployment flexibility matters just as much; I check whether a vendor offers SaaS, self-hosted, and air-gapped options, since regulated industries frequently need on-prem control that pure-SaaS tools can't deliver. I also look at ecosystem depth, specifically bidirectional ITSM integrations and open API coverage, so operations data flows into existing DevOps and ChatOps workflows without custom glue code.
Como escolher software de gestão de operações de TI
Ao decidir qual é o software de gestão de operações de TI mais adequado ao seu ambiente, comece por se concentrar nos seus desafios operacionais mais prementes:
| Se a sua prioridade for... | Procure... |
|---|---|
| Se a sua prioridade for...Análise rápida e precisa da causa-raiz | Procure...Correlação de incidentes baseada em IA e procedimentos operacionais automatizados |
| Se a sua prioridade for...Ambientes híbridos e multinuvem | Procure...Conectores nativos para ambientes locais, AWS, Azure e GCP |
| Se a sua prioridade for...Reduzir as tarefas manuais de resolução | Procure...Construtores visuais de fluxos de trabalho com automatização pré-configurada |
| Se a sua prioridade for...Controlar os custos relacionados com a monitorização | Procure...Preços transparentes baseados na utilização e painéis de custos |
| Se a sua prioridade for...Integrações aprofundadas com ferramentas de gestão de serviços de TI | Procure...Conectores pré-configurados e documentação de API aberta |
Como avaliar a sua seleção
- Teste os fluxos de triagem de incidentes: Faça um teste de 48 horas e simule pelo menos três tipos de interrupção para verificar o agrupamento de incidentes e as respostas automatizadas.
- Solicite uma demonstração do mapa de topologia: Peça ao fornecedor que gere um mapa de dependências completo — incluindo clusters híbridos — utilizando dados de exemplo reais ou anonimizados.
- Abra um pedido de suporte entre plataformas: Abra um pedido de suporte referente a uma integração multinuvem e registe a precisão das respostas e os SLA durante um período de 3 dias.
- Avalie a completude dos relatórios: Analise ou exporte um painel de análise de exemplo e confirme a visibilidade dos custos, dos SLA e das métricas personalizadas da sua infraestrutura real.
- Agilidade do SaaS vs. controlo da infraestrutura própria: Decida se a disponibilização rápida de funcionalidades no SaaS se sobrepõe às necessidades de conformidade e acesso satisfeitas por implementações locais ou isoladas.
O que é o software de gestão de operações de TI?
O software de gestão de operações de TI é uma categoria de ferramentas concebidas para monitorizar, automatizar e gerir infraestruturas de TI, aplicações, redes e serviços em ambientes locais e na nuvem. Estas plataformas ajudam a sua equipa a centralizar alertas, manter o estado dos sistemas, gerir incidentes e otimizar a utilização de recursos. Ao consolidar os dados de operações e a automatização, o software de gestão de operações de TI permite resolver problemas mais rapidamente, promove a eficiência e permite à sua organização expandir a tecnologia de forma fiável.
Funcionalidades do software de gestão de operações de TI
Ao selecionar software de gestão de operações de TI, procure as seguintes funcionalidades principais:
- Monitorização de infraestruturas e aplicações: Monitoriza servidores, redes, contentores e aplicações em tempo real. Ajuda a detetar comportamentos anormais do sistema, degradação do desempenho ou interrupções antes de afetarem os utilizadores.
- Alertas e gestão de incidentes: Centraliza os alertas e simplifica os fluxos de trabalho de escalamento. Permite à sua equipa responder rapidamente, contextualizar os incidentes e acompanhar a resolução do início ao fim.
- Automatização e orquestração: Disponibiliza ferramentas para automatizar tarefas de rotina e coordenar fluxos de trabalho em diferentes ambientes. Reduz o esforço manual e minimiza o erro humano durante implementações ou operações de manutenção.
- Suporte para ambientes híbridos e multicloud: Oferece visibilidade unificada em infraestruturas locais, nuvens privadas e nuvens públicas. Ajuda a gerir ambientes complexos como uma única entidade operacional.
- Painéis de controlo e relatórios personalizáveis: Permite criar painéis de controlo e relatórios adaptados às suas necessidades. Suporta a análise de tendências, a monitorização de SLA e a partilha de informações com partes interessadas técnicas e empresariais.
- Integração e acesso à API: Liga-se a plataformas de ITSM, DevOps e colaboração. Permite à sua equipa incorporar diretamente os dados das operações de TI em sistemas de emissão de pedidos, conversação e outros.
- Mapeamento da topologia e das dependências: Apresenta visualmente as relações entre sistemas, serviços e componentes da infraestrutura. Facilita a identificação da causa principal dos incidentes e a compreensão do risco operacional.
- Controlo de acesso baseado em utilizadores e funções: Permite definir quem pode visualizar ou editar partes do seu ambiente. Protege dados sensíveis e limita a exposição com base nas responsabilidades dos utilizadores.
- Planeamento e previsão da capacidade: Analisa as tendências de consumo de recursos para prever necessidades futuras. Ajuda a antecipar atualizações da infraestrutura e a orçamentar o crescimento.
- Acompanhamento de alterações e registos de auditoria: Regista alterações de configuração e ações dos utilizadores. Suporta requisitos de conformidade e ajuda a resolver incidentes anteriores, fornecendo um histórico claro das alterações.
Funcionalidades comuns de IA do software de gestão de operações de TI
Para além das funcionalidades padrão do software de gestão de operações de TI indicadas acima, muitas destas soluções estão a incorporar IA com funcionalidades como:
- Deteção de anomalias orientada por IA: Utiliza aprendizagem automática para identificar automaticamente padrões ou comportamentos invulgares nas métricas, nos registos ou no tráfego de rede do sistema. Isto ajuda a sua equipa a detetar problemas emergentes antes de estes se agravarem, mesmo quando os limiares não foram definidos manualmente.
- Análise automatizada da causa principal: Aplica algoritmos de IA para correlacionar eventos, registos e dados de desempenho em toda a sua pilha tecnológica. Esta funcionalidade identifica a provável origem dos incidentes, reduzindo o tempo que a sua equipa dedica à investigação e acelerando a recuperação.
- Previsão de incidentes: Utiliza dados históricos e modelos de IA para antecipar possíveis interrupções ou degradações do desempenho. Isto permite-lhe tomar medidas proativas para evitar incidentes e planear a manutenção de forma mais eficaz.
- Redução inteligente do ruído dos alertas: Utiliza IA para agrupar alertas relacionados, suprimir duplicados e dar prioridade às notificações com base no impacto e no contexto. Reduz a fadiga provocada pelos alertas e garante que a sua equipa se concentra nos problemas mais importantes.
- Sugestões de correção baseadas em IA: Analisa os dados dos incidentes e as resoluções anteriores para recomendar os passos seguintes ou correções automatizadas. Ajuda a sua equipa a responder mais rapidamente e uniformiza as melhores práticas em todas as suas operações.
Benefícios do software de gestão de operações de TI
A implementação de software de gestão de operações de TI proporciona vários benefícios à sua equipa e à sua empresa. Eis alguns dos benefícios que pode esperar:
- Visibilidade centralizada: Unifique a monitorização de servidores, redes, aplicações e recursos na nuvem através de um único painel, para que a sua equipa se mantenha à frente dos problemas em todos os ambientes.
- Resolução mais rápida de incidentes: Utilize a agregação de alertas, a correlação orientada por IA e as funcionalidades de análise automatizada da causa-raiz para identificar, priorizar e responder rapidamente a problemas operacionais.
- Menor esforço manual: Automatize tarefas recorrentes de manutenção, resolução e fluxo de trabalho utilizando ferramentas de automação e orquestração pré-configuradas, libertando tempo para iniciativas de maior valor.
- Gestão proativa de riscos: Preveja interrupções e estrangulamentos de recursos com ferramentas de deteção de anomalias e previsão baseadas em IA que identificam potenciais problemas antes de estes se agravarem.
- Otimização de custos e recursos: Acompanhe a utilização da infraestrutura, o desempenho das aplicações e os gastos com recursos através de funcionalidades de relatórios e análise, ajudando a gerir orçamentos e o planeamento da capacidade.
- Maior segurança e conformidade: Conte com controlos de acesso dos utilizadores, registos de auditoria e funcionalidades de acompanhamento de alterações para manter os dados sensíveis protegidos e apoiar os requisitos regulamentares.
- Integração perfeita com o ecossistema: Ligue plataformas ITSM, DevOps e de conversação utilizando integrações pré-configuradas e APIs abertas, facilitando a incorporação dos dados de operações na forma como a sua equipa já trabalha.
Custos e preços do software de gestão de operações de TI
A seleção de software de gestão de operações de TI requer uma compreensão dos vários modelos de preços e planos disponíveis. Os custos variam consoante as funcionalidades, o tamanho da equipa, os complementos e outros fatores. A tabela abaixo resume os planos comuns, os respetivos preços médios e as funcionalidades normalmente incluídas nas soluções de software de gestão de operações de TI:
Tabela de comparação de planos para software de gestão de operações de TI
| Tipo de plano | Preço médio | Funcionalidades comuns |
|---|---|---|
| Tipo de planoPlano gratuito | Preço médio$0 | Funcionalidades comunsMonitorização básica da infraestrutura, alertas limitados, acesso para equipas pequenas e apoio da comunidade. |
| Tipo de planoPlano pessoal | Preço médio$10–$30/utilizador/mês | Funcionalidades comunsMonitorização em tempo real, automação de nível inicial, painéis básicos, integração com ferramentas populares e apoio por e-mail. |
| Tipo de planoPlano empresarial | Preço médio$40–$80/utilizador/mês | Funcionalidades comunsMonitorização de toda a pilha, gestão de alertas e incidentes, automação de fluxos de trabalho, painéis avançados, acesso à API e controlo de acesso baseado em funções. |
| Tipo de planoPlano empresarial avançado | Preço médio$90–$200/utilizador/mês | Funcionalidades comunsVisibilidade híbrida e multicloud, funcionalidades baseadas em IA, SLAs personalizados, apoio à conformidade, integrações dedicadas e suporte premium. |
Perguntas frequentes sobre software de gestão das operações de TI
Aqui estão algumas respostas a perguntas comuns sobre software de gestão das operações de TI:
Como comparar diferentes plataformas de software de gestão das operações de TI?
Comece por fazer uma lista das funcionalidades indispensáveis, como o suporte multicloud, a automatização e a profundidade das integrações. Em seguida, teste as plataformas utilizando cenários comuns de incidentes e compare a forma como cada ferramenta lida com alertas, análise da causa raiz e relatórios. O custo total de propriedade, as integrações com o ecossistema e a flexibilidade de implementação também são aspetos importantes a analisar antes de tomar uma decisão final.
O software de gestão das operações de TI pode automatizar a resposta a incidentes?
Sim, a maioria dos softwares modernos de gestão das operações de TI permite automatizar a resposta a incidentes através de procedimentos operacionais, criadores de fluxos de trabalho e até remediação automática orientada por IA. Isto ajuda a reduzir os passos manuais e garante uma resposta consistente a problemas recorrentes.
Que integrações devo procurar num software de gestão das operações de TI?
Procure acesso a API, conectores pré-configurados para ferramentas de ITSM, como o ServiceNow, plataformas de conversação, como o Slack ou o Microsoft Teams, e pipelines de DevOps. As integrações profundas permitem à sua equipa enviar alertas, acionar fluxos de trabalho e sincronizar tickets entre os sistemas existentes sem middleware personalizado.
O software de gestão das operações de TI ajuda na conformidade e na auditoria?
Sim, um software robusto de gestão das operações de TI acompanha as alterações do sistema e as ações dos utilizadores, além de fornecer registos de auditoria necessários para a conformidade. Isto é especialmente útil em setores regulamentados, nos quais é necessário apresentar provas claras dos controlos e um histórico completo das alterações para efeitos de relatórios.
Como posso evitar custos inesperados com um software de gestão das operações de TI?
Analise sempre a forma como a plataforma cobra pela ingestão de dados, pelas métricas personalizadas e pelas licenças de utilizador. Escolha ferramentas com preços transparentes baseados na utilização e painéis de custos na aplicação, para poder monitorizar as despesas e evitar custos adicionais inesperados à medida que o seu ambiente cresce.
Qual é a melhor forma de obter o apoio das partes interessadas para uma nova plataforma de gestão das operações de TI?
Mostre de que forma a plataforma ajuda a alcançar os objetivos do negócio: resolução mais rápida de incidentes, gestão proativa dos riscos e melhoria dos relatórios. Partilhe uma demonstração ou os resultados de um projeto-piloto, destaque os ganhos de eficiência esperados e associe as funcionalidades aos problemas que as partes interessadas reconhecem.