Le 10 migliori piattaforme di tracciamento degli esperimenti ML nel 2026

Migliori strumenti per il tracciamento degli esperimenti ML - Shortlist


Gli strumenti per il tracciamento degli esperimenti ML ti aiutano a registrare, organizzare e confrontare gli esperimenti di machine learning, così da poter gestire i risultati e riprodurre le scoperte con sicurezza. Se cerchi modi concreti per tenere traccia degli esperimenti, condividere i progressi con il tuo team o organizzare modelli e dataset, lo strumento giusto può fare una grande differenza.
In questo elenco troverai soluzioni adatte a diversi stack tecnici e flussi di lavoro, che ti permetteranno di ridurre le difficoltà, semplificare la reportistica e concentrarti su una gestione affidabile degli esperimenti di machine learning.
Table of Contents
- La nostra selezione dei migliori software
- Perché puoi fidarti di noi
- Confronta specifiche
- Recensioni
- Altre piattaforme di tracciamento esperimenti ML
- Recensioni correlate
- Criteri di selezione
- Come scegliere
- Cosa sono le piattaforme di tracciamento degli esperimenti di ML?
- Funzionalità
- Vantaggi
- Costi e prezzi
- Domande frequenti
Perché Fidarti delle Nostre Recensioni Software
Testiamo e recensiamo software dal 2023. Come leader tecnologici, sappiamo quanto sia cruciale e difficile prendere la decisione giusta nella scelta di un software.
Investiamo in una ricerca approfondita per aiutare il nostro pubblico a effettuare scelte migliori di acquisto software. Abbiamo testato oltre 2.000 strumenti per diversi casi d’uso tecnologici e scritto più di 1.000 recensioni complete. Scopri come restiamo trasparenti e la nostra metodologia di recensione del software.
Riepilogo migliori strumenti per il tracciamento degli esperimenti ML
Questa tabella comparativa riassume i dettagli sui prezzi delle mie migliori scelte di strumenti per il tracciamento di esperimenti ML per aiutarti a trovare quello più adatto al tuo budget e alle esigenze della tua azienda.
| Tool | Best For | Trial Info | Price | ||
|---|---|---|---|---|---|
| 1 | Ideale per il confronto in tempo reale degli esperimenti | Piano gratuito disponibile | Da $19/utente/mese | Website | |
| 2 | Ideale per dashboard di visualizzazione personalizzabili | Piano gratuito disponibile | Da $60/mese | Website | |
| 3 | Ideale per il versionamento automatico delle pipeline | Disponibile prova gratuita di 14 giorni | Prezzo su richiesta | Website | |
| 4 | Ideale per l'orchestrazione automatica delle pipeline | Piano gratuito disponibile | Da $15/utente/mese | Website | |
| 5 | Ideale per il supporto open-source al ciclo di vita dei modelli | Demo gratuita + piano gratuito per sempre disponibile | Gratis per sempre (open-source) | Website | |
| 6 | Ideale per la gestione di workflow nativi Kubernetes | Piano gratuito disponibile | Gratuito e open source | Website | |
| 7 | Ideale per l'integrazione con l'ecosistema cloud AWS | Piano gratuito disponibile | Prezzo su richiesta | Website | |
| 8 | Ideale per architettura a plugin e grande estendibilità | Piano gratuito disponibile | Da $399/mese | Website | |
| 9 | Ideale per opzioni di deployment ibrido e on-premise | Piano gratuito + demo gratuita disponibile | Da $450/mese (fatturazione annuale) | Website | |
| 10 | Ideale per uno spazio di lavoro di analisi unificato per i team | Prova gratuita di 14 giorni disponibile | Prezzi su richiesta | Website |
-

TestDevLab
Visit Website -
Site24x7
Visit WebsiteThis is an aggregated rating for this tool including ratings from Crozdesk users and ratings from other sites.4.7 -
GitHub Actions
Visit WebsiteThis is an aggregated rating for this tool including ratings from Crozdesk users and ratings from other sites.4.8


Recensioni migliori strumenti per il tracciamento degli esperimenti ML
Di seguito trovi i miei riassunti dettagliati dei migliori strumenti per il tracciamento degli esperimenti ML che sono finiti sulla mia shortlist. Le mie recensioni offrono una panoramica dettagliata delle funzionalità, integrazioni e casi d’uso ideali di ogni piattaforma per aiutarti a trovare quella più adatta a te.
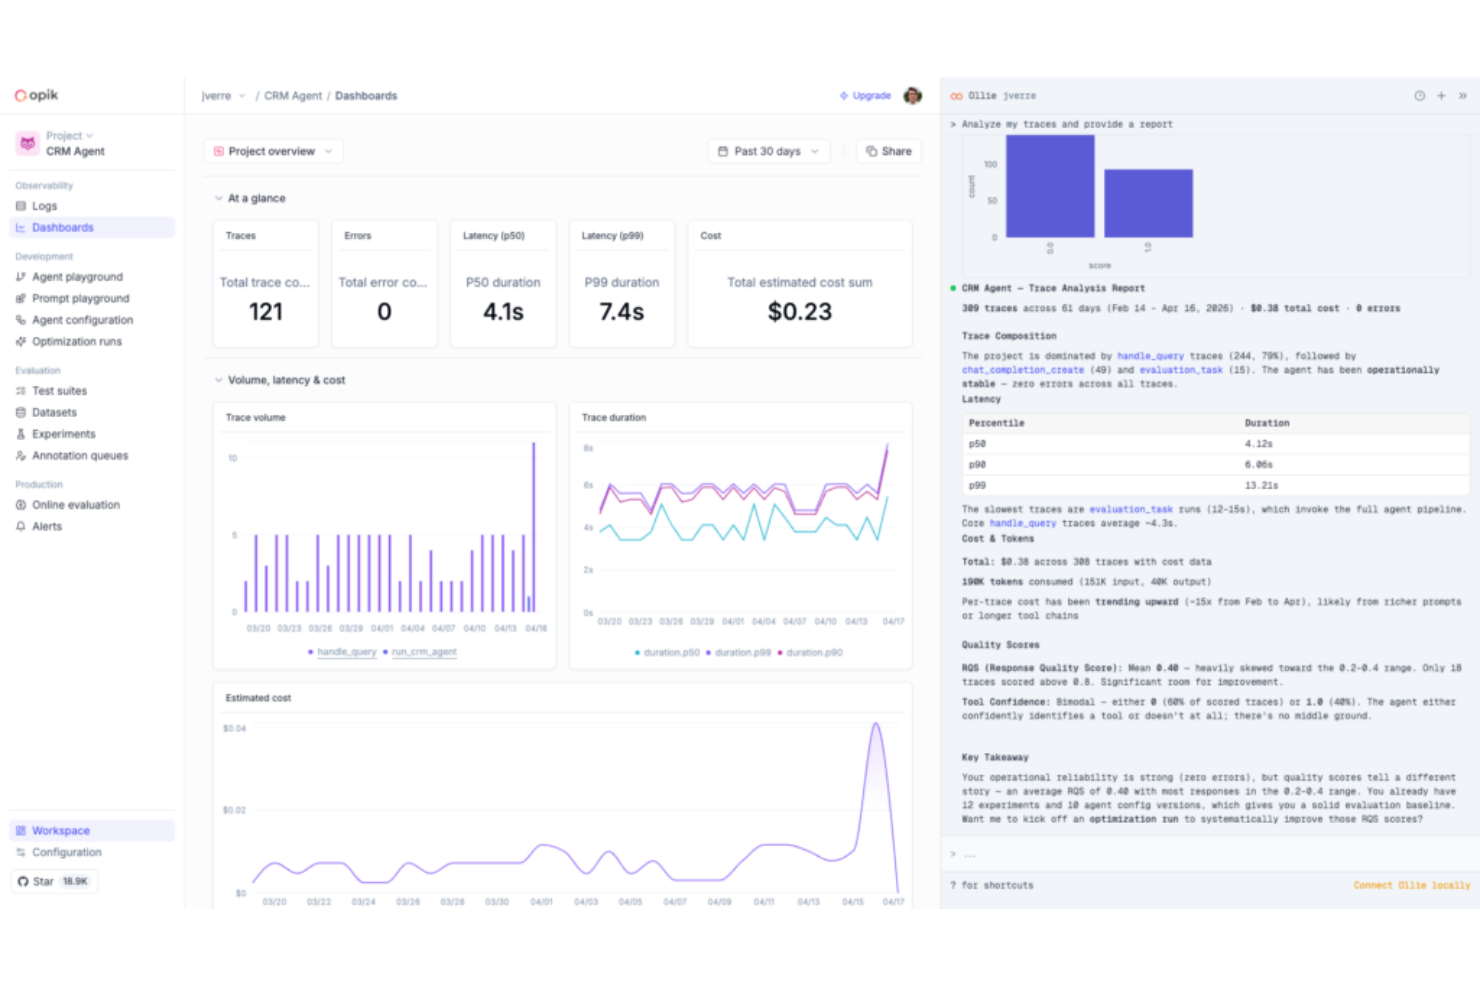
Comet è una piattaforma per il monitoraggio degli esperimenti di Machine Learning e la valutazione dei modelli che registra metriche, iperparametri e artefatti delle sessioni di addestramento ed estende la sua funzionalità all’osservabilità dei LLM e alla valutazione dell’IA agentica tramite il prodotto Opik.
Per chi è Comet?
Comet è particolarmente adatto a team di ML e AI in aziende in crescita o enterprise che effettuano un elevato volume di esperimenti e necessitano di una visibilità in tempo reale sulle sessioni di addestramento.
Perché ho scelto Comet
Ho scelto Comet tra i migliori perché il suo dashboard di monitoraggio live degli esperimenti aggiorna le metriche durante l’addestramento, consentendo al mio team di individuare subito una curva di perdita divergente e interrompere una sessione problematica prima di sprecare risorse computazionali. Utilizzo anche la visualizzazione di confronto affiancato degli esperimenti per filtrare tra decine di sessioni in base al valore dell’iperparametro e isolare subito quale configurazione ha portato alla migliore accuratezza di validazione. Oltre alle funzionalità classiche di MLOps, Comet ora si estende anche alla valutazione dei LLM tramite Opik, così non devo cambiare strumento quando passo dall’addestramento del modello al monitoraggio degli agenti in produzione.
Caratteristiche principali di Comet
- Registro dei modelli: Salva, versiona e gestisci i modelli addestrati in un registro centralizzato con etichette di stato come staging e produzione.
- Registrazione degli artefatti: Registra e versiona dataset, immagini, matrici di confusione e file audio direttamente insieme alle sessioni di esperimento.
- Pannelli personalizzati: Crea visualizzazioni personalizzate all’interno della UI di Comet usando JavaScript per andare oltre i grafici metrici predefiniti.
- Monitoraggio delle metriche di sistema: Rileva automaticamente l’utilizzo della GPU, il carico della CPU e l’utilizzo della memoria per ogni sessione senza necessità di ulteriore strumentazione.
Integrazioni di Comet
Comet offre oltre 30 integrazioni native, tra cui PyTorch, TensorFlow, Keras, Scikit-learn, XGBoost, Hugging Face Transformers, Ray, Kubeflow, Snowflake e Vertex AI. È disponibile su Zapier e propone una REST API, oltre a SDK Python, Java, JavaScript e R per integrazioni personalizzate.
Pros and Cons
Pros:
- Registrazione automatica delle metriche con pochissimo codice
- Visualizzazione in tempo reale delle sessioni di addestramento
- Traccia sia esperimenti ML che LLM
Cons:
- Il piano Pro limita i team a 10 utenti
- Le opzioni di personalizzazione della UI sono limitate
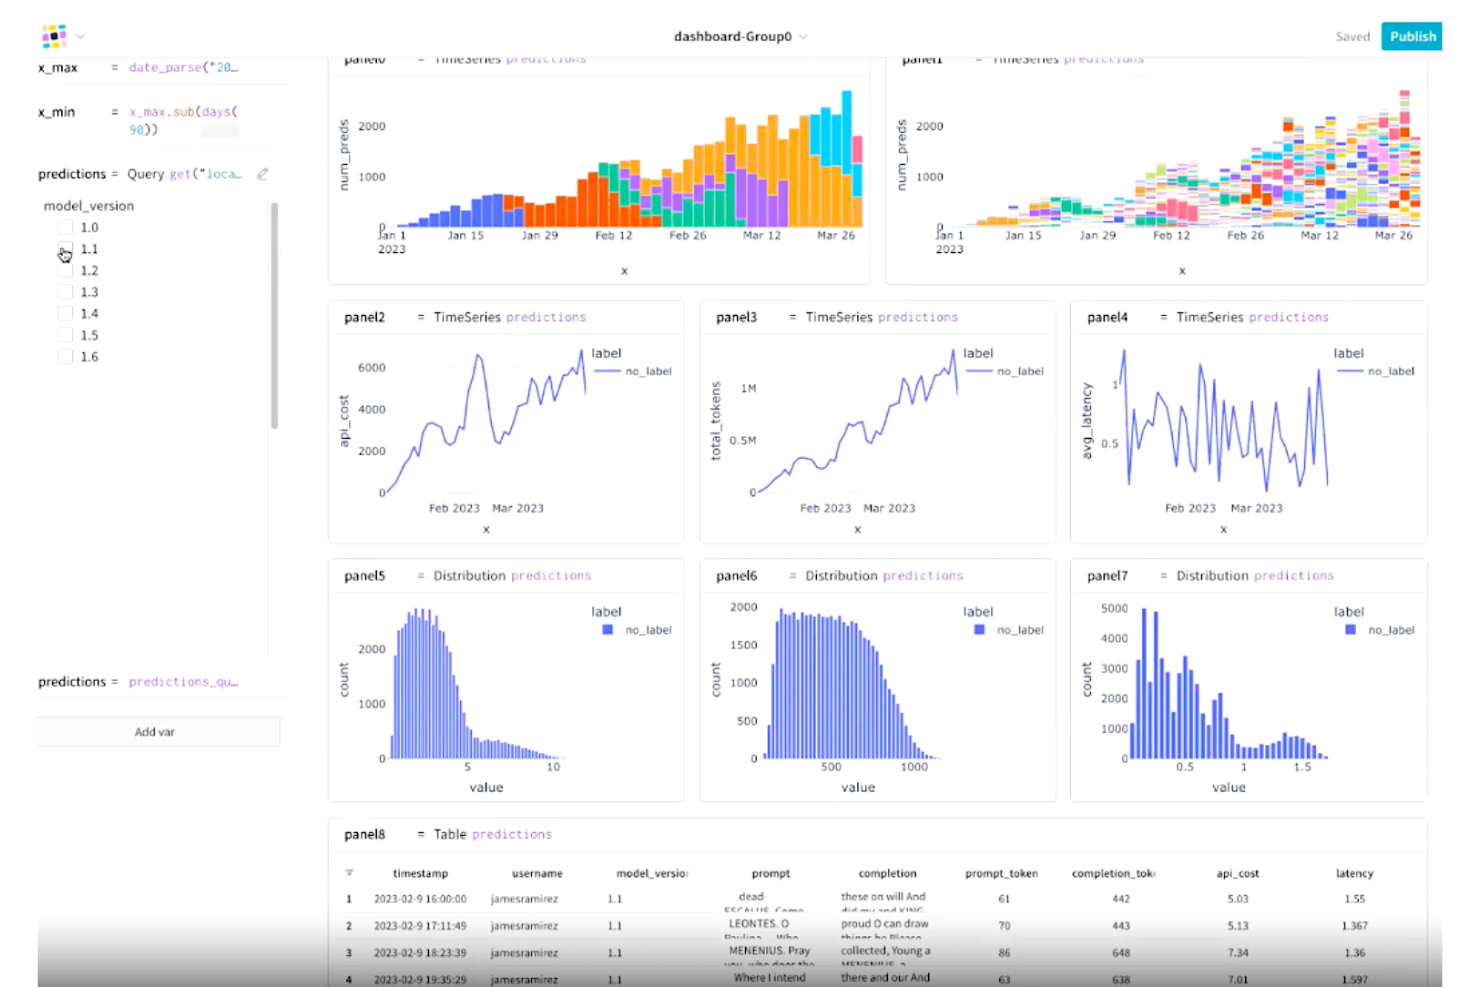
Weights & Biases è una piattaforma di tracciamento degli esperimenti di apprendimento automatico che registra metriche, iperparametri e checkpoint dei modelli, permettendo di visualizzare e confrontare le esecuzioni tramite dashboard interattive.
A chi è ideale Weights & Biases?
Weights & Biases si adatta perfettamente a data scientist e ingegneri ML che effettuano frequenti esperimenti e necessitano di confronti dettagliati tra diverse esecuzioni all'interno di team numerosi.
Perché ho scelto Weights & Biases
Weights & Biases è una delle mie scelte preferite perché apprezzo molto le dashboard di visualizzazione personalizzabili che offre. Posso visualizzare in tempo reale l'utilizzo delle GPU, le curve di perdita e le previsioni di esempio in un'unica dashboard interattiva durante l'addestramento, il che rende rapido individuare i colli di bottiglia. La funzione Sweeps mi permette di visualizzare i risultati della ricerca degli iperparametri direttamente accanto alle metriche dell'esperimento, così posso confrontare tutto in un'unica schermata. I report consentono inoltre al mio team di annotare e condividere queste dashboard senza uscire dalla piattaforma.
Funzionalità chiave di Weights & Biases
- Artifacts: Versiona e traccia set di dati, modelli e risultati di valutazione attraverso gli esperimenti.
- Registro dei modelli: Centralizza i modelli addestrati e collegali direttamente agli esperimenti che li hanno generati.
- Raggruppamento delle esecuzioni: Organizza le esecuzioni correlate in gruppi per confrontare i risultati tra diverse configurazioni di addestramento.
- Avvisi: Imposta notifiche automatiche per soglie metriche, errori di esecuzione o eventi di completamento dei job.
Integrazioni di Weights & Biases
Weights & Biases offre integrazioni native con PyTorch, Keras, TensorFlow, Scikit-learn, XGBoost, Hugging Face Transformers e PyTorch Lightning, oltre a strumenti LLM come LangChain e LlamaIndex. Si integra anche con Kubeflow, Jenkins, Airflow, GitHub Actions, AWS SageMaker e Google Vertex AI. Sono disponibili una API e un SDK Python per integrazioni personalizzate.
Pros and Cons
Pros:
- Streaming in tempo reale delle metriche alle dashboard
- Registrazione automatica dei commit git e della configurazione
- Report collaborativi ricchi di grafici integrati
Cons:
- L'interfaccia web rallenta con molte esecuzioni in parallelo
- Documentazione carente sulle funzionalità di base
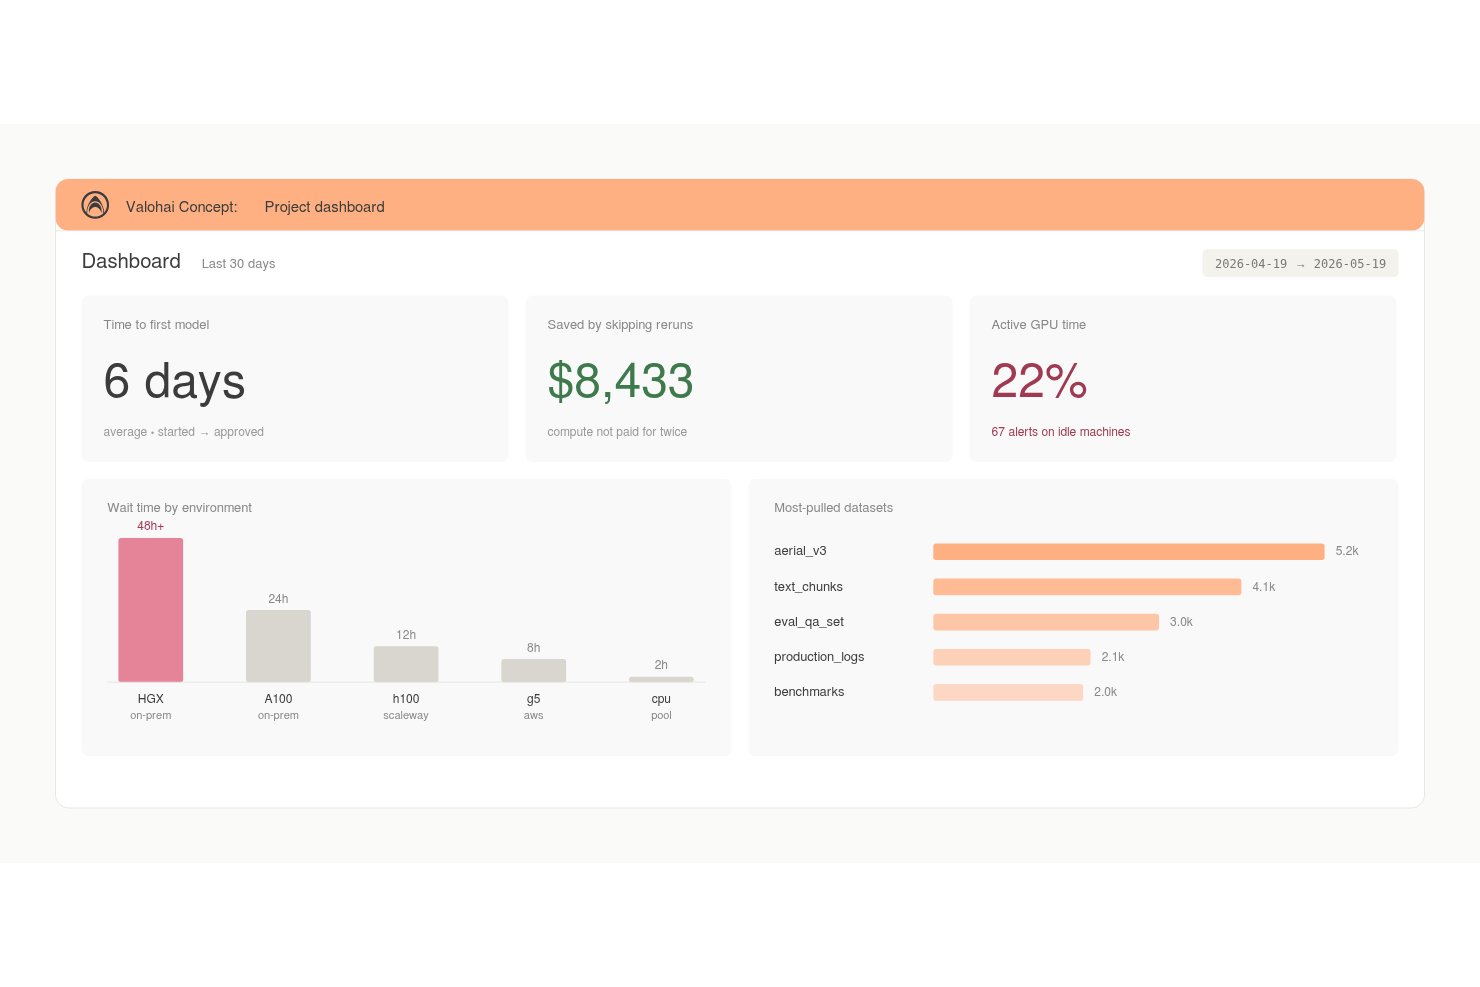
Valohai è una piattaforma ML che combina monitoraggio automatico degli esperimenti, versionamento dei dataset, tracciabilità dei modelli e orchestrazione del calcolo cloud per team che sviluppano e addestrano modelli su larga scala.
Per chi è ideale Valohai?
Valohai è particolarmente adatto ai team di ingegneria ML di aziende di medie e grandi dimensioni che eseguono frequentemente processi di training su più ambienti cloud.
Perché ho scelto Valohai
Ho scelto Valohai tra i migliori perché il versionamento automatico è realmente integrato in ogni esecuzione. Metriche, metadati, log e iperparametri vengono versionati senza alcun tag manuale, così non devo mai ricostruire cosa sia stato eseguito e quando. Apprezzo anche che Valohai tracci la piena genealogia di dataset e modelli, il che significa che posso risalire esattamente a quale versione del dataset abbia prodotto uno specifico modello. Ogni esecuzione è riproducibile per progettazione, eliminando così le incertezze che compromettono le revisioni degli esperimenti.
Funzionalità principali di Valohai
- Vista comparativa degli esperimenti: Visualizza più esecuzioni affiancate, permettendo di confrontare iperparametri, metriche e output degli esperimenti in un'unica tabella.
- Costruttore di pipeline: Un editor visuale per costruire pipeline ML multi-step, in cui ogni nodo corrisponde a uno step di esecuzione versionato.
- Orchestrazione del calcolo cloud: Provvede automaticamente al provisioning e alla terminazione delle istanze cloud su AWS, GCP o Azure per ogni esecuzione di training.
- Trigger di deployment: Promuove i modelli addestrati direttamente su un endpoint di servizio dalla stessa piattaforma utilizzata per il training.
Integrazioni Valohai
Valohai offre un piccolo set di integrazioni preconfigurate tramite la sua libreria Ecosystem, tra cui connettori per Snowflake, BigQuery e Redshift, un template Hugging Face e integrazioni con Slurm e OVHcloud. Funziona su AWS, GCP, Azure e Oracle Cloud Infrastructure e fornisce un'API REST per creare integrazioni personalizzate.
Pros and Cons
Pros:
- Registra automaticamente le metriche dai log JSON stampati
- Funziona su qualsiasi cloud o hardware on-premises
- Tracciabilità completa dalla fonte dati al modello
Cons:
- Adattare gli script al formato Valohai richiede tempo
- La vista principale degli esperimenti è visivamente poco accattivante
ClearML è una piattaforma MLOps open-source che copre il tracciamento degli esperimenti, la gestione delle versioni dei dataset, la gestione dei modelli e l'orchestrazione delle pipeline lungo tutto il ciclo di vita del machine learning.
Per chi è ideale ClearML?
ClearML è particolarmente adatto per ingegneri ML e data scientist all'interno di organizzazioni che ospitano autonomamente le infrastrutture MLOps e necessitano di pieno controllo sulle proprie pipeline.
Perché ho scelto ClearML
ClearML si è guadagnato un posto nella mia lista perché la sua orchestrazione automatica delle pipeline è davvero priva di intervento manuale. Quando aggiungo un job a una coda, ClearML lo containerizza con il suo intero ambiente e gestisce automaticamente pianificazione e risorse. Non devo riscrivere il codice per passare da on-premise, cloud o cluster HPC. Inoltre, apprezzo che i componenti delle pipeline memorizzati in cache consentano di saltare passaggi ridondanti durante i riavvii, riducendo sensibilmente i tempi di ciclo nei flussi di lavoro di training iterativo.
Caratteristiche principali di ClearML
- Auto-logging degli esperimenti: Cattura automaticamente metriche, iperparametri, output della console e codice sorgente da ogni sessione di training senza bisogno di strumenti aggiuntivi.
- Gestione delle versioni dei dati con ClearML: Gestisce la versionatura e il tracciamento completo dei dataset, collegando ogni versione del dataset direttamente agli esperimenti che l’hanno utilizzata.
- Registro dei modelli: Conserva, etichetta e recupera modelli addestrati, tenendo traccia delle versioni e dello stato in ogni fase dello sviluppo.
- Ottimizzazione degli iperparametri: Esegui ricerche HPO automatiche tra esperimenti utilizzando strategie integrate come ottimizzazione bayesiana e ricerca casuale.
Integrazioni ClearML
ClearML offre integrazioni native con PyTorch, TensorFlow, Keras, Scikit-learn, XGBoost, Hugging Face Transformers, FastAI, Optuna e Hydra, oltre a strumenti di visualizzazione come Matplotlib e TensorBoard. Sono disponibili un'API e un SDK Python per integrazioni personalizzate.
Pros and Cons
Pros:
- Server open source self-hostable elimina i costi di abbonamento
- Registra automaticamente codice, dataset e iperparametri senza strumenti aggiuntivi
- Il design modulare permette di adottare singoli componenti
Cons:
- Lacune nella documentazione rallentano l’onboarding dei nuovi utenti
- La navigazione tra i moduli risulta disorganica su larga scala
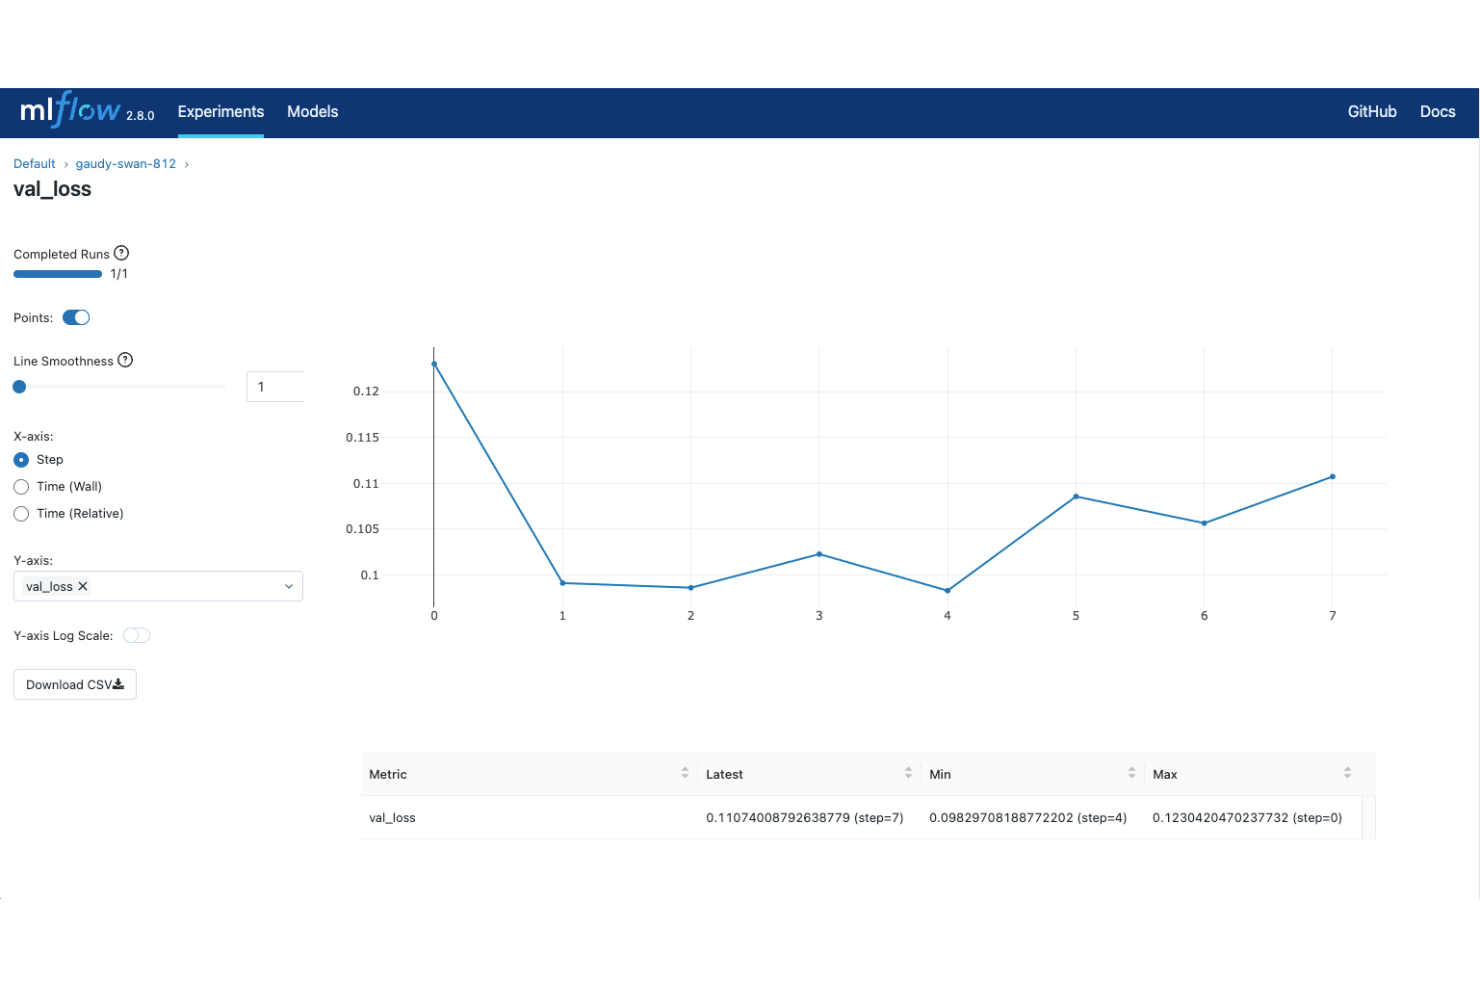
MLflow è una piattaforma open-source per il tracciamento di esperimenti di apprendimento automatico che copre l'intero ciclo di vita del modello, dalla registrazione degli esperimenti e il confronto delle esecuzioni fino al packaging dei modelli, versionamento e distribuzione.
Per chi è ideale MLflow?
MLflow è la scelta naturale per ingegneri ML e data scientist presso organizzazioni che desiderano ospitare autonomamente i propri strumenti e avere il pieno controllo sull'infrastruttura di tracciamento degli esperimenti, evitando il lock-in dei fornitori.
Perché ho scelto MLflow
MLflow merita il suo posto nella mia shortlist perché copre l'intero ciclo di vita del modello in un unico framework open-source. Utilizzo l'API di MLflow Tracking per registrare parametri, metriche e artefatti nelle varie esecuzioni, poi il Model Registry per versionare e far passare i modelli dallo sviluppo alla produzione. Ciò che apprezzo davvero è la possibilità di impacchettare i modelli utilizzando il formato standard di MLflow e distribuirli su qualsiasi obiettivo senza dover riscrivere il codice di serving.
Caratteristiche principali di MLflow
- Autologging: Acquisisce automaticamente parametri, metriche e artefatti da librerie supportate come Scikit-learn, XGBoost e PyTorch senza bisogno di chiamate manuali di logging.
- Interfaccia di confronto delle esecuzioni: Visualizza e confronta le metriche tra più sessioni di addestramento fianco a fianco nell'interfaccia web integrata di MLflow.
- MLflow Projects: Permette di impacchettare il codice ML con le sue dipendenze e i punti di ingresso, così ogni esecuzione può essere riprodotta esattamente su qualsiasi macchina.
- Sistema di plugin: Estende il comportamento di tracking, storage e deployment di MLflow tramite plugin sviluppati dalla comunità senza modificare il codice principale.
Integrazioni di MLflow
MLflow offre oltre 60 integrazioni native tra cui PyTorch, TensorFlow, Scikit-learn, XGBoost, LightGBM, Hugging Face Transformers, LangChain, LlamaIndex e OpenAI. Supporta anche AWS SageMaker, Azure ML, Databricks e OpenTelemetry. Sono disponibili una REST API e una Python SDK per integrazioni personalizzate.
Pros and Cons
Pros:
- Registrazione agnostica rispetto al framework tra varie librerie ML
- Versionamento completo dei modelli con transizioni di stato
- Ospitabile autonomamente su qualsiasi infrastruttura
Cons:
- Richiede sforzi DevOps per l'ambiente di produzione
- Visualizzazione limitata della profilazione hardware integrata
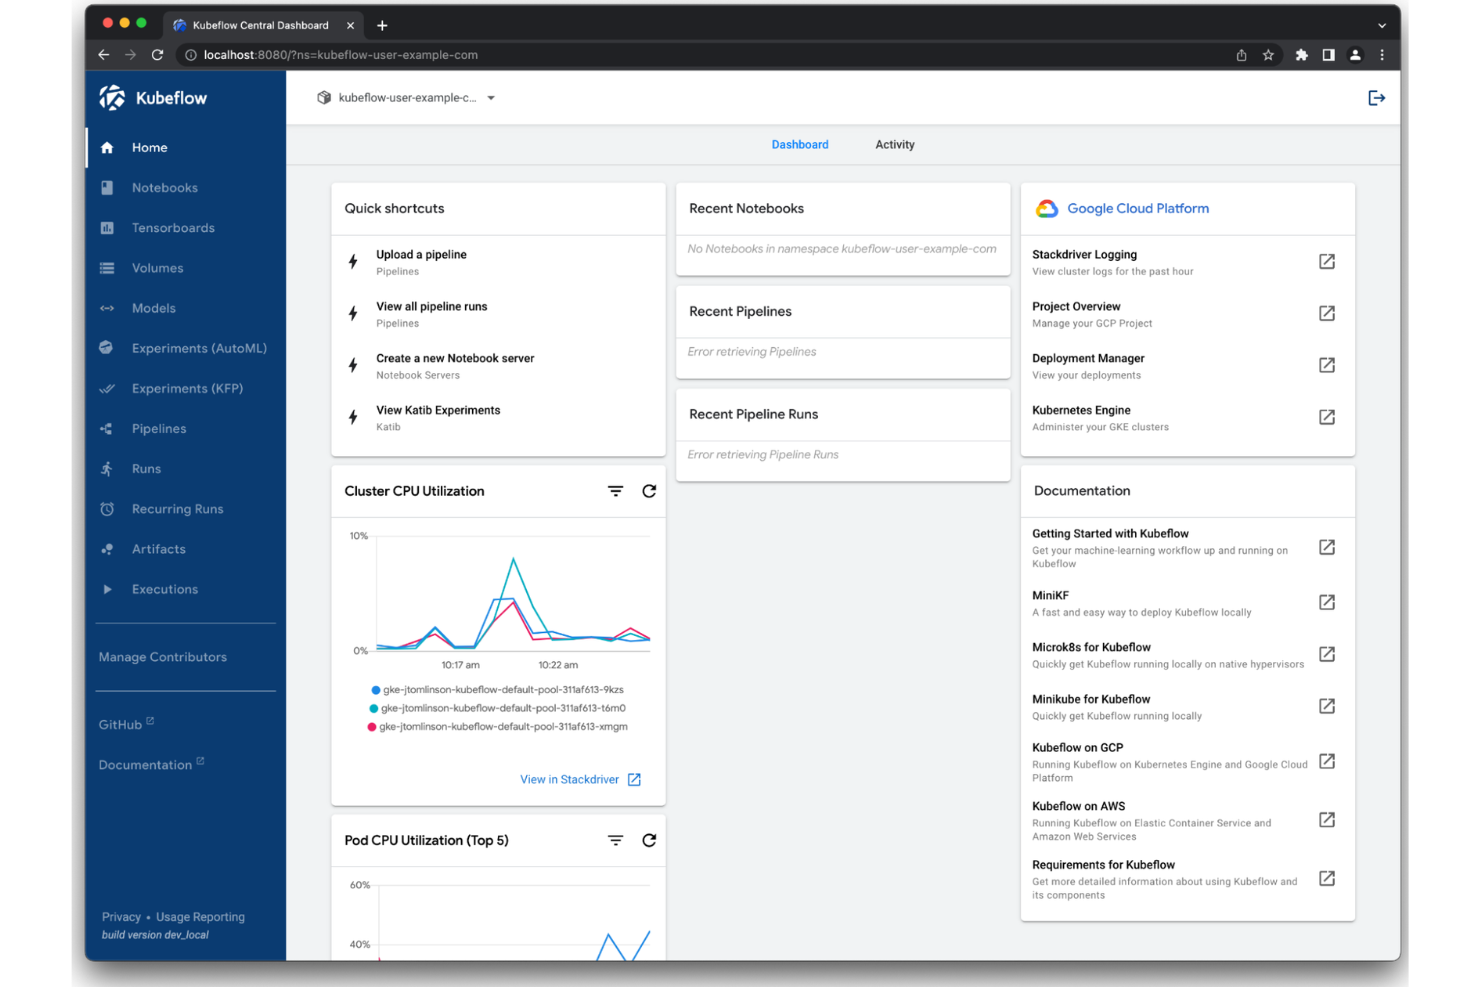
Kubeflow è una piattaforma ML open source costruita su Kubernetes che copre l'orchestrazione delle pipeline, il tracciamento degli esperimenti, l'addestramento dei modelli e la ricerca degli iperparametri nativamente all'interno di un'infrastruttura containerizzata.
Per chi è più indicato Kubeflow?
Kubeflow è una scelta naturale per i team di ingegneria ML che già eseguono carichi di lavoro su Kubernetes e desiderano mantenere l'infrastruttura di tracciamento degli esperimenti sulla stessa piattaforma.
Perché ho scelto Kubeflow
Kubeflow merita una posizione nella mia lista perché mappa ogni fase della pipeline direttamente su un pod Kubernetes, dando alle esecuzioni degli esperimenti gli stessi controlli sulle risorse di qualsiasi altro carico di lavoro del cluster. Utilizzo Kubeflow Pipelines per effettuare il versioning e il replay delle esecuzioni di addestramento senza uscire dall'ambiente Kubernetes. Il componente Katib esegue in parallelo prove di ottimizzazione degli iperparametri come job Kubernetes nativi, senza bisogno di infrastrutture separate.
Caratteristiche principali di Kubeflow
- Isolamento dei namespace multiutente: Separa esperimenti e pipeline per team o progetto utilizzando i controlli di accesso a livello di namespace Kubernetes.
- Kubeflow Notebooks: Avvia server Jupyter notebook direttamente nel cluster, mantenendo l'esplorazione dei dati nello stesso ambiente delle esecuzioni di addestramento.
- Tracciamento della genealogia degli artifact: Registra input, output e metadati per ogni fase della pipeline, collegando set di dati e modelli alle esecuzioni specifiche.
- Operator di addestramento: Gestisce job di addestramento distribuito su framework come PyTorch, TensorFlow e XGBoost come risorse personalizzate native di Kubernetes.
Integrazioni di Kubeflow
Kubeflow non offre le tradizionali integrazioni native; invece, opera all'interno dell'ecosistema Kubernetes e supporta framework ML come TensorFlow, PyTorch, JAX, XGBoost, HuggingFace e Apache Spark tramite i suoi operator sottoprogetto. Puoi anche distribuirlo su servizi Kubernetes gestiti da AWS, Google Cloud, Microsoft Azure e Red Hat OpenShift.
Pros and Cons
Pros:
- Esegue esperimenti direttamente su pod Kubernetes
- Il versioning delle pipeline traccia ogni esecuzione di addestramento
- Ottimizzazione parallela degli iperparametri tramite il componente Katib
Cons:
- La configurazione del cluster richiede una profonda conoscenza di Kubernetes
- L'interfaccia utente risulta datata rispetto alle alternative commerciali
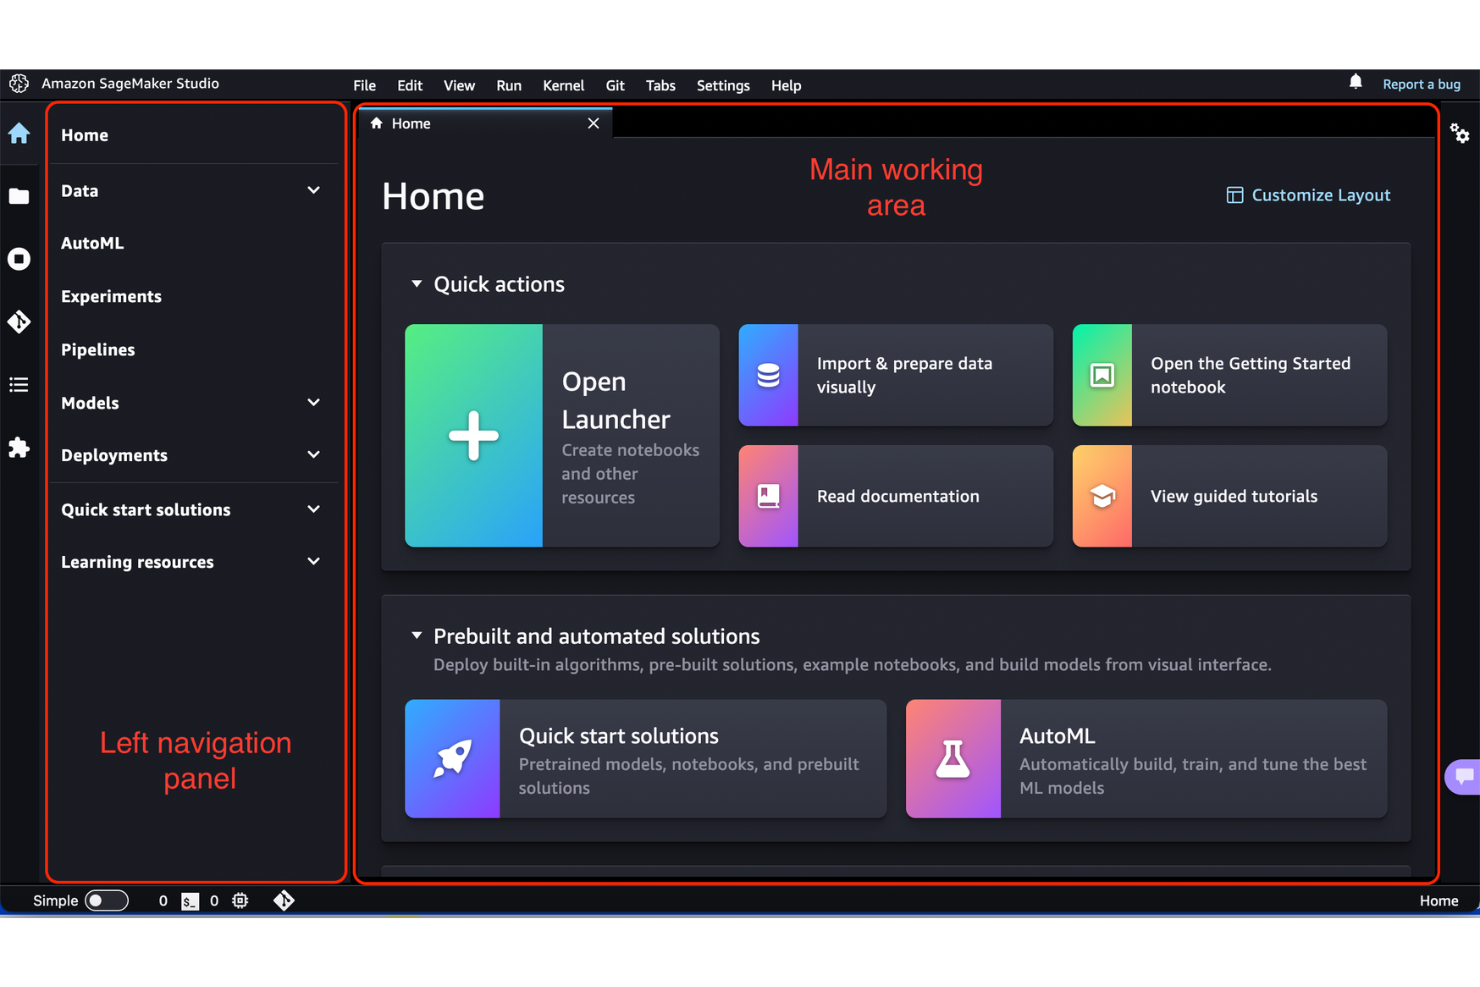
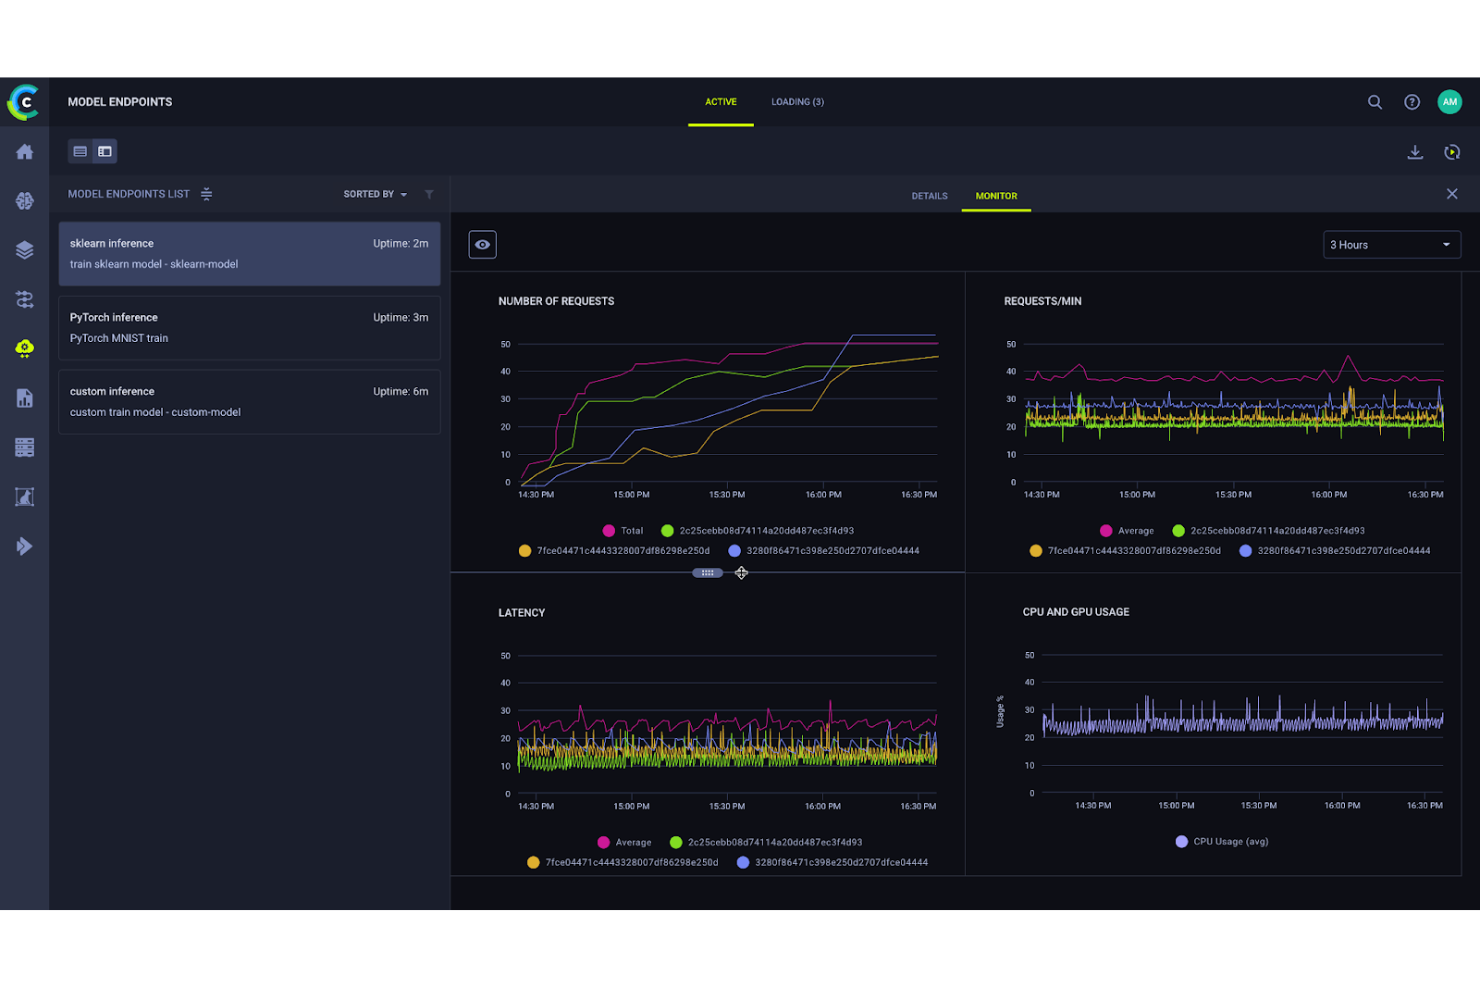
Amazon SageMaker è una piattaforma ML completamente gestita su AWS che copre il monitoraggio degli esperimenti, l'addestramento dei modelli, l'ottimizzazione degli iperparametri, il registro dei modelli e il deployment per tutto il ciclo di vita dell'apprendimento automatico.
Per chi è ideale Amazon SageMaker?
Amazon SageMaker è una soluzione naturale per team di data science e ingegneria ML che già eseguono carichi di lavoro su infrastruttura AWS.
Perché ho scelto Amazon SageMaker
Ho incluso Amazon SageMaker tra le mie scelte principali perché il monitoraggio degli esperimenti è integrato direttamente nell'ecosistema AWS in modi che altri strumenti non possono replicare. SageMaker Experiments registra esecuzioni, parametri e metriche nativamente insieme allo storage di artefatti su S3 e all'accesso controllato da IAM, quindi non c'è infrastruttura separata da gestire. Il mio team usa anche SageMaker Pipelines per concatenare lavori di addestramento, valutazioni e registrazione dei modelli in un unico flusso di lavoro auditabile senza uscire da AWS.
Caratteristiche principali di Amazon SageMaker
- Registro dei modelli SageMaker: Versiona, approva e gestisce i modelli addestrati con tracciamento dei metadati lungo l'intero ciclo di vita del modello.
- Ottimizzazione automatica dei modelli: Esegui job di ottimizzazione degli iperparametri utilizzando strategie di ricerca bayesiana, casuale o a griglia su larga scala.
- SageMaker Debugger: Monitora i job di addestramento in tempo reale per individuare problematiche come gradiente che svanisce o overfitting mentre si presentano.
- SageMaker Feature Store: Archivia, condividi e recupera funzionalità ML tra carichi di lavoro di addestramento e inferenza da un repository centralizzato.
Integrazioni di Amazon SageMaker
Amazon SageMaker si integra nativamente con l'ecosistema AWS, incluso Amazon S3, Amazon Redshift, AWS Glue, Amazon EMR, Amazon Athena, Amazon ECR, AWS Lambda, Amazon CloudWatch e MLflow. È disponibile un'API per integrazioni personalizzate.
Pros and Cons
Pros:
- Traccia parametri, dati e versioni del codice per ogni esecuzione
- Checkpointing automatico durante lunghi job di addestramento
- Monitoraggio integrato dei modelli insieme ai log degli esperimenti
Cons:
- Le risorse inutilizzate possono accumulare addebiti silenziosamente
- Gli artefatti dei modelli usano formati specifici AWS, limitando la portabilità

ZenML è una piattaforma open-source per l'orchestrazione di pipeline di machine learning che gestisce l'orchestrazione dei flussi di lavoro, il versionamento degli artefatti, la tracciabilità dei modelli e il monitoraggio degli esperimenti su qualsiasi infrastruttura cloud o stack ML.
Per chi è più adatto ZenML?
ZenML è particolarmente adatto a ingegneri ML e team di data science che devono standardizzare e scalare pipeline di machine learning su diversi ambienti cloud o stack infrastrutturali.
Perché ho scelto ZenML
ZenML merita un posto nella mia shortlist perché la sua architettura a componenti di stack mi permette di sostituire qualsiasi parte dell'infrastruttura ML senza dover riscrivere il codice della pipeline. Posso collegare MLflow o Weights & Biases come sistema di monitoraggio esperimenti, cambiare l'archivio degli artefatti da locale a S3 e modificare l'orchestratore in Kubeflow, tutto semplicemente cambiando lo stack attivo. Utilizzo inoltre le versioni personalizzate dei componenti di ZenML per costruire integrazioni di monitoraggio proprietarie che si adattano perfettamente alla stessa astrazione di pipeline.
Funzionalità principali di ZenML
- Caching dei passaggi della pipeline: Memorizza automaticamente nella cache gli output dei passaggi già eseguiti, così i passaggi invariati non vengono rieseguiti durante gli esperimenti iterativi.
- Versionamento degli artefatti: Tiene traccia di ogni artefatto prodotto da un'esecuzione della pipeline, inclusi dataset, modelli e metriche, con tracciabilità completa verso il passaggio di origine.
- Registro dei modelli: Archivia e versiona i modelli addestrati insieme ai relativi metadati, esecuzioni di pipeline e storico dei deployment in un registro centrale.
- Dashboard di ZenML: Fornisce un'interfaccia web per sfogliare le esecuzioni delle pipeline, confrontare gli output degli esperimenti e ispezionare i metadati degli artefatti tra gli stack.
Integrazioni ZenML
ZenML offre 66 integrazioni native nell'ecosistema ML, tra cui MLflow, Weights & Biases, Neptune, Comet e TensorBoard, oltre a orchestratori come Kubeflow, Apache Airflow, Kubernetes e Databricks, e infrastrutture cloud come AWS, Google Cloud e Microsoft Azure. È disponibile anche un'API per integrazioni personalizzate.
Pros and Cons
Pros:
- Cambio dell'infrastruttura senza riscrivere il codice della pipeline
- Stack cloud-agnostic che evita il lock-in del fornitore
- Versionamento automatico degli artefatti tra le esecuzioni della pipeline
Cons:
- Si basa su strumenti di terze parti per la visualizzazione degli esperimenti
- La configurazione iniziale dello stack richiede un elevato sforzo di setup

Polyaxon è una piattaforma per il tracciamento di esperimenti ML e l'orchestrazione di pipeline che copre il monitoraggio degli esperimenti, l'ottimizzazione degli iperparametri, la versionizzazione degli artefatti, il registro dei modelli e la pianificazione distribuita delle attività su infrastrutture cloud e locali.
Per chi è Polyaxon?
Polyaxon è particolarmente indicato per gli ingegneri ML all'interno di organizzazioni enterprise che operano con rigorosi requisiti di governance dei dati o necessitano di eseguire carichi di lavoro su infrastrutture private.
Perché ho scelto Polyaxon
Ho incluso Polyaxon tra le mie scelte migliori perché è una delle poche piattaforme di tracciamento esperimenti ML costruite da zero per funzionare interamente all'interno della propria infrastruttura. Lo gestisco su un cluster Kubernetes privato, e ogni log di esperimento, artefatto e modello rimane all'interno della nostra rete. La sua architettura basata su agenti mi permette di collegare ambienti on-prem isolati a un piano di controllo centrale senza esporre dati grezzi all'esterno, il che è un vero requisito nei settori regolamentati.
Funzionalità principali di Polyaxon
- Ricerca e ottimizzazione degli iperparametri: Esegui gruppi di esperimenti in parallelo utilizzando strategie di ricerca distribuite per trovare le configurazioni ottimali dei modelli.
- Component hub: Definisci moduli riutilizzabili con input e output tipizzati che possono essere condivisi e versionati nelle pipeline del tuo team.
- Ricerca avanzata: Filtra le esecuzioni per nome, descrizione, regex, campi specifici, metriche o configurazioni per trovare rapidamente gli esperimenti.
- Applicazione delle SLA: Applica policy di TTL, timeout e retry alle singole operazioni per mantenere le pipeline entro i limiti definiti.
Integrazioni Polyaxon
Polyaxon offre un ampio set di integrazioni native per il tracciamento ML, l'orchestrazione e l'infrastruttura, tra cui TensorBoard, PyTorch, TensorFlow, Keras, XGBoost, Hugging Face, Kubeflow, Slack, GitHub e Jenkins. Si collega inoltre con Zapier e mette a disposizione un'API per integrazioni personalizzate e l'automazione CI/CD.
Pros and Cons
Pros:
- Pianificazione di job di training distribuiti nativa su Kubernetes
- Multi-tenancy integrata con controlli granulari degli accessi
- Supporta deployment on-premise, cloud e ibrido
Cons:
- Richiede una profonda conoscenza di Kubernetes per l'operatività
- Comunità più piccola rispetto a MLflow o W&B
Databricks
Ideale per uno spazio di lavoro di analisi unificato per i team

Altri strumenti per il tracciamento degli esperimenti ML
Ecco alcune altre opzioni di strumenti per il tracciamento degli esperimenti ML che non sono rientrate nella mia shortlist, ma che meritano comunque una verifica:
- Domino Data Lab
Ideale per il controllo centralizzato nella ricerca collaborativa
- iguazio
Ideale per il monitoraggio in tempo reale dei modelli su larga scala
- Dagster
Ideale per la creazione programmatica di pipeline di dati


Come valuto gli strumenti per il tracciamento degli esperimenti di ML
Divido la mia valutazione in due livelli: ciò che ogni strumento deve necessariamente fare (come il logging automatico delle esecuzioni PyTorch) e ciò che distingue i migliori tool.
Funzionalità di base (Requisiti minimi per questa lista)
Quando seleziono gli strumenti per la mia lista, assegno a ciascuno un punteggio da 0 (non offre la funzionalità) a 5 (eccelle in quell'area) per ogni funzionalità di base elencata di seguito. Poi calcolo il punteggio totale dello strumento come percentuale. Ogni tool deve raggiungere un punteggio minimo totale del 65% per essere preso in considerazione.
- Registrazione degli esperimenti: Controllo se lo strumento acquisisce automaticamente metriche, iperparametri e telemetria a livello di sistema dalle esecuzioni di training o se richiede l'inserimento manuale tramite SDK per ogni dato.
- Confronto e visualizzazione delle esecuzioni: Tabelle di confronto affiancato sono solo un punto di partenza; cerco grafici interattivi come i diagrammi delle coordinate parallele che aiutano a individuare pattern tra decine di esecuzioni nei progetti ML.
- Versionamento di artefatti e modelli: Valuto come ciascun tool gestisce le versioni di dataset, checkpoint di modello e output, incluso se collega gli artefatti all'esecuzione specifica che li ha prodotti.
- Supporto per i framework di ML: Lo strumento dovrebbe coprire i framework effettivamente usati dal tuo team, da PyTorch e TensorFlow a Hugging Face Transformers e XGBoost, con un codice wrapper minimo.
- Riproducibilità e tracciabilità: Cerco strumenti che catturino commit di codice, snapshot delle dipendenze e stato dei dataset insieme, in modo da poter rieseguire un esperimento di sei mesi fa ottenendo lo stesso risultato.
- Collaborazione e condivisione: Per team in fusi orari diversi sono fondamentali workspace condivisi, accessi basati su ruoli e la possibilità di commentare o condividere esecuzioni specifiche senza esportare CSV avanti e indietro.
Dopo aver stilato la lista degli strumenti che rispettano questi criteri, passo a considerare cosa distingue davvero ciascuna piattaforma.
Fattori distintivi (Cosa differenzia i vendor)
Ecco come metto a confronto i diversi fornitori:
Funzionalità uniche
L'ottimizzazione degli iperparametri è un fattore chiave di differenziazione. Cerco funzionalità di sweep integrate che automatizzino la ricerca su più esecuzioni distribuite e visualizzino le performance delle diverse configurazioni in un'unica vista. Anche il monitoraggio live delle risorse può aggiungere molto valore: quando puoi tenere sotto controllo GPU e memoria mentre l'addestramento è in corso, puoi individuare colli di bottiglia prima di sprecare ore di calcolo. Infine, report collaborativi sono fondamentali per i team numerosi: dashboard condivisibili sostituiscono i fogli di calcolo manuali e consentono a data scientist e stakeholder di discutere i risultati senza cambiare strumenti.
Oltre le funzionalità
La flessibilità di deployment è più importante di quanto molte squadre si aspettino. Valuto se uno strumento supporta installazioni self-hosted o ambienti isolati (air-gapped) per team che lavorano con IP sensibile o dati regolamentati. La scalabilità è un altro aspetto che considero: il logging di migliaia di esecuzioni concorrenti non dovrebbe degradare le prestazioni delle query o provocare picchi di costo imprevedibili. Anche l'esperienza d'onboarding distingue gli strumenti: ottime guide rapide e forum comunitari attivi consentono al team di strumentare gli script di training in ore, non settimane.
Come scegliere gli strumenti per il tracciamento degli esperimenti ML
È facile perdersi fra lunghe liste di funzionalità e strutture di prezzo complesse. Per aiutarti a rimanere concentrato nel tuo processo unico di selezione software, ecco una checklist di fattori da tenere a mente:
| Fattore | Cosa valutare |
|---|---|
| Scalabilità | Lo strumento è in grado di gestire il volume e la frequenza degli esperimenti che ti aspetti con la crescita del team e dei dati? |
| Integrazioni | Si collega direttamente ai tuoi framework ML preferiti, agli strumenti di orchestrazione e ai sistemi di deployment? |
| Personalizzazione | Puoi adattare i campi dei metadati, i passaggi di workflow e i rapporti alle esigenze specifiche del tuo team? |
| Facilità d’uso | I tuoi ricercatori e ingegneri troveranno l’interfaccia intuitiva, o c’è una curva di apprendimento ripida? |
| Implementazione e onboarding | Quanto velocemente puoi passare dall’acquisto al tracciamento del primo esperimento? Quali risorse sono necessarie per configurarlo? |
| Costo | I prezzi basati sull’utilizzo, le tariffe di storage o gli add-on necessari sono chiari e prevedibili per le tue esigenze future? |
| Tutele di sicurezza | Lo strumento supporta la crittografia, permessi granulari e autenticazione per proteggere i dati sensibili? |
| Requisiti di conformità | Lo strumento ti aiuta a soddisfare regolamenti per settore, cliente o area geografica (SOC 2, ISO 27001, GDPR)? |
Cosa sono gli strumenti per il tracciamento degli esperimenti ML?
Gli strumenti per il tracciamento degli esperimenti ML sono piattaforme software che registrano, organizzano e versionano gli esperimenti di modelli di machine learning, inclusi i relativi parametri, codice, dataset e metriche. Questi strumenti aiutano il tuo team a conservare la cronologia degli esperimenti, confrontare i risultati e riprodurre completamente esecuzioni passate, facilitando la collaborazione e l’audit man mano che i flussi di lavoro dei progetti diventano più complessi.
Funzionalità degli strumenti per il tracciamento degli esperimenti ML
Quando si scelgono strumenti di tracciamento degli esperimenti di ML, è importante prestare attenzione alle seguenti funzionalità chiave:
- Registrazione degli esperimenti: Registra i parametri di ogni sessione di addestramento, le configurazioni, i riferimenti al codice sorgente e le metriche per mantenere una chiara tracciabilità.
- Confronto tra esecuzioni: Consente di visualizzare e analizzare più esperimenti fianco a fianco per capire come diverse impostazioni o cambiamenti influenzano i risultati.
- Versionamento degli artefatti: Versiona automaticamente i dataset, i modelli di ML versionati e altri output, permettendo di riprodurre o migliorare il lavoro passato.
- Integrazione con framework: Si connette direttamente ai principali framework di ML, facilitando l'avvio del tracciamento con minime modifiche al proprio workflow.
- Tracciamento della provenienza: Mappa l'intera catena dal dato grezzo al modello finale, supportando la riproducibilità e i requisiti di compliance normativa.
- Strumenti di collaborazione: Permette a più utenti di commentare, documentare le intuizioni e condividere i risultati con il team.
- Metadati personalizzati: Consente di aggiungere campi o tag specifici di progetto, così puoi classificare gli esperimenti secondo le esigenze del tuo workflow.
- Controllo degli accessi basato sui ruoli: Restringe l'accesso a dati e azioni sensibili, supportando la governance e gli standard di sicurezza a livello organizzativo.
- Dashboard e visualizzazioni: Genera report personalizzabili e visualizzazioni dei dati per evidenziare rapidamente tendenze e anomalie nei dati degli esperimenti.
- Ricerca e filtri: Permette al team di trovare facilmente esperimenti, sessioni e artefatti rilevanti per parametro, data o altri criteri, facendo risparmiare tempo man mano che il progetto cresce.
Funzionalità AI comuni negli strumenti di tracciamento degli esperimenti di ML
Oltre alle funzionalità standard elencate sopra, molti di questi strumenti stanno integrando l’IA con funzionalità come:
- Rilevamento automatico delle anomalie: Utilizza l’IA per monitorare le metriche degli esperimenti e segnalare pattern insoliti o valori anomali, aiutando i team a individuare per tempo derive nei dati o comportamenti inattesi del modello.
- Suggerimenti intelligenti degli iperparametri: Applica il machine learning per consigliare valori ottimali di iperparametri in base ai dati sperimentali storici, riducendo tentativi manuali e velocizzando la calibrazione del modello.
- Query sugli esperimenti in linguaggio naturale: Permette agli utenti di cercare e filtrare esperimenti usando un linguaggio conversazionale, facilitando l’accesso e la comprensione dei risultati anche ai non tecnici.
- Allocazione predittiva delle risorse: Utilizza l'IA per prevedere i bisogni di calcolo e memoria per le future esecuzioni, aiutando la pianificazione delle risorse ed evitando colli di bottiglia.
- Riepilogo automatico degli esperimenti: Sfrutta l’intelligenza artificiale per generare sintesi concise dei risultati degli esperimenti, evidenziando i punti chiave e le tendenze per una reportistica e un processo decisionale più rapido.
Vantaggi degli strumenti di tracciamento degli esperimenti di ML
L’implementazione di strumenti di tracciamento degli esperimenti di ML offre numerosi vantaggi per il tuo team e la tua azienda. Ecco alcuni dei benefici a cui puoi andare incontro:
- Riproducibilità degli esperimenti: Tracciando parametri, dataset e dettagli dell’ambiente, puoi ricreare e validare facilmente esperimenti precedenti.
- Collaborazione semplificata: Dashboard condivisi, commenti e documentazione di progetto favoriscono una collaborazione efficace e la comunicazione dei risultati nel team.
- Sviluppo modelli più rapido: I confronti affiancati tra sessioni e il versionamento automatico degli artefatti accelerano il ciclo degli esperimenti e le decisioni.
- Gestione centralizzata delle conoscenze: Tutta la storia del progetto e i metadati degli esperimenti sono conservati in un unico luogo, preservando il know-how anche con la crescita del team.
- Migliore compliance e auditabilità: Il tracciamento della provenienza integrato e i log di audit soddisfano i bisogni regolatori e gli standard di governance aziendale.
- Controllo dei costi delle risorse: Il monitoraggio live delle risorse e le funzioni di allocazione predittiva consentono ai team di ottimizzare l’utilizzo dell’hardware evitando sprechi.
- Supporto a workflow personalizzabili: Campi di metadati flessibili e opzioni di workflow si adattano ai processi e alle preferenze del tuo team.
Costi e prezzi degli strumenti di tracciamento degli esperimenti di ML
La scelta degli strumenti di tracciamento degli esperimenti di ML richiede la comprensione dei vari modelli e piani tariffari disponibili. I costi variano in base a funzionalità, dimensione del team, componenti aggiuntivi e altro ancora. La tabella seguente riassume i piani più comuni, i loro prezzi medi e le tipiche funzionalità incluse nelle soluzioni di strumenti per il tracciamento degli esperimenti di ML:
Tabella comparativa dei piani per strumenti di tracciamento degli esperimenti di ML
| Tipo di piano | Prezzo medio | Funzionalità comuni |
|---|---|---|
| Piano gratuito | $0 | Monitoraggio di esperimenti di base, utenti limitati, supporto dalla community e progetti pubblici. |
| Piano personale | $5-$25/utente/mese | Esperimenti illimitati, spazio di archiviazione maggiore, progetti privati e integrazioni di base. |
| Piano business | $30-$70/utente/mese | Strumenti di collaborazione di squadra, accesso basato sui ruoli, integrazioni avanzate, sicurezza potenziata e registri di controllo. |
| Piano enterprise | $80-$150/utente/mese | Opzioni di distribuzione personalizzate, SSO/SAML, strumenti di conformità, supporto premium e personalizzazione avanzata. |
Domande frequenti sugli strumenti di monitoraggio degli esperimenti ML
Ecco alcune risposte alle domande più comuni sugli strumenti di monitoraggio degli esperimenti ML:
Questi strumenti richiedono molta configurazione o modifiche al codice?
No, la maggior parte degli strumenti offre SDK leggeri o plugin che ti permettono di iniziare a registrare gli esperimenti con minime modifiche al codice. Spesso puoi integrare il monitoraggio nei tuoi script con poche righe di codice.
Come questi strumenti aiutano con la conformità del team e gli audit?
Registrano i parametri, il codice e i risultati di ogni esecuzione, creano storici degli esperimenti tracciabili e mantengono tracce di controllo—rendendo più semplice documentare la conformità e condividere evidenze durante revisioni o audit.
Queste soluzioni funzionano con i notebook Jupyter?
Sì, la maggior parte degli strumenti di monitoraggio degli esperimenti ML è progettata per funzionare direttamente nei notebook Jupyter, così come con script e pipeline, quindi non è necessario cambiare il proprio flusso di lavoro.
Cosa succede se il mio team supera il piano gratuito?
Puoi passare a un piano a pagamento per ottenere più utenti, limiti di archiviazione più elevati, integrazioni avanzate e funzionalità enterprise. Esamina attentamente i prezzi per non essere sorpreso dal passaggio.
Posso archiviare dati sensibili o proprietari con questi strumenti?
Sì, ma dovresti esaminare le misure di sicurezza del fornitore come crittografia, controlli di accesso e certificazioni di conformità per assicurarti che i tuoi dati restino protetti. Opzioni on-premise o su cloud privato possono offrire ancora più controllo.