Le 10 migliori alternative a New Relic recensite nel 2026

Migliori alternative a New Relic - Shortlist


-

TestDevLab
Visit Website -
Site24x7
Visit WebsiteThis is an aggregated rating for this tool including ratings from Crozdesk users and ratings from other sites.4.7 -
GitHub Actions
Visit WebsiteThis is an aggregated rating for this tool including ratings from Crozdesk users and ratings from other sites.4.8


Se gestisci un team tecnologico, sai quanto gli strumenti giusti possano fare la differenza. Detto questo, forse New Relic non soddisfa più le tue esigenze o il budget a disposizione. Qualunque sia il motivo, trovare alternative può essere davvero una sfida.
Ho dedicato tempo a testare e recensire diverse soluzioni software per offrirti valutazioni imparziali e approfondite, basate sulla ricerca. In questo articolo troverai le migliori alternative a New Relic che si adattano meglio al tuo business.
Voglio aiutarti a scegliere lo strumento giusto per le sfide del tuo team. Avrai un quadro chiaro dei punti di forza e delle debolezze di ogni software. Quindi, tuffiamoci insieme alla ricerca della soluzione migliore per te.
Cos’è New Relic?
New Relic è una piattaforma di osservabilità che aiuta le aziende a monitorare, individuare e ottimizzare le prestazioni dei software. È comunemente utilizzata da professionisti IT, sviluppatori e site reliability engineer che vogliono garantire il funzionamento ottimale delle applicazioni.
Grazie a insight basati sull’Intelligenza Artificiale, New Relic prevede potenziali problemi e rileva anomalie prima che abbiano un impatto sugli utenti. Sostenendo diversi linguaggi di programmazione, framework e piattaforme cloud, consente di allineare le prestazioni tecniche con i risultati di business per migliorare l’esperienza dei clienti e l’efficienza operativa.
Perché fidarti delle nostre recensioni software
Testiamo e recensiamo software di sviluppo SaaS dal 2023. In quanto esperti del settore, sappiamo quanto sia critico e difficile prendere la decisione giusta nella scelta di un software. Investiamo tempo in ricerche approfondite per aiutare la nostra audience a compiere le migliori scelte d’acquisto.
Abbiamo testato oltre 2.000 strumenti per diversi casi d’uso nello sviluppo SaaS e scritto più di 1.000 recensioni approfondite. Scopri come garantiamo la trasparenza e dai un’occhiata alla nostra metodologia di valutazione del software.
Riepilogo delle migliori alternative a New Relic
Questa tabella comparativa sintetizza i dettagli sui prezzi delle migliori alternative a New Relic per aiutarti a trovare quella più adatta al tuo budget e alle esigenze aziendali.rn
| Tool | Best For | Trial Info | Price | ||
|---|---|---|---|---|---|
| 1 | Ideale per il tracciamento degli errori nelle app | Piano gratuito + prova gratuita + demo gratuita disponibili | A partire da $26/mese (fatturato annualmente) | Website | |
| 2 | Ideale per il monitoraggio reale degli utenti | Prova gratuita di 30 giorni + demo gratuita disponibile | Da $10/mese (fatturazione annuale) | Website | |
| 3 | Ideale per analisi basate sull'IA | Prova gratuita di 30 giorni + demo gratuita + piano gratuito disponibili | Da $199/anno | Website | |
| 4 | Ideale per architettura senza agenti | Prova gratuita di 15 giorni | A partire da $16/unità ibrida/mese | Website | |
| 5 | Ideale per integrazione con AWS | Prova gratuita di 30 giorni | A partire da $99.90/mese (10 host, 100 container) | Website | |
| 6 | Ideale per il tracing distribuito | Not available | Prezzi su richiesta | Website | |
| 7 | Ideale per scalabilità economica | Piano gratuito disponibile | Prezzo su richiesta | Website | |
| 8 | Ideale per il monitoraggio multi-fonte | Piano gratuito disponibile | Da $19/mese + consumo | Website | |
| 9 | Ideale per il monitoraggio di rete | Demo gratuita + prova gratuita di 30 giorni disponibile | Da $179/mese (fatturati annualmente) | Website | |
| 10 | Ideale per la gestione remota | Prova gratuita di 30 giorni | A partire da $145/mese (fatturato annualmente) | Website |
-
TestDevLab
Visit Website -
Site24x7
Visit WebsiteThis is an aggregated rating for this tool including ratings from Crozdesk users and ratings from other sites.4.7 -
GitHub Actions
Visit WebsiteThis is an aggregated rating for this tool including ratings from Crozdesk users and ratings from other sites.4.8
Recensioni delle migliori alternative a New Relic
Qui sotto trovi i miei riassunti dettagliati delle migliori alternative a New Relic presenti nella shortlist. Le recensioni analizzano attentamente le caratteristiche chiave, pro e contro, integrazioni e casi d’uso ideali di ogni strumento per aiutarti nella scelta.
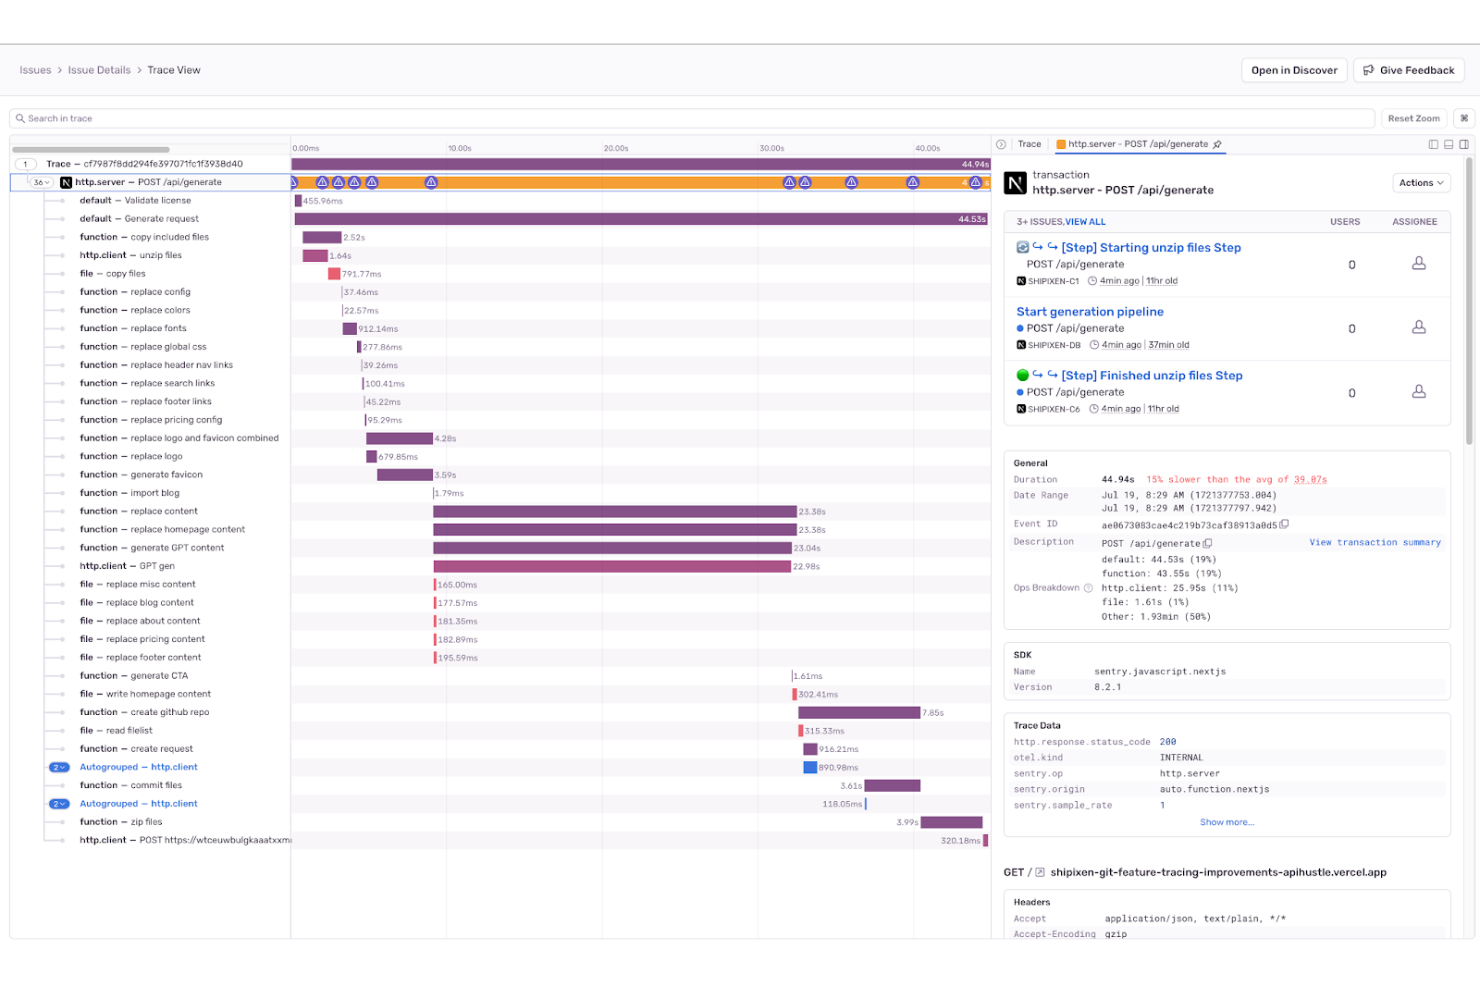
Sentry è uno strumento di monitoraggio delle applicazioni focalizzato sul tracciamento degli errori e sulla gestione delle prestazioni. Viene ampiamente utilizzato da sviluppatori e team di ingegneria per identificare e risolvere bug in tempo reale.
Perché è una buona alternativa a New Relic: Sentry eccelle nel tracciamento degli errori, rendendolo ideale per i team che si concentrano sul debug delle applicazioni. I suoi avvisi di errore in tempo reale permettono al tuo team di rispondere rapidamente ai problemi, riducendo al minimo i tempi di inattività. Con report dettagliati sugli errori, puoi facilmente risalire alla causa di un problema. L'attenzione di Sentry sui parametri di salute del software offre un vantaggio distintivo rispetto al monitoraggio delle prestazioni più generico di New Relic.
Funzionalità principali & integrazioni:
Le funzionalità includono avvisi di errore in tempo reale, report dettagliati sugli errori e monitoraggio delle prestazioni. Troverai utile il raggruppamento dei problemi per gestire in modo efficiente errori correlati. Sentry offre anche il tracciamento delle release per aiutarti a correlare gli errori con i nuovi deployment di codice.
Le integrazioni includono GitHub, GitLab, Bitbucket, Jira, Slack, Trello, Asana, Microsoft Teams, Zendesk e PagerDuty.
Pros and Cons
Pros:
- Ottime capacità di tracciamento degli errori
- Avvisi in tempo reale
- Raggruppamento efficiente dei problemi
Cons:
- Richiede configurazione e setup
- Può richiedere competenze tecniche
New Product Updates from Sentry

Sentry Adds Heatmaps to Application Metrics
Sentry introduced heatmaps for Application Metrics to visualize metric value distributions over time, helping teams spot patterns like latency bursts and use heatmaps in Custom Dashboards. For more information, visit Sentry's official site.
 .
.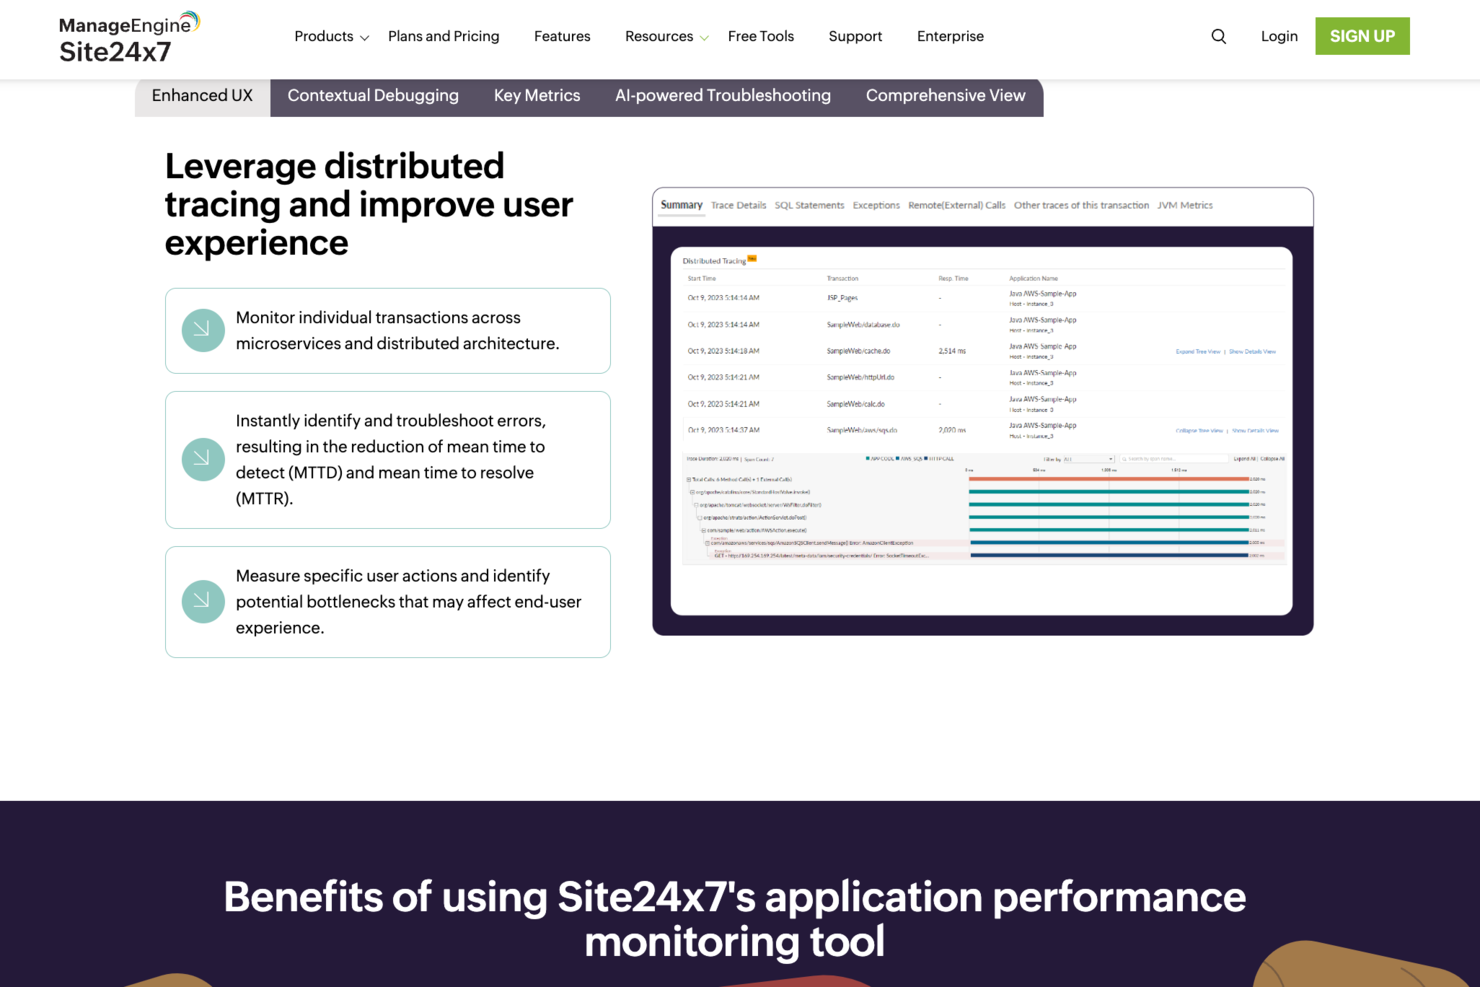
Per chi cerca un'alternativa affidabile a New Relic, Site24x7 offre una soluzione interessante pensata per soddisfare le diverse esigenze dei team IT e DevOps. Si rivolge ad aziende di tutte le dimensioni, fornendo strumenti essenziali per monitorare le prestazioni dei siti web, l'efficienza delle applicazioni e lo stato della rete. Grazie ai suoi prezzi competitivi e all'ampio set di funzionalità, Site24x7 affronta le comuni sfide della gestione dell'infrastruttura IT, rendendolo una scelta attraente per i professionisti che desiderano ottimizzare le proprie capacità di monitoraggio.
Perché ho scelto Site24x7
Ho scelto Site24x7 come alternativa a New Relic perché offre una piattaforma di osservabilità unificata che copre in modo efficiente una vasta gamma di esigenze di monitoraggio. La funzione di monitoraggio delle prestazioni applicative consente di ottenere approfondimenti sullo stato delle applicazioni e individuare i problemi a livello di codice, garantendo prestazioni ottimali. Inoltre, la funzionalità di monitoraggio reale degli utenti (RUM) offre visibilità sull'esperienza finale dell'utente, permettendo di capire come le applicazioni si comportano dal punto di vista dell'utilizzatore. Queste capacità, unite al suo carattere economico, rendono Site24x7 un forte concorrente per chi cerca una soluzione di monitoraggio completa.
Caratteristiche principali di Site24x7
Oltre alle robuste funzionalità già menzionate, Site24x7 offre numerose altre caratteristiche che ne aumentano l'utilità come strumento di monitoraggio:
- Gestione dei log: questa funzione consente di raccogliere, analizzare e gestire i log provenienti da varie fonti, aiutandoti a individuare e risolvere rapidamente eventuali problemi.
- Monitoraggio della rete: puoi monitorare il traffico di rete e le prestazioni, assicurandoti che la tua infrastruttura di rete funzioni in modo fluido ed efficiente.
- Gestione dei costi cloud: questa funzionalità ti aiuta a gestire e ottimizzare la spesa per il cloud, offrendo una panoramica sui costi dell'infrastruttura cloud.
- Comunicazione sugli incidenti: Site24x7 facilita la comunicazione durante gli incidenti, assicurando che i membri giusti del team vengano avvisati e possano rispondere tempestivamente.
Integrazioni Site24x7
Site24x7 si integra con strumenti popolari come ServiceNow, PagerDuty, Slack, Microsoft Teams, AWS, Azure, Kubernetes, Nagios e MySQL. Queste integrazioni consentono una comunicazione fluida e un monitoraggio efficiente in tutto l'ecosistema IT.
Pros and Cons
Pros:
- Ampia copertura di monitoraggio tutto-in-uno
- Approfondimenti dal monitoraggio reale degli utenti
- Potente APM con visibilità sul codice
Cons:
- L'interfaccia può risultare caotica
- Complessità nella configurazione delle funzionalità avanzate
New Product Updates from Site24x7
Site24x7 Adds Synchronization Statuses for MSPs
Site24x7 now provides MSPs enhanced alerts and synchronization statuses in a centralized notification center to spot configuration sync issues sooner and accelerate incident response. For more information, visit Site24x7's official site.

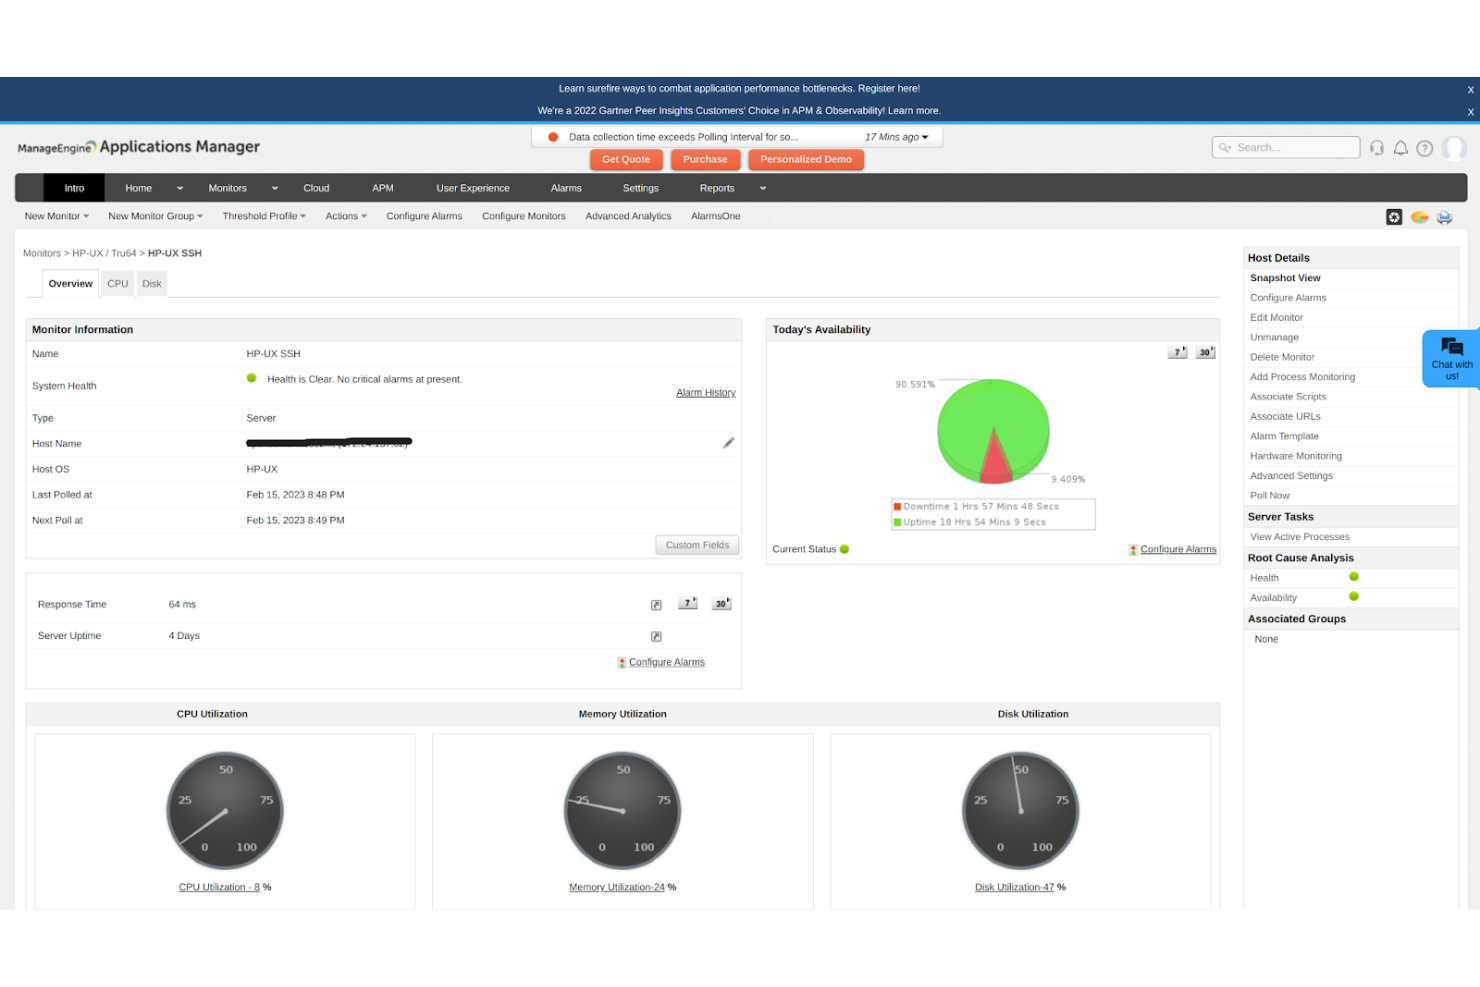
ManageEngine Applications Manager è una soluzione per il monitoraggio delle prestazioni delle applicazioni, progettata per i team operativi IT e gli amministratori di sistema. Aiuta il tuo team a garantire la disponibilità e le prestazioni di applicazioni e infrastrutture tramite monitoraggio e analisi.
Perché è una valida alternativa a New Relic: ManageEngine Applications Manager si distingue grazie ad analisi basate sull'intelligenza artificiale, offrendo approfondimenti predittivi sulle prestazioni delle applicazioni. Questa funzionalità consente al tuo team di anticipare i problemi potenziali prima che impattino gli utenti. Lo strumento offre capacità di monitoraggio complete che coprono sia le applicazioni sia l'infrastruttura. A differenza di New Relic, ManageEngine Applications Manager fornisce un approccio più integrato al monitoraggio di ambienti IT eterogenei.
Funzionalità e integrazioni principali:
Le funzionalità includono scoperta delle applicazioni, dashboard business view e pianificazione della capacità. Puoi impostare avvisi per notificare eventuali deviazioni dalle prestazioni. ManageEngine Applications Manager supporta anche il monitoraggio delle transazioni sintetiche, aiutandoti a simulare le interazioni degli utenti.
Le integrazioni includono AWS, Microsoft Azure, Google Cloud, VMware, Docker, Oracle, SAP, Microsoft SQL Server, JBoss e IBM WebSphere.
Pros and Cons
Pros:
- Approfondimenti predittivi basati sull'IA
- Capacità di monitoraggio complete
- Supporta transazioni sintetiche
Cons:
- Template predefiniti limitati
- Può richiedere competenze tecniche
New Product Updates from ManageEngine Applications Manager
Oracle Cloud Application Monitoring Now Available in ManageEngine Applications Manager
ManageEngine Applications Manager introduces Oracle Cloud Application Monitoring, Oracle Cloud Function Monitoring, and Oracle Cloud NAT Gateway Monitoring. These new capabilities help teams monitor Oracle Cloud applications, serverless workloads, and network resources from a single platform. For more information, visit ManageEngine Applications Manager's official site.
 .
.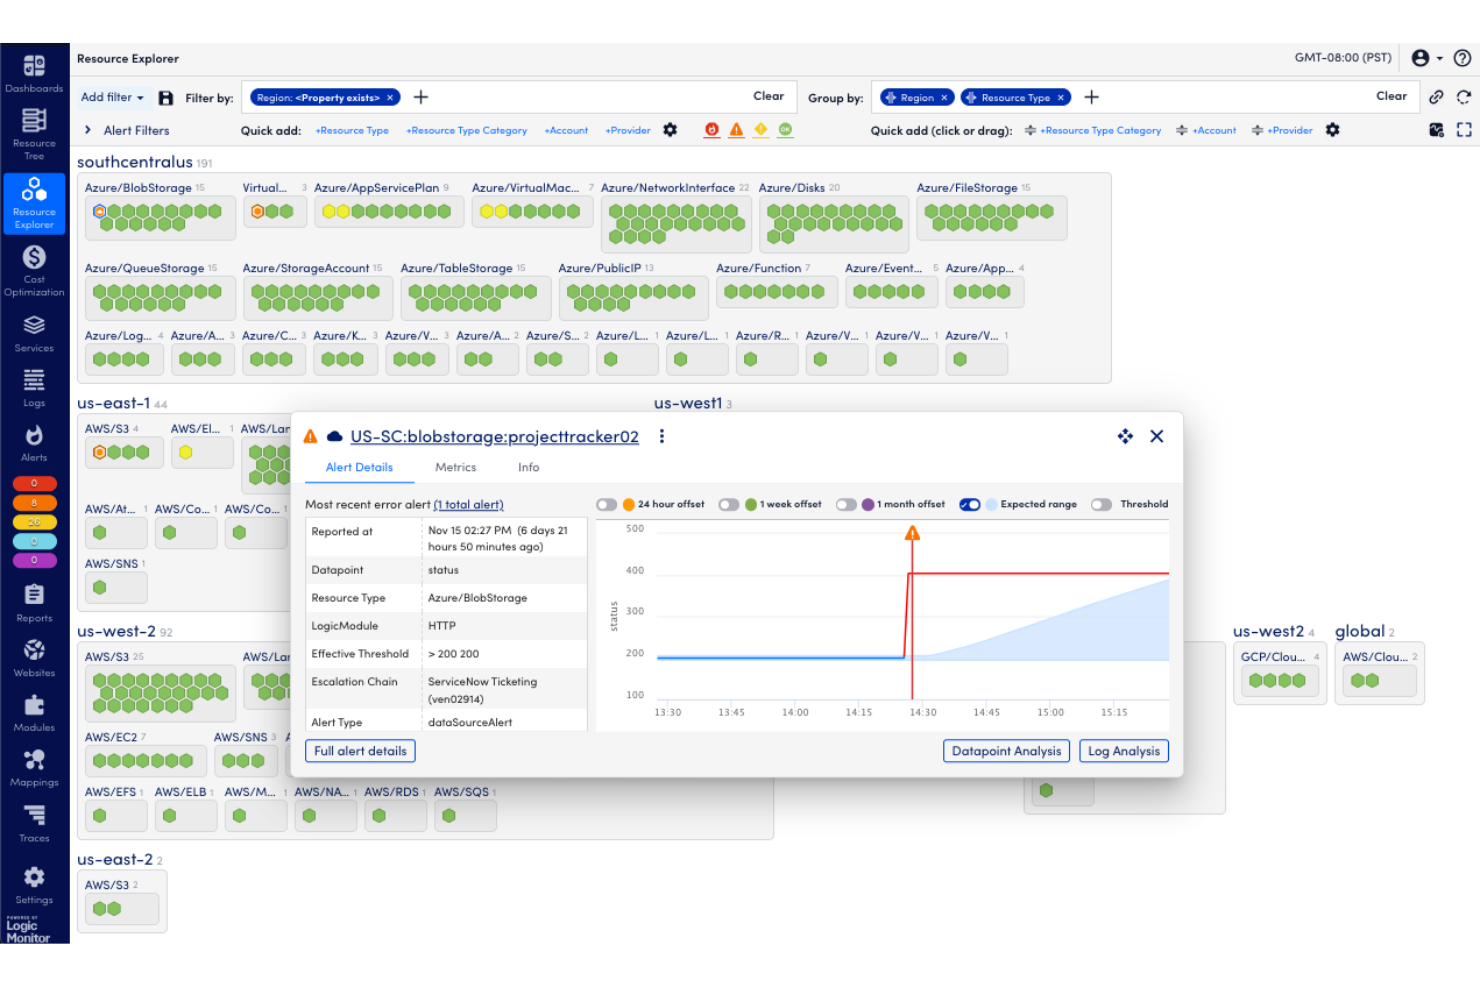
LogicMonitor è una piattaforma di monitoraggio dell'infrastruttura basata su cloud per team IT e amministratori di rete. Offre soluzioni di monitoraggio per reti, server e ambienti cloud, aiutandoti a mantenere prestazioni ottimali.
Perché è una valida alternativa a New Relic: LogicMonitor utilizza un'architettura senza agenti, semplificando il deployment e riducendo il carico per il tuo team IT. Fornisce il monitoraggio in tempo reale dell'intera infrastruttura, offrendo dettagliate informazioni sulle prestazioni del sistema. Puoi identificare e risolvere rapidamente i problemi grazie a dashboard personalizzabili e avvisi automatici. A differenza di New Relic, l'attenzione di LogicMonitor al deployment senza agenti lo rende una scelta flessibile per ambienti diversi.
Funzionalità e integrazioni principali:
Le funzionalità includono rilevamento automatico, previsione delle prestazioni e rilevamento delle anomalie. Puoi usarlo per monitorare metriche su vari dispositivi e applicazioni. LogicMonitor offre anche analisi predittive per aiutarti a pianificare le future esigenze di capacità.
Le integrazioni includono Amazon Web Services, Microsoft Azure, Google Cloud Platform, VMware, Cisco Meraki, Dell EMC, NetApp, Nutanix, ServiceNow e Slack.
Pros and Cons
Pros:
- Deployment senza agenti
- Monitoraggio in tempo reale
- Analisi predittive
Cons:
- Richiede configurazione iniziale
- Monitoraggio delle prestazioni applicative limitato
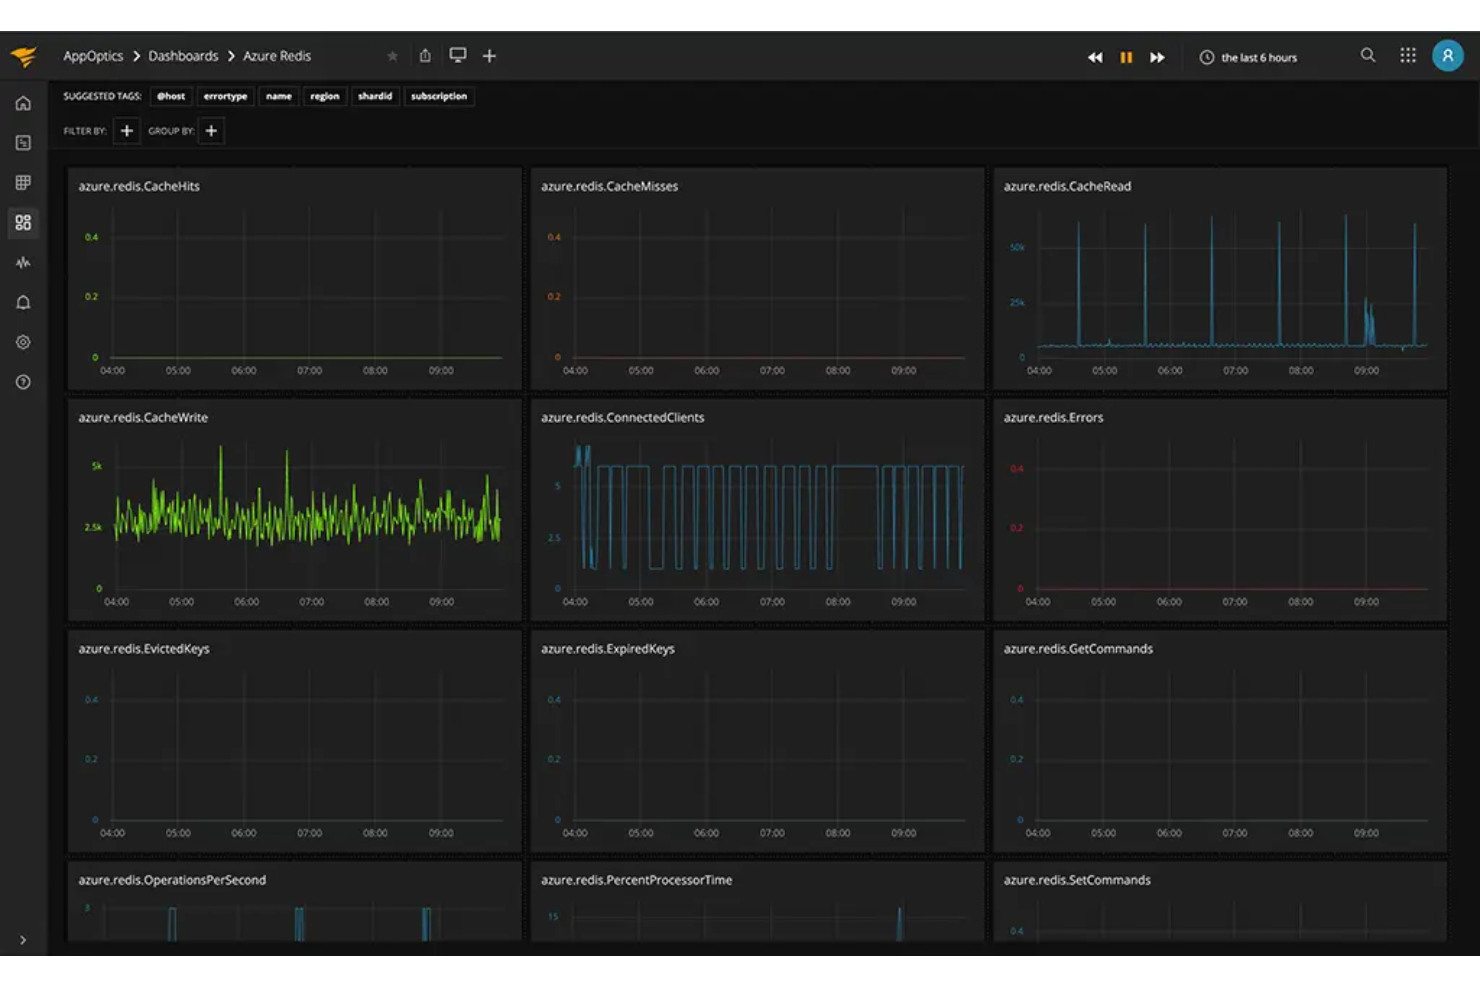
SolarWinds AppOptics è uno strumento di monitoraggio delle prestazioni applicative per professionisti IT e sviluppatori. Offre una visibilità end-to-end sulla tua infrastruttura e sulle prestazioni delle applicazioni, aiutandoti a monitorare e ottimizzare il funzionamento dei sistemi.
Perché è una valida alternativa a New Relic: SolarWinds AppOptics è noto per la sua solida integrazione con AWS, il che lo rende ideale per i team che fanno grande affidamento su Amazon Web Services. Offre un monitoraggio dettagliato dei servizi AWS, permettendo al tuo team di tracciare le metriche di prestazione in tempo reale. Con dashboard personalizzabili, puoi adattare le visualizzazioni alle tue esigenze specifiche. A differenza di New Relic, AppOptics si concentra sulla semplificazione del monitoraggio AWS grazie a integrazioni predefinite.
Funzionalità e integrazioni principali:
Funzionalità comprendono dashboard personalizzabili, metriche in tempo reale e tracing distribuito. Puoi configurare avvisi per essere notificato quando vengono raggiunte soglie di prestazione. SolarWinds AppOptics supporta anche il rilevamento delle anomalie, aiutandoti a identificare pattern insoliti nei dati.
Integrazioni includono AWS, Microsoft Azure, Google Cloud, Docker, Kubernetes, VMware, Apache, Nginx, Tomcat e MySQL.
Pros and Cons
Pros:
- Integrazione avanzata con AWS
- Metriche di prestazione in tempo reale
- Dashboard personalizzabili
Cons:
- Monitoraggio limitato al di fuori di AWS
- Può essere esigente in termini di risorse
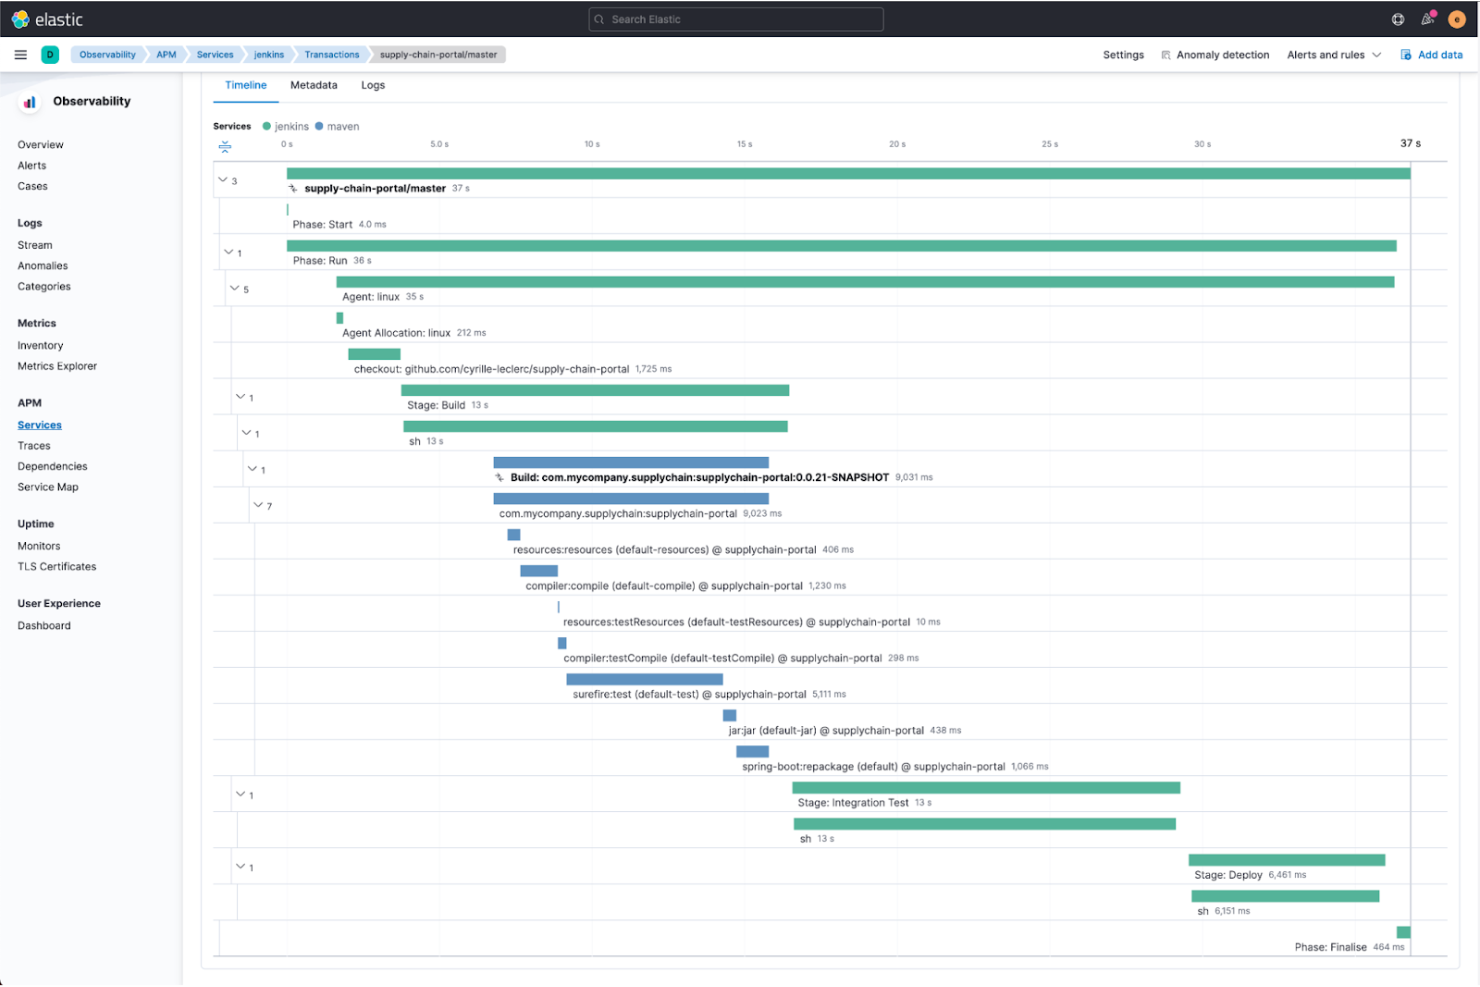
Elastic APM è uno strumento di monitoraggio delle prestazioni per sviluppatori e team IT. Ti aiuta a tracciare e analizzare le prestazioni delle applicazioni, assicurando che i tuoi sistemi funzionino in modo efficiente.
Perché è una buona alternativa a New Relic: Elastic APM offre il tracing distribuito, ideale per monitorare sistemi complessi. Questa funzionalità consente al tuo team di tracciare le richieste attraverso vari servizi, offrendo una visione chiara dei colli di bottiglia delle prestazioni. Il monitoraggio in tempo reale e le dashboard personalizzabili migliorano ulteriormente la visibilità sulle tue applicazioni.
Funzionalità principali e integrazioni:
Le funzionalità includono monitoraggio in tempo reale, dashboard personalizzabili e rilevamento automatico delle anomalie. Puoi visualizzare i dati sulle prestazioni con un tracciamento dettagliato delle transazioni, offrendo al tuo team approfondimenti sul comportamento delle applicazioni. Elastic APM supporta inoltre agenti open-source, offrendo flessibilità nel monitoraggio.
Le integrazioni includono Kibana, Elasticsearch, Beats, Logstash, AWS, Azure, Google Cloud, Docker, Kubernetes e OpenTelemetry.
Pros and Cons
Pros:
- Funzionalità di tracing distribuito
- Tracciamento dettagliato delle transazioni
- Supporto per agenti open-source
Cons:
- Può essere ad elevato consumo di risorse
- Può richiedere competenze tecniche per l'installazione
Amazon CloudWatch è un servizio di monitoraggio e osservabilità progettato per sviluppatori e team IT che utilizzano AWS. Aiuta a raccogliere e tracciare metriche, monitorare i file di log e impostare allarmi per mantenere in funzione le risorse AWS senza interruzioni.
Perché è una valida alternativa a New Relic: Amazon CloudWatch offre alle organizzazioni la possibilità di scalare in modo economico. Si integra con i servizi AWS, risultando ideale per i team fortemente investiti nell’ecosistema Amazon. Fornisce funzionalità di monitoraggio dettagliato e di gestione degli allarmi per tenere sotto controllo le risorse AWS in tempo reale. Puoi mantenere le operazioni con funzionalità come azioni automatizzate e rilevamento delle anomalie. A differenza di New Relic, l’integrazione profonda di Amazon CloudWatch con AWS offre una soluzione più personalizzata per gli utenti AWS.
Funzionalità principali & integrazioni:
Le funzionalità includono azioni automatizzate, rilevamento delle anomalie e dashboard personalizzate. Puoi creare allarmi per reagire ai cambiamenti nel tuo ambiente AWS. Amazon CloudWatch offre anche approfondimenti dettagliati sui log delle tue applicazioni.
Le integrazioni includono Amazon EC2, Amazon RDS, Amazon S3, AWS Lambda, Amazon ECS, Amazon EKS, Amazon DynamoDB, Amazon CloudFront, Amazon Route 53 e Amazon Elastic Load Balancing.
Pros and Cons
Pros:
- Forte integrazione con AWS
- Capacità di monitoraggio dettagliate
- Funzione di azioni automatizzate
Cons:
- Può essere impegnativo in termini di risorse
- Curva di apprendimento più ripida

Grafana è uno strumento di visualizzazione e analisi progettato per sviluppatori e team IT. Offre dashboard potenti per visualizzare dati da più fonti, aiutandoti a monitorare e analizzare in modo efficace le metriche delle prestazioni.
Perché è una buona alternativa a New Relic: Grafana offre il monitoraggio multi-fonte, permettendo di visualizzare dati provenienti da vari database e applicazioni in un unico luogo. Le sue dashboard personalizzabili consentono al tuo team di mostrare le metriche più importanti. Le funzionalità di avviso di Grafana ti avvisano dei problemi di prestazione non appena si presentano. A differenza di New Relic, l'approccio open-source di Grafana offre una soluzione più flessibile per la visualizzazione dei dati.
Funzionalità e integrazioni principali:
Le funzionalità includono dashboard personalizzabili, meccanismi di avviso e supporto per più fonti di dati. Puoi creare dashboard dinamiche su misura per le tue esigenze specifiche. Grafana offre anche opzioni per condividere e collaborare sulle dashboard all'interno del tuo team.
Le integrazioni includono Prometheus, InfluxDB, Graphite, MySQL, PostgreSQL, Elasticsearch, AWS Amazon CloudWatch, Azure Monitor, Google Cloud e Loki.
Pros and Cons
Pros:
- Dashboard personalizzabili
- Supporta più fonti di dati
- Flessibilità open-source
Cons:
- Funzionalità pronte all'uso limitate
- Curva di apprendimento più ripida
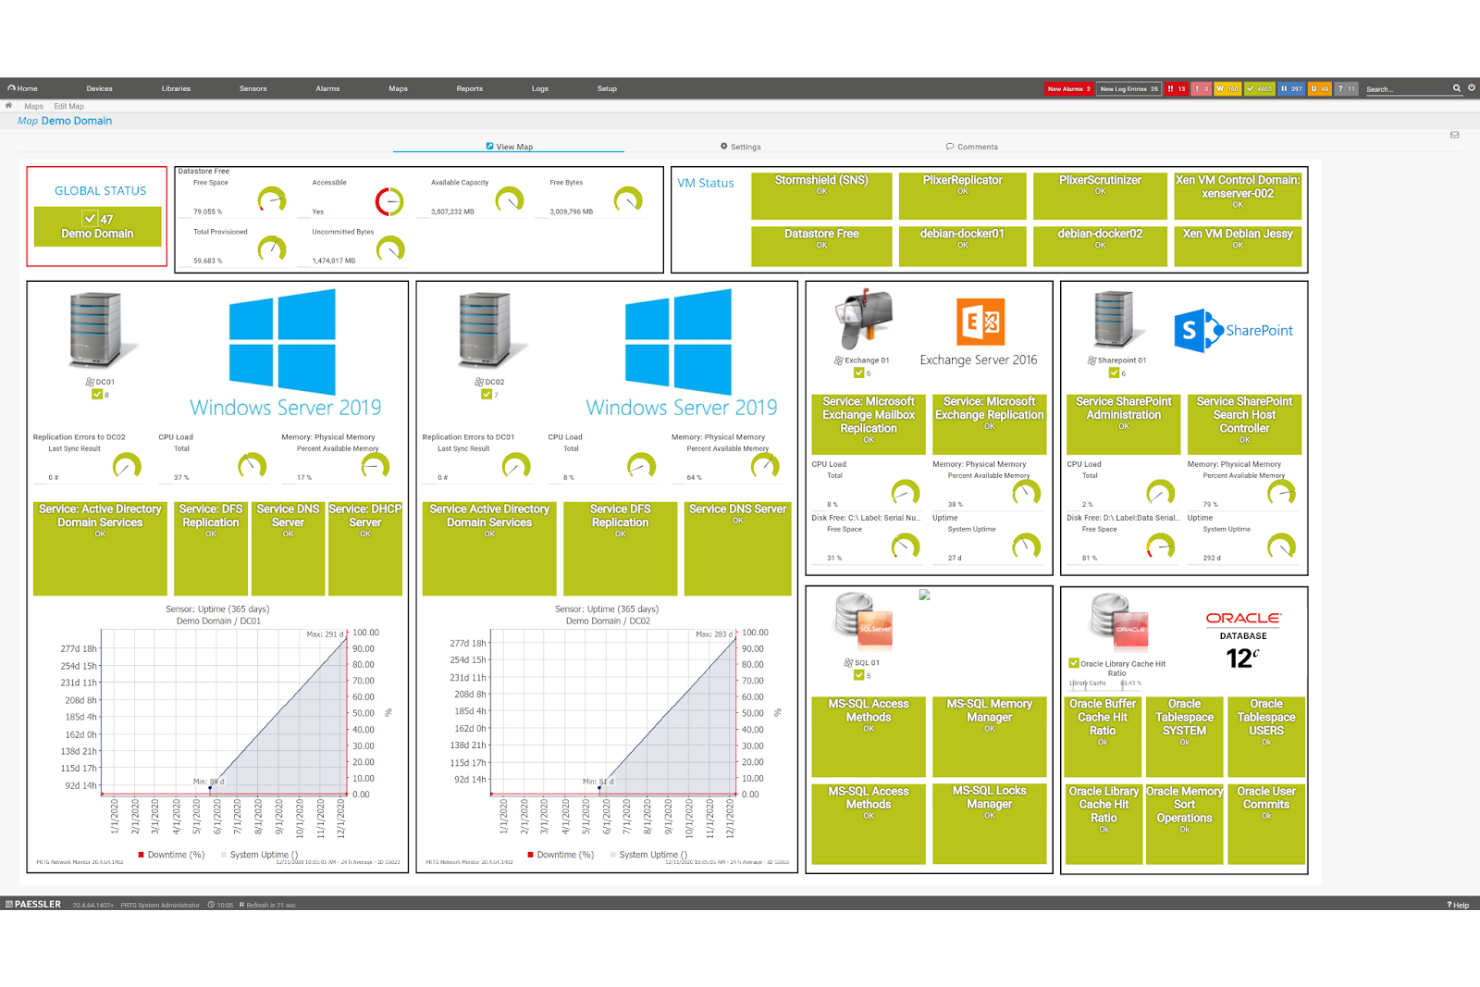
Paessler PRTG è una soluzione di monitoraggio di rete per amministratori IT e responsabili di rete. Aiuta a tenere traccia delle prestazioni della rete, rilevare interruzioni e garantire l'affidabilità della rete.
Perché è una valida alternativa a New Relic: Paessler PRTG si distingue soprattutto per il monitoraggio di rete, rendendolo ideale se il tuo team deve concentrarsi sulla salute dell’infrastruttura. Offre una visibilità completa grazie al suo sistema di monitoraggio basato su sensori, che consente un controllo su misura di specifici componenti di rete. A differenza di New Relic, Paessler PRTG è progettato per gestire un'ampia gamma di dispositivi di rete, offrendo flessibilità su ciò che puoi monitorare.
Caratteristiche principali & integrazioni:
Le funzionalità includono un approccio al monitoraggio basato su sensori, avvisi personalizzabili e report dettagliati. Puoi configurare dashboard per visualizzare efficacemente lo stato della rete. Paessler PRTG supporta anche il monitoraggio distribuito, utile per sedi remote.
Le integrazioni includono Microsoft Azure, Amazon Web Services, VMware, Cisco, Juniper Networks, SNMP, NetFlow, WMI, REST API e Ping.
Pros and Cons
Pros:
- Potente monitoraggio di rete
- Monitoraggio basato su sensori
- Avvisi personalizzabili
Cons:
- Può richiedere competenze tecniche
- Curva di apprendimento più ripida
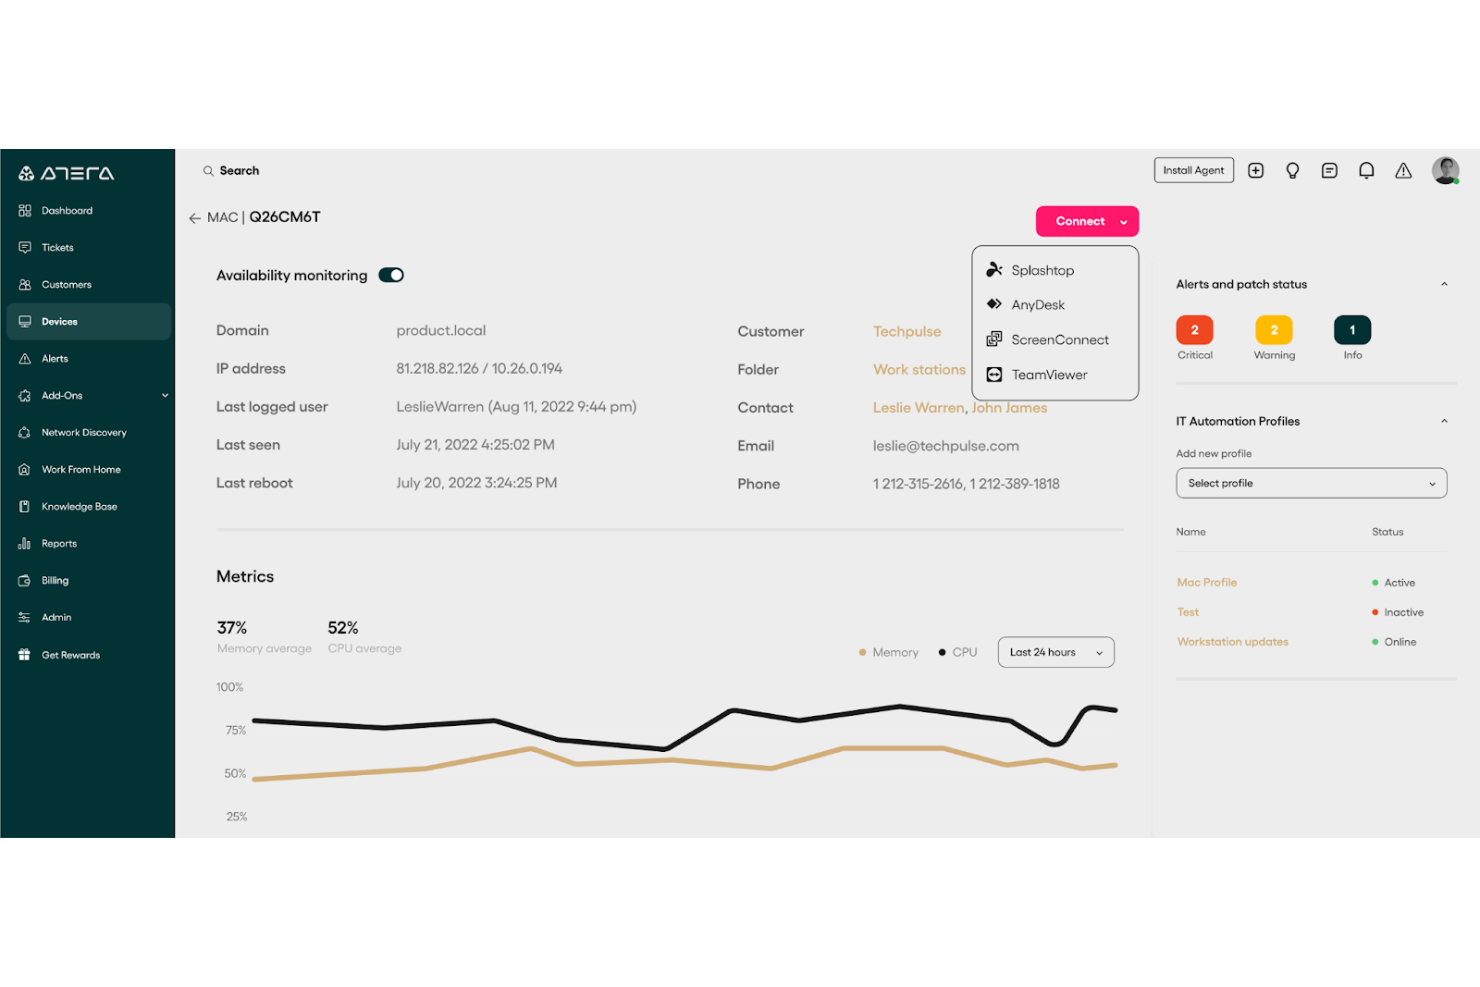
Atera Networks è una soluzione di monitoraggio e gestione remota (RMM) pensata per professionisti IT e fornitori di servizi gestiti (MSP). Offre strumenti completi per monitorare l'infrastruttura IT, automatizzare le attività e gestire più clienti da un'unica piattaforma.
Perché è una valida alternativa a New Relic: Atera Networks si concentra su monitoraggio e gestione remoti, rendendola ideale per i team IT che vogliono amministrare ambienti eterogenei a distanza. Combina funzionalità RMM, help desk e rilevamento della rete, offrendo una visione olistica delle operazioni IT. Le sue capacità di automazione aiutano il team a semplificare i compiti ripetitivi, riducendo lo sforzo manuale. A differenza di New Relic, Atera Networks offre una piattaforma unificata per la gestione IT end-to-end.
Funzionalità principali e integrazioni:
Funzionalità includono rilevamento della rete, gestione delle patch e un sistema di ticketing. Puoi automatizzare le attività di routine, risparmiando tempo e aumentando l'efficienza. Atera Networks offre inoltre un cruscotto centralizzato per monitorare tutte le operazioni IT da un unico punto.
Integrazioni includono Splashtop, AnyDesk, TeamViewer, QuickBooks, FreshBooks, Xero, Stripe, PayPal, ConnectBooster e Microsoft 365.
Pros and Cons
Pros:
- Solido monitoraggio remoto
- Funzionalità RMM complete
- Capacità di automazione delle attività
Cons:
- Richiede configurazione e impostazione
- Monitoraggio applicativo limitato
Altre alternative a New Relic
Ecco alcune ulteriori alternative a New Relic che non sono entrate nella mia shortlist ma vanno comunque considerate.
- Stackify Retrace
Ideale per il profiling del codice in tempo reale
- Sematext
Ideale per monitoraggio conveniente
- Zenoss
Ideale per ambienti IT ibridi
- Dotcom Monitor
Ideale per simulazioni utente con browser reali


Criteri di selezione delle alternative a New Relic
Nella scelta delle migliori alternative a New Relic presenti in questo elenco ho considerato i bisogni quotidiani e i punti dolenti degli acquirenti riguardo ai prodotti SaaS, come scalabilità e capacità di integrazione. Ho inoltre utilizzato il seguente schema per rendere la valutazione strutturata e imparziale.
Funzionalità principali (25% del punteggio complessivo)
Per essere incluse in questa lista, le soluzioni dovevano coprire questi casi d’uso comuni:
- Monitoraggio delle prestazioni delle applicazioni
- Avvisi in tempo reale
- Reportistica dettagliata
- Supporto per molteplici fonti di dati
- Controllo degli accessi degli utenti
Altre caratteristiche distintive (25% del punteggio complessivo)
Per restringere ulteriormente il campo, ho considerato anche funzionalità uniche, quali:
- Analisi basate sull'IA
- Cruscotti personalizzabili
- Analisi predittiva
- Supporto multi-cloud
- Rilevamento avanzato delle anomalie
Usabilità (10% del punteggio totale)
Per avere un'idea dell'usabilità di ciascun sistema, ho considerato i seguenti aspetti:
- Interfaccia utente intuitiva
- Facilità di navigazione
- Opzioni di personalizzazione
- Accesso da mobile
- Documentazione facile da usare
Onboarding (10% del punteggio totale)
Per valutare l'esperienza di onboarding di ogni piattaforma, ho considerato i seguenti aspetti:
- Disponibilità di video formativi
- Tour interattivi del prodotto
- Accesso a modelli preimpostati
- Webinar e workshop
- Assistenza tramite chatbot
Assistenza Clienti (10% del punteggio totale)
Per valutare l'assistenza clienti offerta dai diversi fornitori di software, ho preso in considerazione i seguenti elementi:
- Disponibilità 24/7
- Accesso a una knowledge base
- Supporto via chat dal vivo
- Supporto telefonico e via email
- Tempo di risposta
Rapporto Qualità-Prezzo (10% del punteggio totale)
Per valutare il rapporto qualità-prezzo di ciascuna piattaforma, ho considerato i seguenti aspetti:
- Trasparenza dei prezzi
- Piani flessibili
- Disponibilità di prova gratuita
- Rapporto tra funzionalità e prezzo
- Opzioni sulla durata dei contratti
Recensioni dei Clienti (10% del punteggio totale)
Per avere una panoramica della soddisfazione generale dei clienti, ho preso in considerazione i seguenti elementi mentre leggevo le recensioni:
- Valutazioni di soddisfazione generale
- Pro e contro più frequentemente citati
- Feedback sull'assistenza clienti
- Facilità d’uso riportata dagli utenti
- Percezione del rapporto qualità-prezzo
Perché Cercare Un’Altra Soluzione a New Relic?
Sebbene New Relic sia una scelta solida per i professionisti IT, ci sono altre ragioni per cui alcuni utenti cercano soluzioni alternative. Potresti cercare un’alternativa a New Relic perché:
- Non si adatta al tuo budget
- Hai bisogno di un’assistenza clienti migliore
- Richiedi maggiori opzioni di scalabilità
- Il tuo team necessita di conformità specifiche per il settore
- Vuoi un'integrazione migliore con gli strumenti esistenti
- Devi gestire problematiche legate alla residenza dei dati
Se ti ritrovi in una di queste situazioni, sei nel posto giusto. Il mio elenco contiene diverse soluzioni SaaS più adatte per i team che affrontano queste sfide con New Relic e cercano alternative valide.
Funzionalità Principali di New Relic
Ecco alcune delle funzionalità principali di New Relic per aiutarti a confrontare ciò che offrono le soluzioni alternative.
- Monitoraggio delle prestazioni applicative (APM): Informazioni in tempo reale sulle prestazioni delle applicazioni per identificare i colli di bottiglia e ottimizzare l'efficienza.
- Monitoraggio serverless: Tieni traccia delle architetture serverless per garantire un funzionamento fluido senza server dedicati.
- Osservabilità del business: Combina metriche aziendali e prestazioni tecniche per comprendere in modo olistico l'impatto sui risultati.
- Funzionalità di sicurezza: Strumenti per i test di sicurezza delle applicazioni e la gestione delle vulnerabilità per proteggere il software dalle minacce.
- Monitoraggio dell'esperienza digitale: Monitora le esperienze degli utenti su piattaforme web e mobile per migliorarne la soddisfazione e il coinvolgimento.
- Funzionalità di intelligenza artificiale: Intuizioni predittive e monitoraggio per prevedere e gestire proattivamente i problemi.
- Monitoraggio delle infrastrutture: Monitora le infrastrutture, inclusi i servizi cloud, per prestazioni ottimali in tutti gli ambienti IT.
- Gestione dei log: Centralizza il tracciamento e la risoluzione dei log con strumenti completi di gestione.
- Avvisi e dashboard: Avvisi e dashboard personalizzabili per aggiornamenti in tempo reale su dati e stato dei sistemi.
- Piattaforma di osservabilità: Monitoraggio unificato e approfondimenti su tutto lo stack tecnologico per migliorare prestazioni e affidabilità.
- Strumenti di risoluzione dei problemi: Diagnostica e risolvi rapidamente i problemi individuando colli di bottiglia ed errori.
- Compatibilità self-hosted: Supporto flessibile per ambienti self-hosted per esigenze infrastrutturali particolari.
- Aggregazione dei dati: Centralizza log, metriche e tracce per offrire una visione coesa della salute delle applicazioni.
- Informazioni sugli utenti finali: Ottimizza le interazioni analizzando dati dettagliati sulle esperienze degli utenti.
- Monitoraggio Java: Approfondimenti su applicazioni Java, inclusi prestazioni JVM e attività dei thread.
- Monitoraggio dei microservizi: Analizza le prestazioni dei microservizi per assicurarne il funzionamento e la comunicazione senza interruzioni.
- Integrazioni con lo stack tecnologico: Integrazione semplice con vari strumenti e tecnologie per ambienti diversi.
- Automazione dei workflow: Automatizza le attività di monitoraggio ripetitive per migliorare le pratiche DevOps.
- Monitoraggio del cloud: Approfondimenti su risorse di applicazioni cloud-native, inclusi utilizzo di CPU e memoria.
- Monitoraggio dell'utilizzo della CPU: Monitora l'uso della CPU per mantenere le prestazioni e prevenire criticità.
- Allineamento DevOps: Approfondimenti utili e strumenti per colmare il divario tra team di sviluppo e operation.
- Monitoraggio delle prestazioni del frontend: Traccia e ottimizza le prestazioni del frontend per esperienze utente senza interruzioni.
- Strumentazione approfondita: Metriche e tracciamenti dettagliati per individuare problemi nascosti di prestazioni.
- Supporto agli strumenti open source: Compatibile con strumenti di monitoraggio open source per flessibilità ed efficienza dei costi.
- Approfondimenti sull'ottimizzazione: Telemetria e raccomandazioni basate su intelligenza artificiale per le prestazioni di applicazioni e infrastrutture.
- Modello di prezzo flessibile: Diversi livelli di prezzo, inclusa un'opzione gratuita, per soddisfare vari budget.
- Supporto Python: Monitoraggio dettagliato delle applicazioni Python, incluse prestazioni e dipendenze.
- Monitoraggio sintetico: Simula le interazioni degli utenti per ottimizzare il comportamento delle applicazioni in condizioni controllate.
- Approfondimenti tramite telemetria: Gestisci proattivamente la salute del sistema con i dati di telemetria.
- Monitoraggio applicazioni web: Monitoraggio ad alta disponibilità delle applicazioni web su tutte le piattaforme.
Cosa succede dopo?
Accelera la crescita della tua SaaS e le tue capacità di leadership. Iscriviti alla nostra newsletter per ricevere le ultime novità da CTO e futuri leader tecnologici.