10 meilleures alternatives à Nagios analysées en 2026

Meilleures alternatives à Nagios – Sélection rapide


Les meilleures alternatives à Nagios permettent aux équipes de superviser les systèmes sans avoir à gérer une configuration complexe ou à faire face à des limites de montée en charge. Elles offrent des tableaux de bord plus clairs, une configuration plus simple, et des intégrations flexibles qui facilitent le suivi des performances sur les serveurs, les réseaux et les applications.
De nombreuses organisations commencent à chercher des alternatives après avoir rencontré des soucis comme la configuration de plug-ins Nagios qui ne s’intègrent pas correctement, la perte de temps à résoudre des messages d’erreur obscurs, ou l’atteinte de limites de performances lorsque les besoins de supervision augmentent. Ces défis ralentissent les opérations et rendent plus difficile pour les équipes IT de garder de la visibilité à grande échelle.
J’ai testé des plateformes de monitoring dans des environnements de production réels, travaillé avec des équipes migrant depuis des déploiements Nagios anciens, et évalué la performance de ces outils sur des infrastructures hybrides et cloud. Ces expériences m’ont montré quelles solutions réduisent réellement la charge de supervision et lesquelles créent de nouvelles complexités.
Dans ce guide, vous verrez quelles alternatives à Nagios offrent une mise en place plus simple, une meilleure évolutivité et des informations plus exploitables afin que votre équipe puisse se concentrer sur la résolution des problèmes au lieu de devoir lutter avec l’outil de supervision.
Qu’est-ce que Nagios ?
Nagios est une plateforme open source de supervision et de gestion réseau conçue pour le suivi des réseaux et systèmes. Les professionnels IT et les administrateurs systèmes utilisent généralement Nagios pour surveiller les infrastructures critiques et garantir la fluidité des opérations.
Ses capacités d’alerte, de reporting et de monitoring vous aident à détecter les incidents, analyser les performances et gérer efficacement les ressources réseau. En somme, Nagios apporte de la valeur en aidant votre équipe à maintenir la fiabilité du système et à minimiser les interruptions.
Résumé des meilleures alternatives à Nagios
Ce tableau comparatif résume les détails tarifaires de mes principales alternatives à Nagios pour vous aider à trouver la meilleure selon votre budget et vos besoins d’entreprise.
| Tool | Best For | Trial Info | Price | ||
|---|---|---|---|---|---|
| 1 | Idéal pour les infrastructures informatiques complexes | Plan gratuit disponible | Tarifs sur demande | Website | |
| 2 | Idéal pour la surveillance multi-cloud | Essai gratuit de 30 jours + démo gratuite disponible | À partir de 10 $/mois (facturé annuellement) | Website | |
| 3 | Idéal pour la surveillance des applications web | Essai gratuit de 30 jours + offre gratuite + démo gratuite disponible | À partir de $19.99/mois | Website | |
| 4 | Idéal pour une configuration plug-and-play | Démo gratuite disponible | Tarification sur demande | Website | |
| 5 | Idéal pour l'observabilité full-stack | Essai gratuit de 14 jours | À partir de $5/mois | Website | |
| 6 | Idéal pour les capacités de création de graphiques | Téléchargement gratuit | Gratuit à utiliser | Website | |
| 7 | Idéal pour l’AIOps et l’observabilité | Démo gratuite disponible | Tarification sur demande | Website | |
| 8 | Idéal pour une surveillance de bout en bout | Essai gratuit de 7 jours | Tarification sur demande | Website | |
| 9 | Idéal pour les réseaux distribués | Consultation gratuite disponible | Tarification sur demande | Website | |
| 10 | Idéal pour une surveillance légère | Formule gratuite disponible | Tarification sur demande | Website |
Pourquoi faire confiance à nos avis logiciels
Nous testons et analysons des logiciels depuis 2023. En tant que dirigeants technologiques, nous savons à quel point il est crucial et difficile de faire le bon choix lors de la sélection d’un logiciel.
Nous investissons dans des recherches approfondies pour aider notre audience à prendre de meilleures décisions d’achat de logiciels. Nous avons testé plus de 2 000 outils pour différents usages technologiques et rédigé plus de 1 000 avis complets. Découvrez comment nous restons transparents & notre méthodologie d’évaluation des logiciels.
-

TestDevLab
Visit Website -
Site24x7
Visit WebsiteThis is an aggregated rating for this tool including ratings from Crozdesk users and ratings from other sites.4.7 -
GitHub Actions
Visit WebsiteThis is an aggregated rating for this tool including ratings from Crozdesk users and ratings from other sites.4.8


Avis sur les meilleures alternatives à Nagios
Vous trouverez ci-dessous mes résumés détaillés des meilleures alternatives à Nagios présentes dans ma sélection. Mes avis offrent un aperçu détaillé des principales fonctionnalités, avantages et inconvénients, intégrations, et cas d’utilisation idéaux de chaque outil pour vous aider à trouver la solution qui vous convient le mieux.
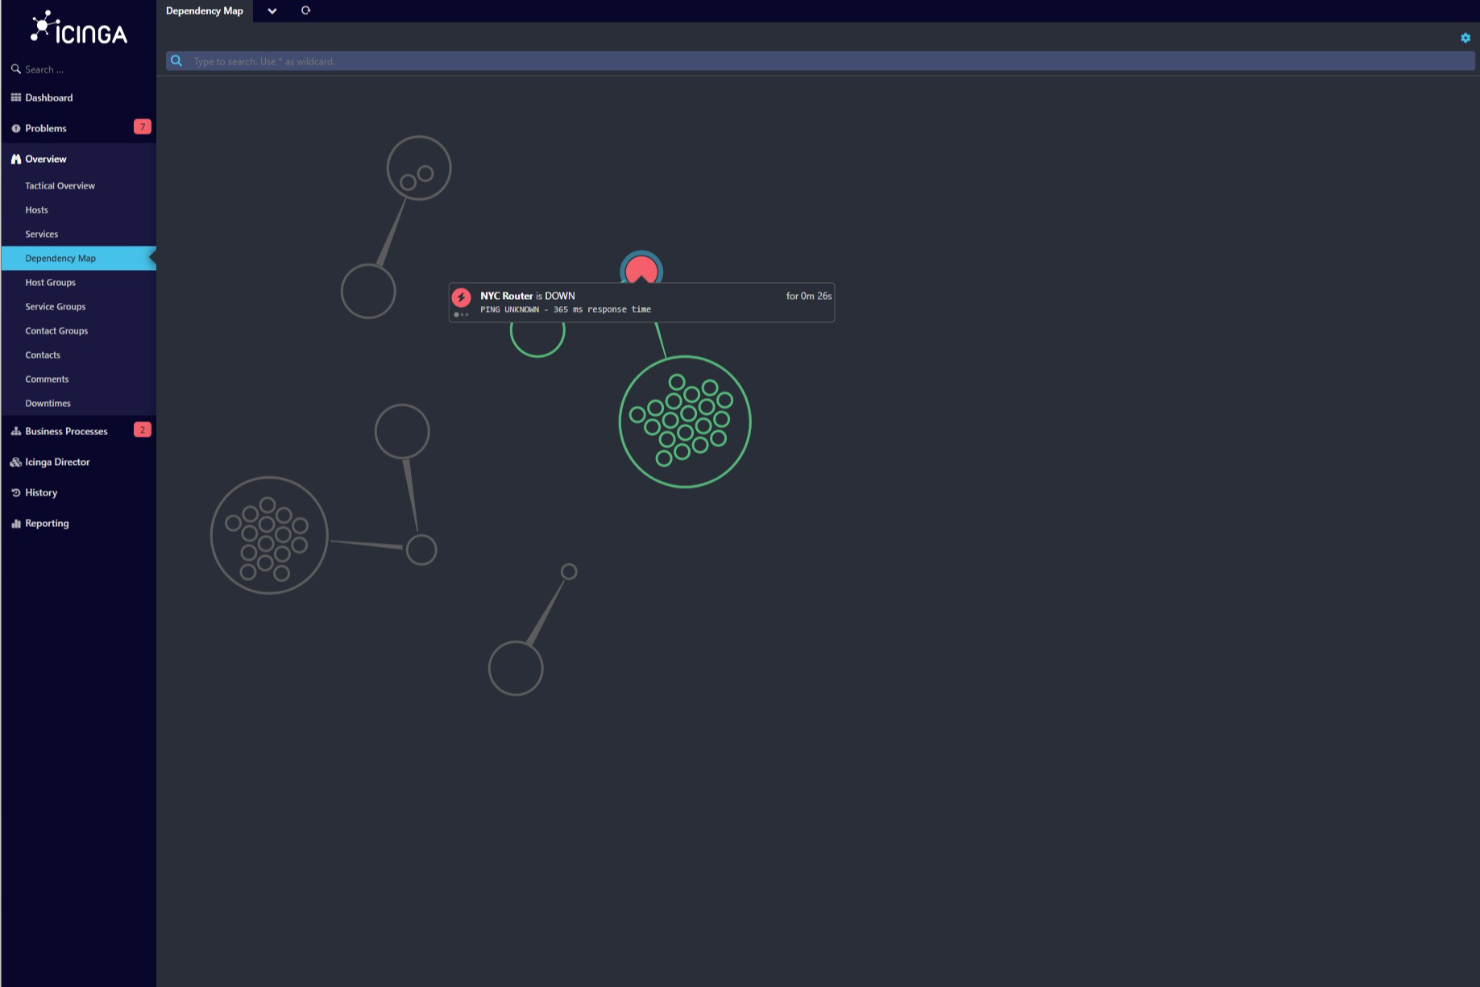
Icinga est une solution de surveillance open-source conçue pour les infrastructures informatiques complexes, principalement utilisée par les professionnels de l'informatique et les organisations. Elle surveille les serveurs, réseaux, applications et environnements cloud.
Pourquoi c'est une bonne alternative à Nagios : Icinga excelle dans les environnements informatiques complexes grâce à la supervision de l'infrastructure, l'automatisation et les notifications. Elle propose une surveillance spécialisée pour Kubernetes, les bases de données et VMware, ce qui la rend idéale pour les environnements complexes. La gestion des analyses, des métriques et des journaux permet à votre équipe de gagner en visibilité. La plateforme s'intègre également avec des outils de gestion des services informatiques pour renforcer son utilité.
Fonctionnalités clés & intégrations :
Fonctionnalités incluant la surveillance de l'infrastructure, l'automatisation et la supervision du cloud. Elle propose également la gestion de l'analyse, des métriques et des journaux, en prenant en charge la surveillance spécialisée de Kubernetes, des bases de données et de VMware.
Intégrations comprenant Puppet, Ansible, Chef, SaltStack, Grafana, Graylog, Elasticsearch, InfluxDB, Jira, et Slack.
Pros and Cons
Pros:
- Souplesse de l'open-source
- Prise en charge des environnements complexes
- Compatibilité avec les plugins Nagios
Cons:
- Courbe d'apprentissage plus prononcée
- Nécessite une expertise technique
New Product Updates from Icinga

Icinga Adds TOTP Two-Factor Authentication to Icinga Web
Icinga added time-based one-time password (TOTP) two-factor authentication to Icinga Web, helping organizations strengthen login security with an additional verification step. For more information, visit Icinga’s official site.
 .
.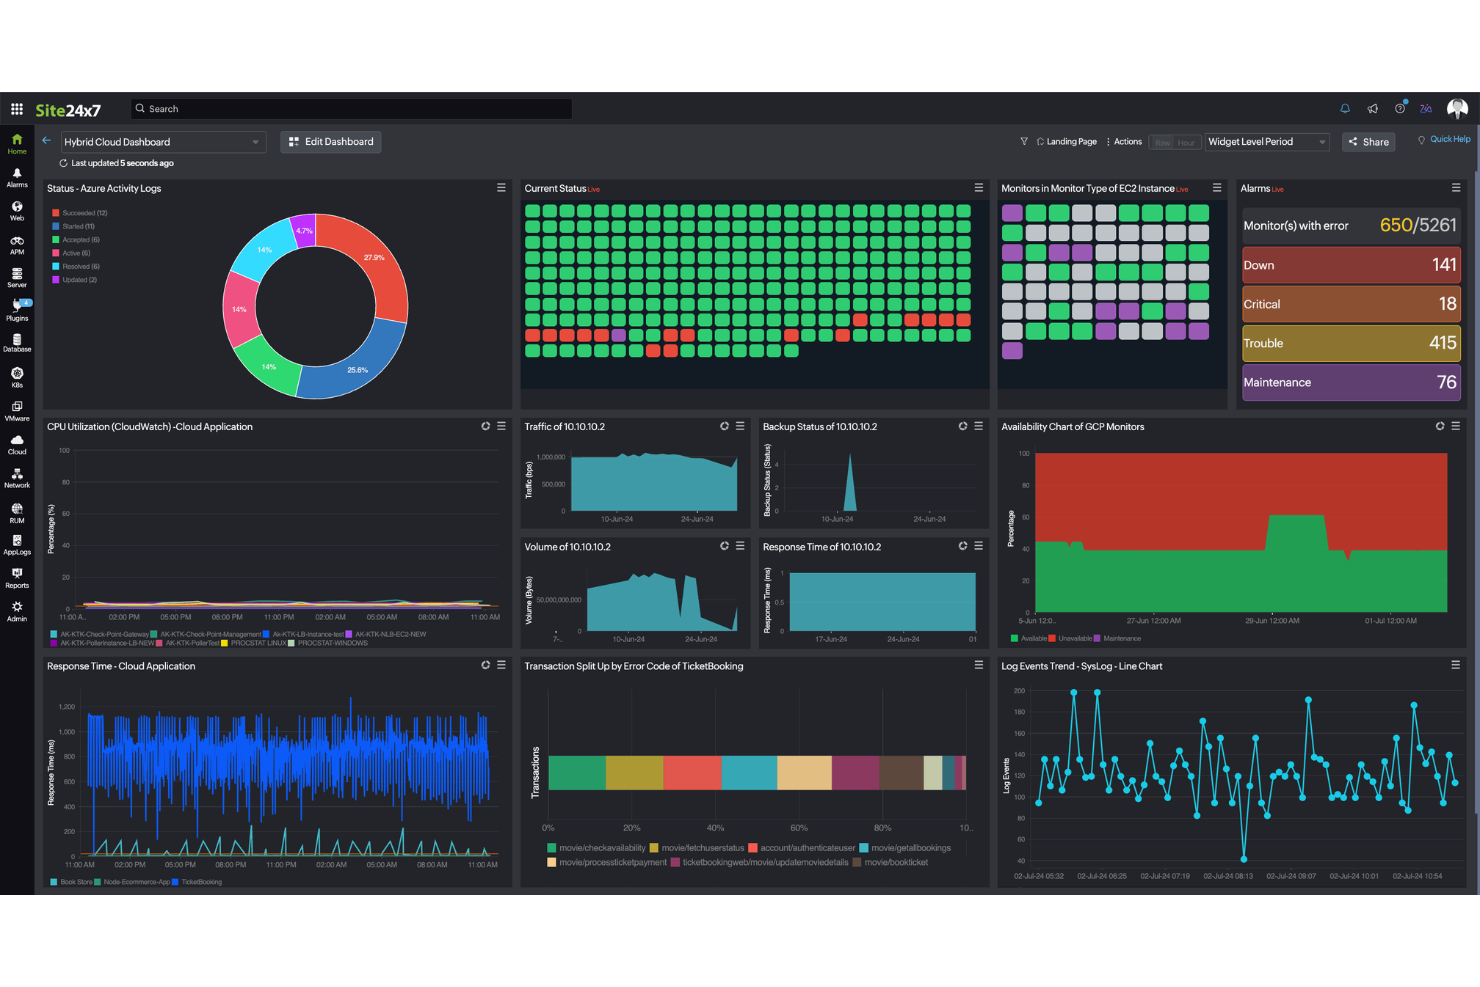
Pour les entreprises recherchant une alternative fiable à Nagios, Site24x7 propose un mélange convaincant de capacités de surveillance et de fonctionnalités conviviales. Cette solution basée sur le cloud s'adresse aux professionnels de l'informatique et aux organisations qui ont besoin de surveiller en profondeur leurs serveurs, réseaux, applications et sites web à travers divers environnements. Site24x7 répond aux défis tels que la gestion des environnements multi-cloud et l'automatisation des tâches répétitives, offrant un moyen rentable de surveiller l'infrastructure informatique dans le cadre d'un forfait unique.
Pourquoi j'ai choisi Site24x7
J'ai choisi Site24x7 comme alternative principale à Nagios pour ses capacités fiables de surveillance multi-cloud et ses fonctionnalités d'automatisation. Avec Site24x7, vous pouvez surveiller en toute transparence des environnements comme AWS, Azure et GCP depuis une seule console, ce qui simplifie la gestion des infrastructures complexes. De plus, l'automatisation des tâches répétitives par la plateforme permet de réduire les efforts manuels, permettant à votre équipe de se concentrer sur des initiatives plus stratégiques. Ces caractéristiques sont essentielles pour les organisations souhaitant améliorer leur efficacité et rationaliser leurs processus de surveillance.
Principales fonctionnalités de Site24x7
En plus de la surveillance multi-cloud et de l'automatisation, Site24x7 propose :
- Gestion des journaux : Offre une visibilité sur l'ensemble de votre écosystème technologique pour une analyse et une résolution des problèmes améliorées.
- Surveillance des API : Garantit le bon fonctionnement de vos API afin de maintenir la fiabilité des services.
- Pages de statut : Permet de créer des pages personnalisables pour communiquer sur les interruptions et instaurer la confiance auprès des utilisateurs.
- Gestion des incidents : Facilite la gestion efficace des incidents à travers une documentation détaillée, incluant les journaux d'erreurs et les chronologies.
Intégrations Site24x7
Les intégrations incluent AWS, Azure, Google Cloud Platform, Docker, Kubernetes, Microsoft Exchange, Microsoft SharePoint, et bien d'autres.
Pros and Cons
Pros:
- Surveillance complète pour divers systèmes
- La surveillance full-stack assistée par l'IA facilite la gestion des infrastructures multi-cloud
- Une surveillance flexible qui s'intègre facilement à de nombreux composants d'infrastructure
Cons:
- Des bugs dans les alertes créent des problèmes lors de l'ajout de nouvelles configurations de surveillance
- Une configuration complexe ralentit la mise en place initiale et la compréhension de la plateforme
New Product Updates from Site24x7

Site24x7 Adds Discovery Issues for AWS Monitoring
Site24x7 added Discovery Issues for AWS monitoring, helping teams identify why resources are not being discovered across services and regions. The feature surfaces permission gaps, policy restrictions, and blocked API actions to support faster troubleshooting. For more information, visit Site24x7’s official site.
 .
.
Dotcom-Monitor est un outil de surveillance des performances web destiné aux développeurs, équipes informatiques et spécialistes du marketing numérique. Il aide à garantir la disponibilité, la performance et la fonctionnalité des sites web.
Pourquoi c'est une bonne alternative à Nagios : Dotcom-Monitor est spécialisé dans la surveillance des applications web en offrant des analyses de performances en temps réel. Ses capacités de surveillance synthétique permettent à votre équipe de simuler des interactions utilisateur et de détecter les problèmes de manière proactive. L'outil fournit des rapports complets, vous aidant à comprendre les tendances de performance au fil du temps. En se concentrant sur la surveillance des applications web, il propose une approche spécialisée qui diffère des capacités de surveillance générale de Nagios.
Fonctionnalités et intégrations remarquables :
Fonctionnalités incluent la surveillance synthétique qui simule les interactions utilisateur pour détecter les problèmes avant qu'ils n'impactent les utilisateurs réels. Il propose également des rapports complets pour vous aider à comprendre les tendances de performance dans le temps. Les analyses de performances en temps réel vous assurent de pouvoir réagir rapidement aux problèmes.
Intégrations incluent Amazon Web Services, Microsoft Azure, Google Cloud Platform, Jenkins, PagerDuty, Slack, Splunk, New Relic, ServiceNow et Atlassian Jira.
Pros and Cons
Pros:
- Surveillance spécialisée des applications web
- Analyses de performances en temps réel
- Rapports complets
Cons:
- Nécessite certaines connaissances techniques
- Limité aux applications web
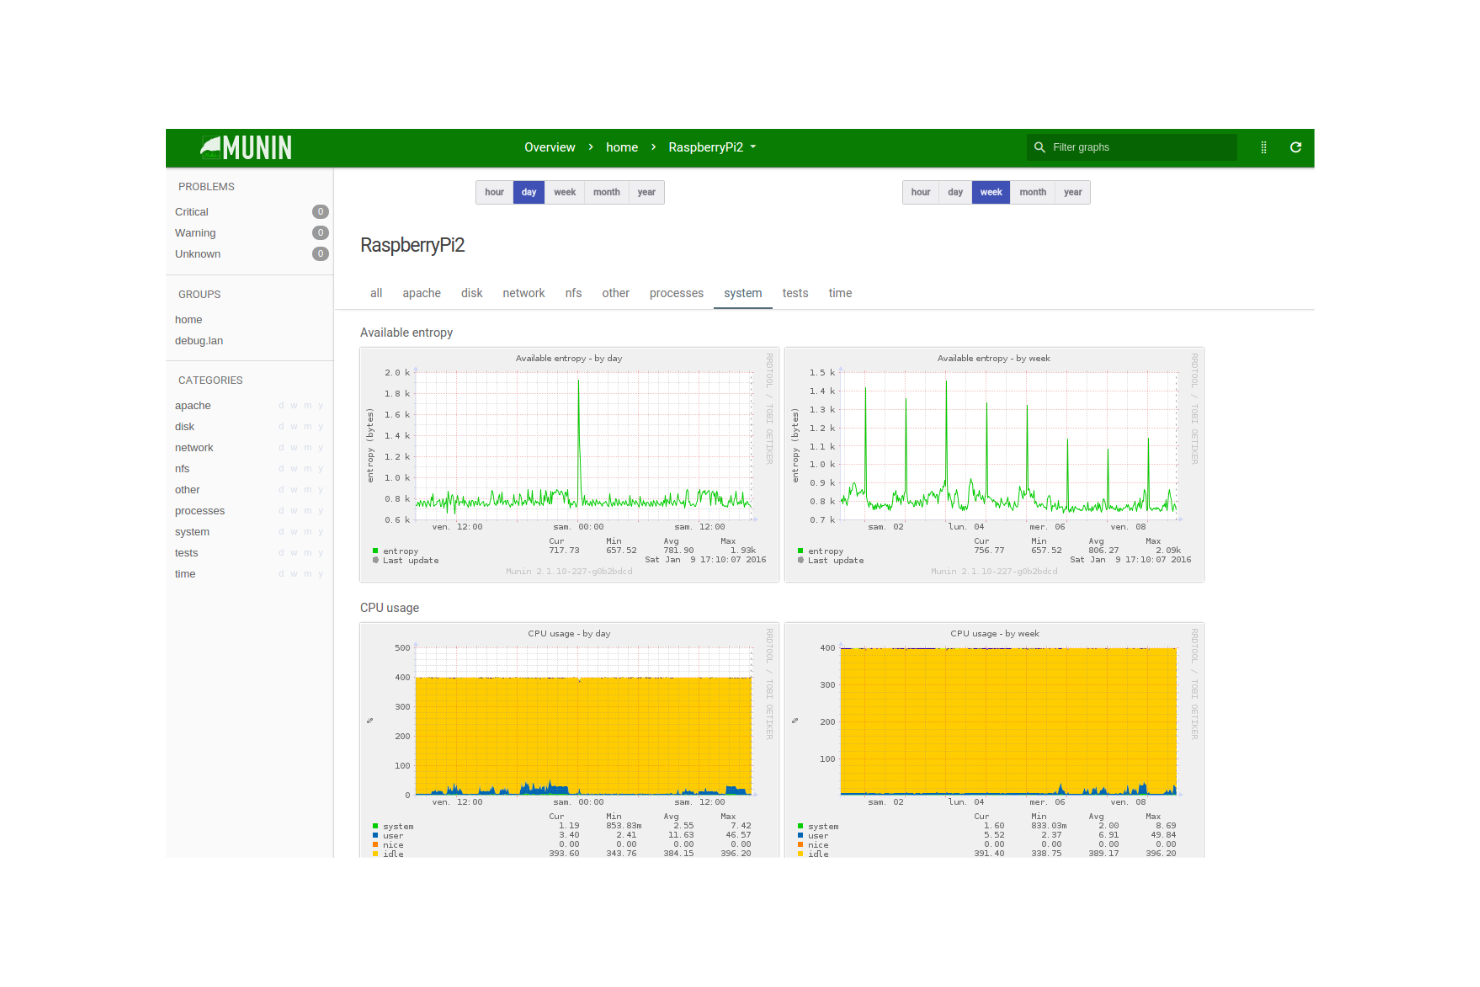
Munin est un outil de surveillance des ressources réseau conçu pour les administrateurs système et les professionnels de l'informatique. Il offre des informations sur les performances du système et l'utilisation des ressources.
Pourquoi c'est une bonne alternative à Nagios : Munin propose une configuration plug-and-play simple, permettant à votre équipe de démarrer la surveillance rapidement. Il crée automatiquement des graphiques pour les données de performance, afin de visualiser facilement les tendances. L'outil est léger, réduisant ainsi la consommation de ressources sur vos systèmes. Sa simplicité d'utilisation et sa configuration minimale en font un choix pratique pour ceux qui recherchent une alternative simple à Nagios.
Fonctionnalités phares & intégrations :
Fonctionnalités : création automatisée de graphiques, facilitant la visualisation des tendances des données au fil du temps. Il prend également en charge une architecture légère, qui minimise la consommation des ressources système. La configuration simple de l'outil vous permet de commencer rapidement, sans installation complexe.
Intégrations : Nagios, Cacti, Zabbix, Graphite, InfluxDB, Prometheus, Elasticsearch, Grafana, Jenkins et Docker.
Pros and Cons
Pros:
- Processus de configuration simple
- Architecture légère
- Création automatisée de graphiques
Cons:
- Scalabilité limitée
- Jeu de fonctionnalités basique
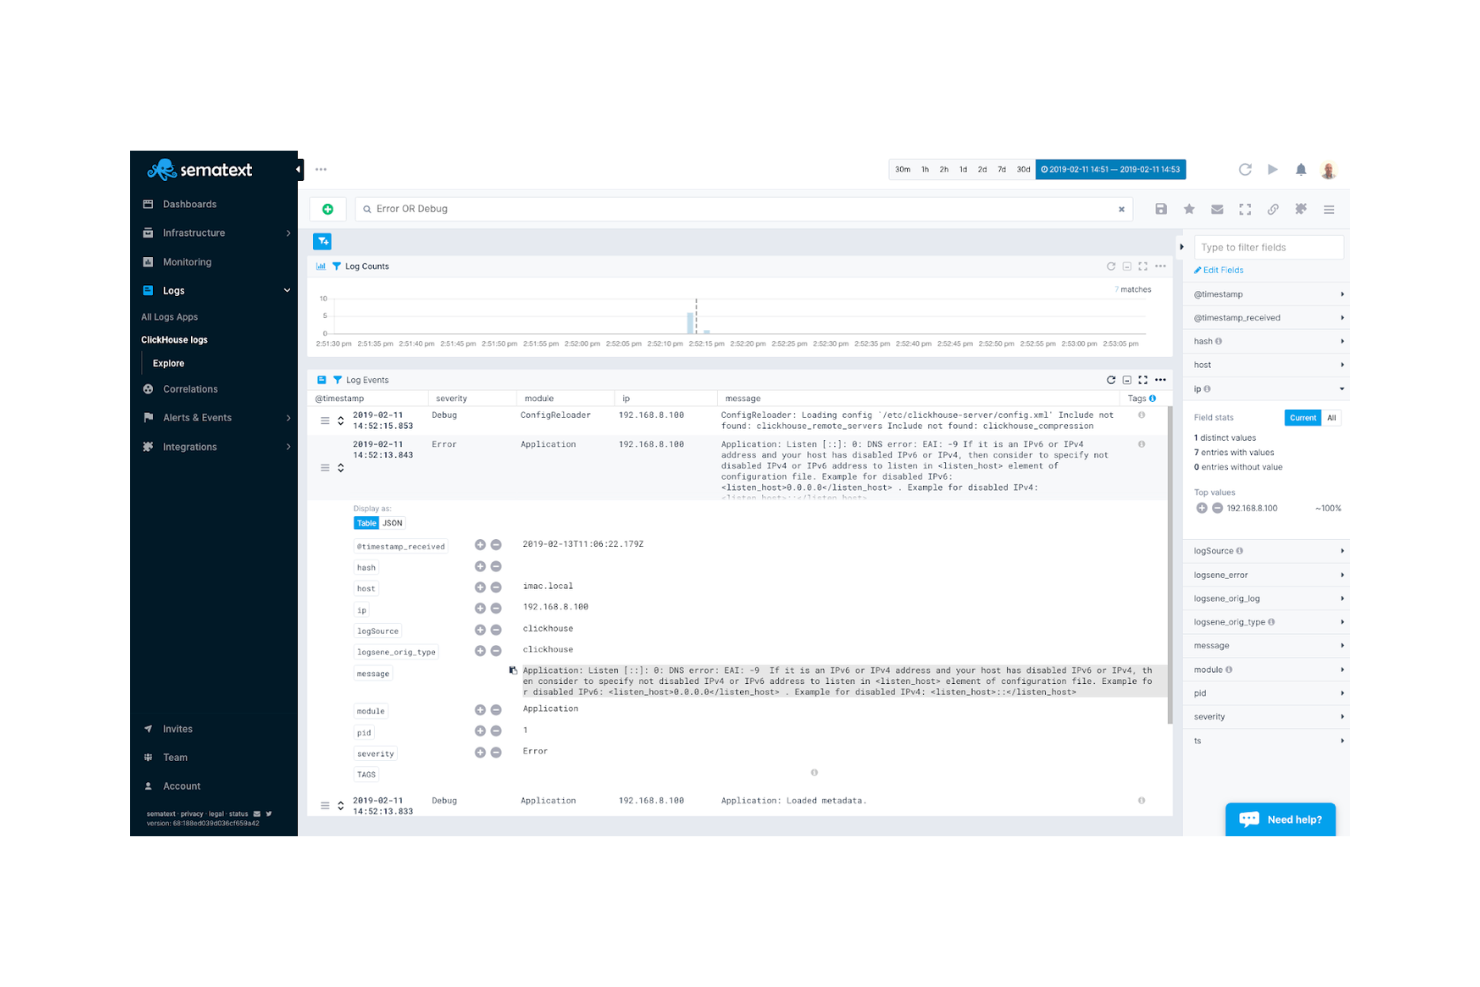
Sematext est une plateforme de surveillance et de gestion des journaux basée sur le cloud, destinée aux développeurs, aux équipes d'exploitation informatique et aux équipes DevOps. Elle offre des informations sur les performances des applications, la surveillance de l'infrastructure et la gestion des journaux.
Pourquoi c'est une bonne alternative à Nagios : Sematext propose une observabilité full-stack, permettant à votre équipe de surveiller les applications, l'infrastructure et les journaux depuis une seule plateforme. Son analyse en temps réel permet d'identifier rapidement les problèmes de performance. Les tableaux de bord conviviaux facilitent la visualisation des données et le suivi des métriques. Grâce à ses fonctionnalités de surveillance complètes, Sematext propose une approche plus intégrée que Nagios.
Fonctionnalités phares & Intégrations :
Fonctionnalités incluent des analyses en temps réel qui aident votre équipe à identifier rapidement les problèmes. Les tableaux de bord conviviaux rendent la visualisation des données simple et permettent un suivi facile des métriques. Ses capacités de surveillance complètes vous garantissent une vue d'ensemble de vos systèmes.
Intégrations incluent AWS, Azure, Google Cloud Platform, Kubernetes, Docker, Elasticsearch, Apache Kafka, NGINX, Redis et MySQL.
Pros and Cons
Pros:
- Observabilité full-stack
- Analyses en temps réel
- Tableaux de bord conviviaux
Cons:
- Nécessite un temps d'adaptation
- Fonctionnalités hors ligne limitées
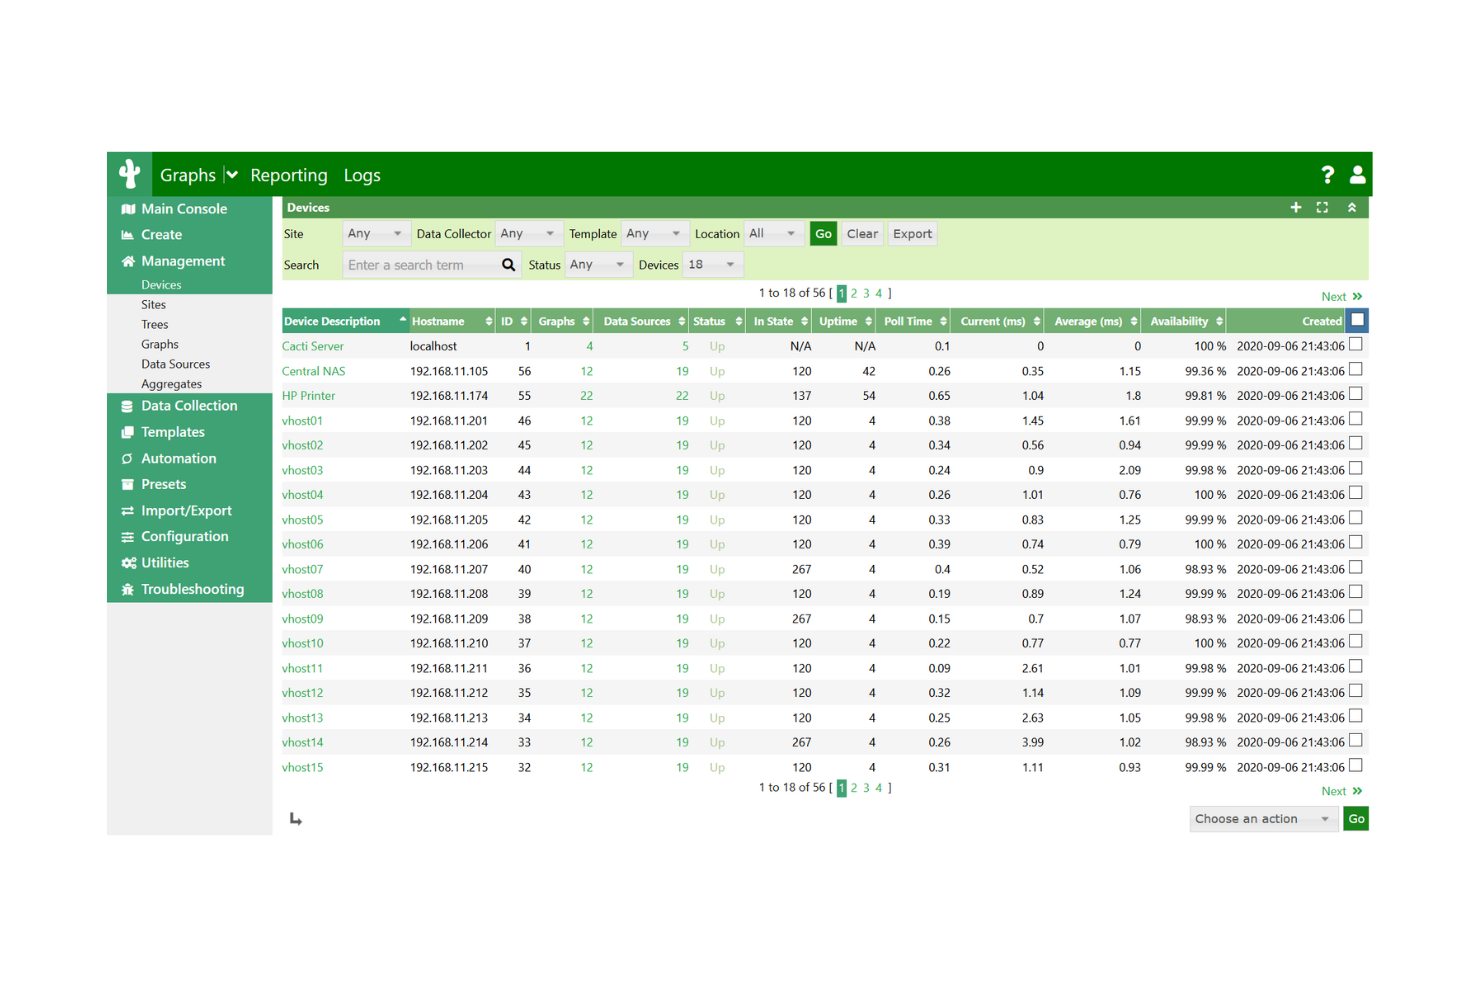
Cacti est un outil de surveillance réseau et de création de graphiques conçu pour les administrateurs informatiques et les responsables réseau. Il fournit des visualisations détaillées des données réseau et des performances système.
Pourquoi c'est une bonne alternative à Nagios : Cacti se distingue par ses capacités de création de graphiques, permettant de créer des représentations visuelles détaillées de vos données réseau. Son interface intuitive facilite la configuration et la gestion des graphiques, même pour des jeux de données complexes. L'outil prend en charge la collecte de données via SNMP, ce qui améliore la précision de ses graphiques. Avec son accent mis sur la visualisation, Cacti offre un avantage certain aux équipes ayant besoin d'une vue graphique et claire de leurs réseaux.
Fonctionnalités remarquables & intégrations :
Fonctionnalités comprennent des capacités avancées de création de graphiques permettant de visualiser facilement des données complexes. Il prend en charge SNMP pour une collecte de données précise, améliorant la justesse de vos graphiques. L'interface intuitive simplifie la configuration et la gestion de ces visualisations.
Intégrations incluent Nagios, InfluxDB, Graphite, Prometheus, Elasticsearch, Grafana, OpenNMS, Zabbix, SolarWinds et Splunk.
Pros and Cons
Pros:
- Excellentes capacités de création de graphiques
- Interface intuitive
- Prend en charge la collecte de données SNMP
Cons:
- Scalabilité limitée
- Fonctionnalités d'alerte de base
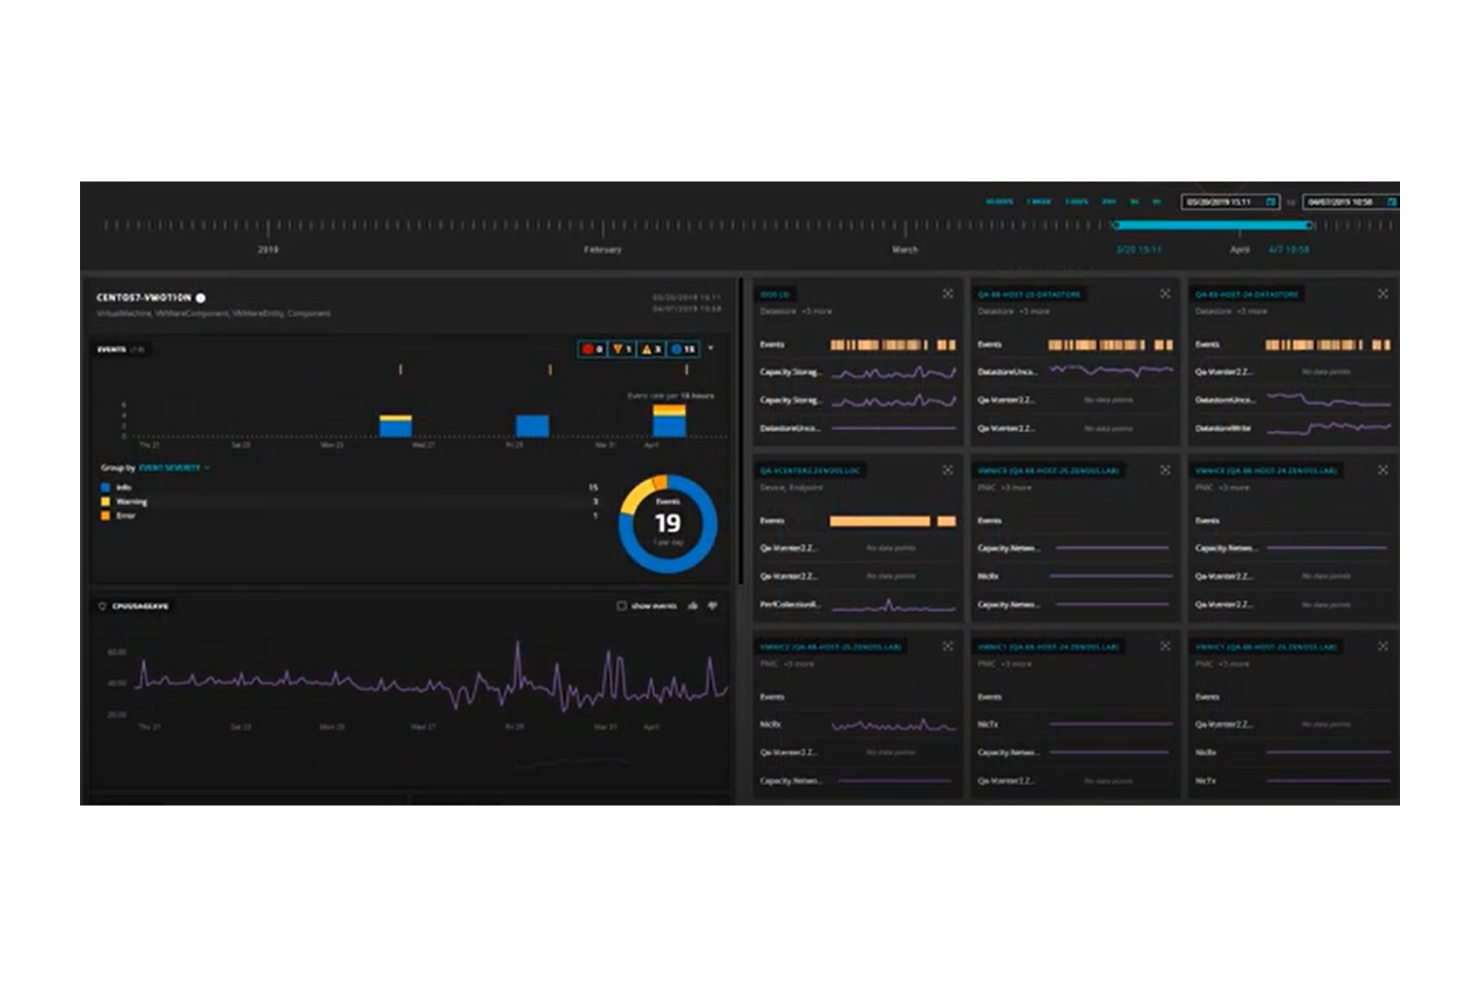
Zenoss Core est une plateforme hybride de surveillance et d'analyse informatique conçue pour les équipes d'exploitation IT. Elle fournit des informations sur les performances de l'infrastructure et aide à détecter et résoudre les problèmes en temps réel.
Pourquoi c'est une bonne alternative à Nagios : Zenoss Core intègre des capacités AIOps, offrant des analyses avancées pour prédire et prévenir les problèmes avant qu'ils n'impactent vos opérations. Sa surveillance en temps réel fournit une vue d'ensemble de votre infrastructure, aidant votre équipe à réagir rapidement aux incidents. Les fonctionnalités d'observabilité de la plateforme garantissent un suivi des indicateurs de performance et permettent d'obtenir des informations sur l'état du système. Grâce à son accent porté sur l’analytique et l’observabilité, Zenoss Core propose une approche plus proactive comparée à Nagios.
Fonctionnalités & Intégrations remarquables :
Fonctionnalités comprenant des analyses avancées qui aident à prédire et à prévenir les problèmes potentiels. La surveillance en temps réel offre une visibilité complète sur votre infrastructure. Les capacités d'observabilité de la plateforme garantissent un suivi efficace des indicateurs de performance et de la santé du système.
Intégrations comprennent Amazon Web Services, Microsoft Azure, Google Cloud Platform, VMware, Docker, Kubernetes, ServiceNow, Splunk, PagerDuty et Slack.
Pros and Cons
Pros:
- Capacités analytiques avancées
- Surveillance en temps réel
- Détection proactive des problèmes
Cons:
- Nécessite une expertise technique
- Complexité de la mise en place initiale
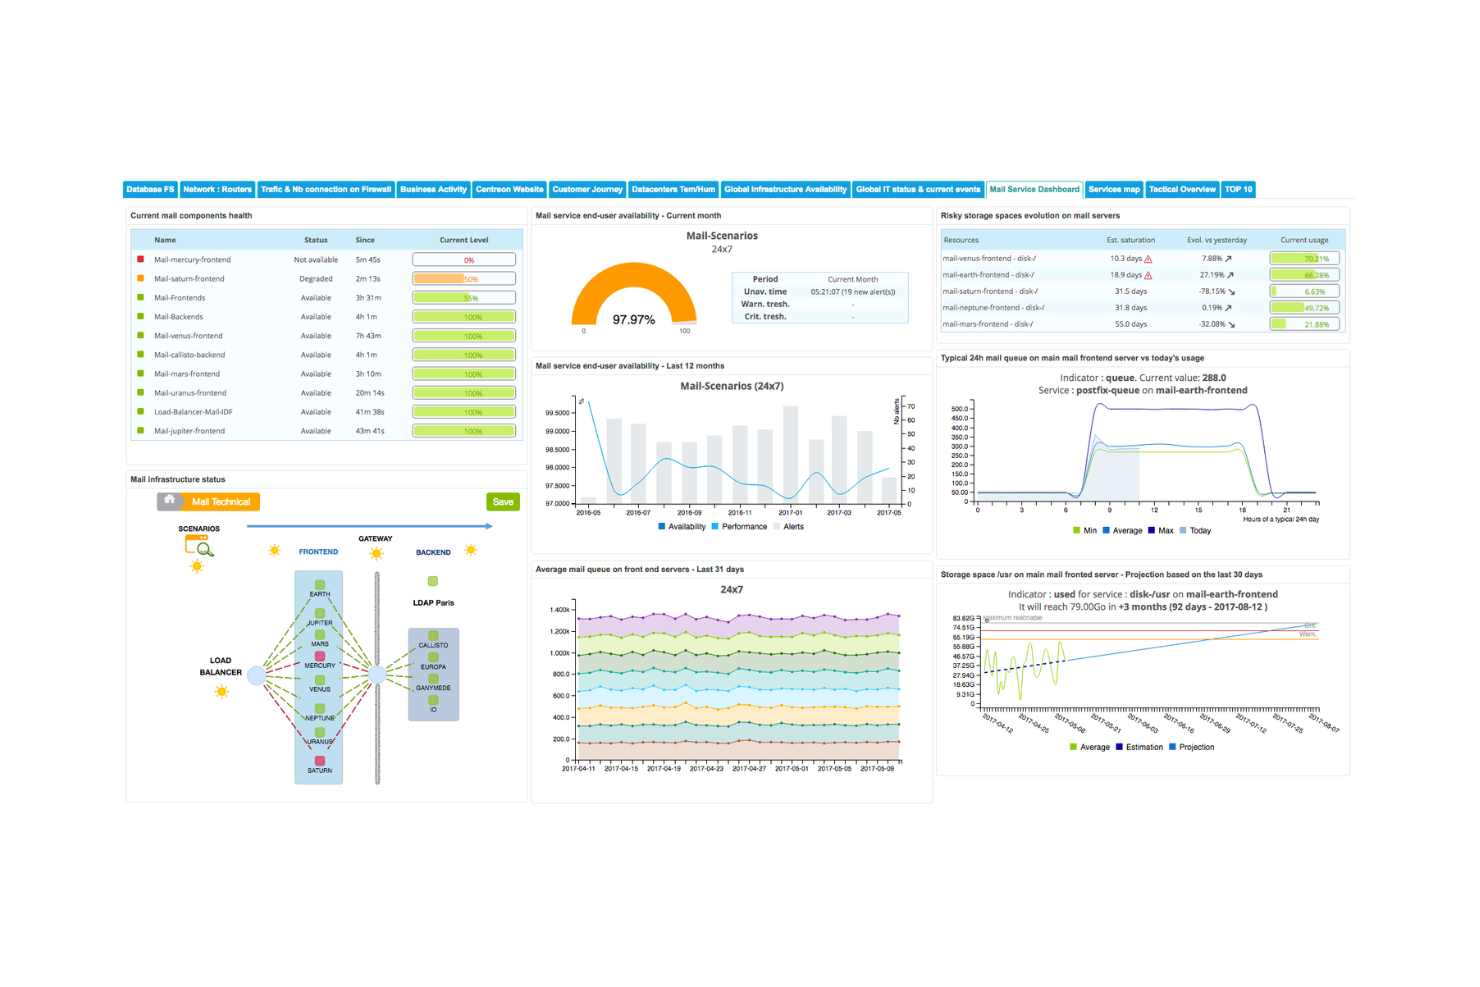
Centreon est une solution de surveillance informatique conçue pour les entreprises ayant besoin d'une visibilité de bout en bout, principalement utilisée par les équipes d'exploitation informatique. Elle surveille l'infrastructure IT, les applications et les réseaux pour assurer des performances optimales.
Pourquoi c'est une bonne alternative à Nagios : Centreon propose une surveillance de bout en bout avec des fonctionnalités telles que l'auto-découverte et des tableaux de bord centralisés. Il offre des informations en temps réel sur votre environnement informatique, aidant votre équipe à identifier et résoudre rapidement les problèmes. La plateforme est évolutive pour accompagner la croissance des entreprises, ce qui vous permet de surveiller de vastes réseaux. Son interface conviviale et ses alertes personnalisables facilitent l'adaptation du système à vos besoins.
Fonctionnalités remarquables & Intégrations :
Fonctionnalités incluant l'auto-découverte, les tableaux de bord centralisés et les alertes personnalisables. Elle offre également des informations en temps réel et une évolutivité pour accompagner la croissance des entreprises.
Intégrations incluant Amazon Web Services, Microsoft Azure, Google Cloud Platform, Docker, Kubernetes, VMware, Cisco, Juniper, Slack et ServiceNow.
Pros and Cons
Pros:
- Visibilité de bout en bout
- Fonction d'auto-découverte
- Évolutif pour les entreprises en croissance
Cons:
- Nécessite une expertise technique
- Complexité lors de l'installation initiale
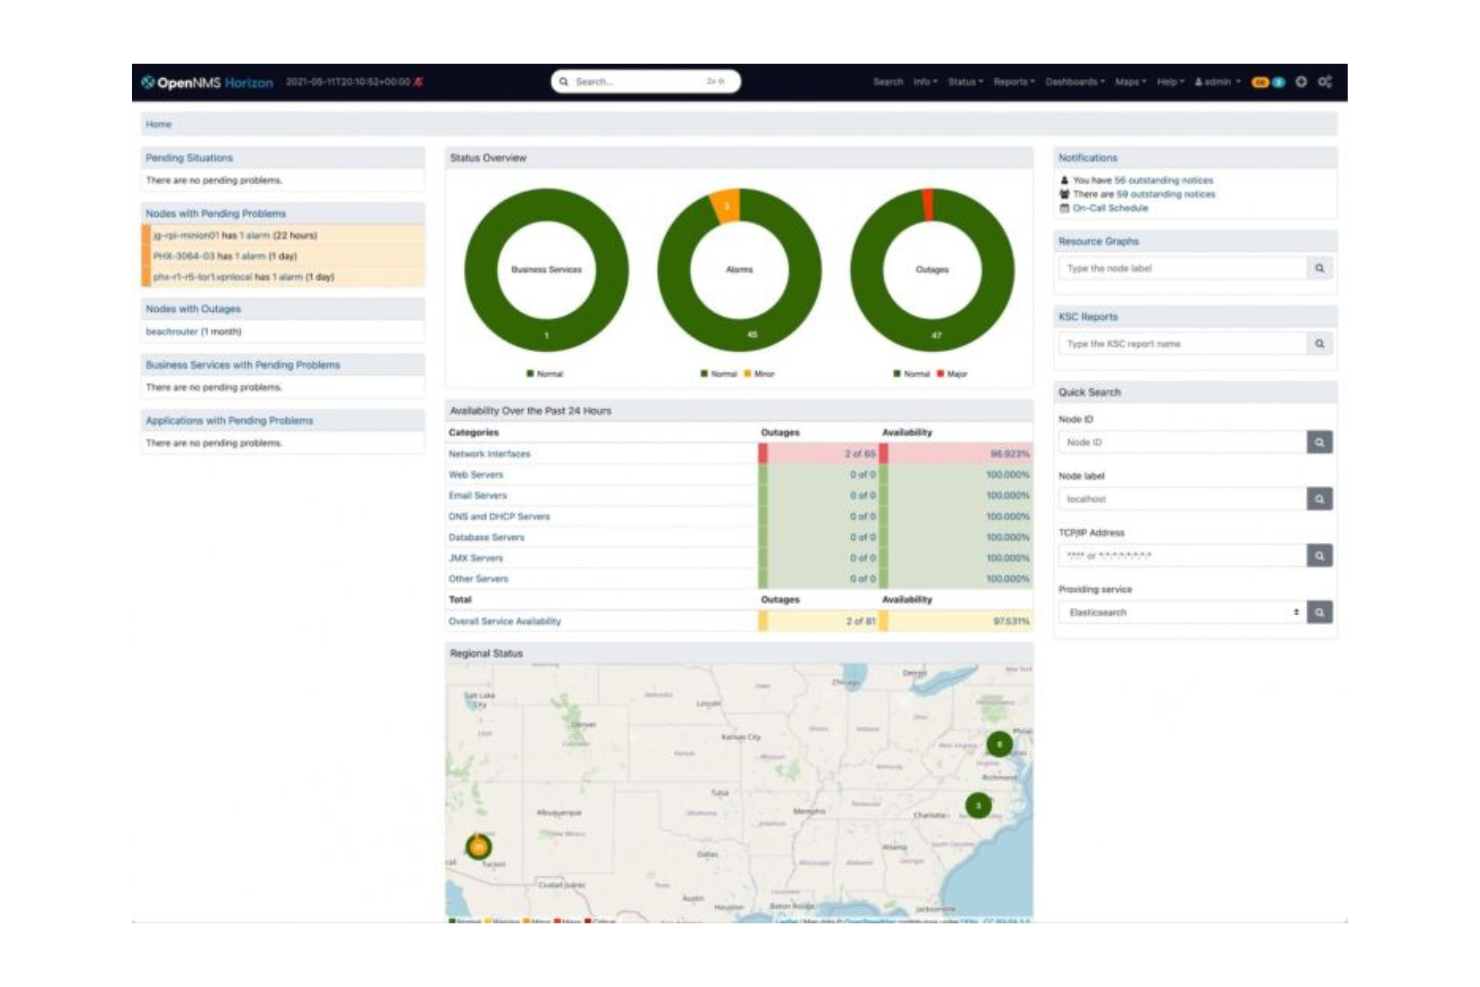
OpenNMS est une plateforme de gestion de réseau open-source conçue pour les réseaux distribués, principalement utilisée par les administrateurs réseau et les professionnels de l'informatique. Elle assure la surveillance du réseau, la gestion des événements et la mesure des performances.
Pourquoi c'est une bonne alternative à Nagios : OpenNMS est spécialement conçu pour les réseaux distribués avec des fonctionnalités telles que la gestion des événements et la surveillance des services. Il prend en charge les déploiements à grande échelle, ce qui le rend idéal pour gérer des structures réseau complexes. La plateforme propose la collecte et la visualisation des données de performance pour aider votre équipe à gérer la santé du réseau. Sa scalabilité et sa capacité à gérer les systèmes distribués le distinguent de Nagios.
Fonctionnalités et intégrations remarquables :
Fonctionnalités : gestion des événements, surveillance des services et collecte de données de performance. Elle propose également des outils de visualisation pour l'état du réseau et prend en charge les déploiements à grande échelle pour les réseaux complexes.
Intégrations : Grafana, Elasticsearch, Prometheus, Kafka, PagerDuty, Slack, Jenkins, AWS, Azure et Google Cloud Platforms
Pros and Cons
Pros:
- Prise en charge des réseaux à grande échelle
- Flexibilité open-source
- Métriques de performance détaillées
Cons:
- Nécessite une expertise technique
- Courbe d'apprentissage abrupte
Monitorix est un outil de surveillance léger conçu pour les systèmes et réseaux de petite à moyenne taille. Il aide à suivre les performances et l'utilisation des ressources du système avec un impact minimal sur les ressources système.
Pourquoi c’est une bonne alternative à Nagios : Monitorix propose une solution légère idéale pour les réseaux de petite à moyenne taille. Son installation simple vous permet de commencer la surveillance rapidement sans configurations complexes. L’outil offre une surveillance en temps réel et des données historiques pour aider votre équipe à analyser les tendances de performance. Sa faible utilisation des ressources le rend adapté aux environnements où l'efficacité du système est une priorité.
Fonctionnalités et intégrations remarquables :
Fonctionnalités comprennent une supervision en temps réel qui apporte des informations immédiates sur les performances du système. L’historique des données permet d’analyser les tendances sur la durée. Son design léger assure un impact minimal sur les ressources système, ce qui le rend efficace pour les petites infrastructures.
Intégrations incluent Nagios, Cacti, Zabbix, Grafana, InfluxDB, Elasticsearch, Prometheus, OpenNMS, SolarWinds et Splunk.
Pros and Cons
Pros:
- Conception légère
- Installation simple
- Surveillance en temps réel
Cons:
- Scalabilité limitée
- Jeu de fonctionnalités basique
Autres alternatives à Nagios
Voici d’autres alternatives à Nagios qui n’ont pas été retenues dans ma sélection principale, mais qui méritent tout de même d’être examinées :
- op5 Monitor
Idéal pour la scalabilité en entreprise
- Naemon
Idéal pour une architecture modulaireTarification sur demande
- Argus
Idéal pour la surveillance système et réseau


Critères de sélection des alternatives à Nagios
Pour sélectionner les meilleures alternatives à Nagios de cette liste, j’ai pris en compte les besoins et les difficultés courantes des acheteurs concernant les produits liés au développement logiciel, comme l’adaptabilité à la montée en charge et la facilité d’intégration. J’ai aussi utilisé le cadre d’évaluation suivant afin de garantir une analyse structurée et juste :
Fonctionnalité de base (25% de la note totale)
Pour figurer dans cette sélection, chaque solution devait répondre à ces cas d’usage courants :
- Surveillance des performances systèmes
- Alertes en temps réel
- Suivi de l’état du réseau
- Gestion des journaux et des données
- Prise en charge de plusieurs plateformes
Fonctionnalités distinctives supplémentaires (25% de la note totale)
Pour affiner encore davantage la sélection, j’ai également recherché des fonctionnalités uniques, telles que :
- Capacités d’analyse avancée
- Observabilité complète du système
- Données prédictives
- Intégration AIOps
- Tableaux de bord personnalisables
Facilité d’utilisation (10 % du score total)
Pour évaluer la facilité d’utilisation de chaque système, j’ai pris en compte les éléments suivants :
- Interface intuitive
- Navigation aisée
- Conception réactive
- Paramètres personnalisables
- Options de retour des utilisateurs
Onboarding (10 % du score total)
Pour évaluer l’expérience d’intégration pour chaque plateforme, j’ai pris en compte les aspects suivants :
- Disponibilité de vidéos de formation
- Visites interactives du produit
- Modèles préconstruits
- Accès aux chatbots
- Webinaires et démonstrations en direct
Support client (10 % du score total)
Pour évaluer les services d’assistance de chaque fournisseur de logiciels, j’ai pris en compte les éléments suivants :
- Disponibilité d’une assistance 24/7
- Accès au chat en direct
- Base de connaissances complète
- Délai de réponse aux demandes
- Qualité de l’assistance fournie
Rapport qualité/prix (10 % du score total)
Pour juger du rapport qualité/prix de chaque plateforme, j’ai examiné les critères suivants :
- Tarifs compétitifs
- Plans de paiement flexibles
- Fonctionnalités incluses dans l’offre de base
- Coût des fonctionnalités additionnelles
- Réductions pour la facturation annuelle
Avis clients (10 % du score total)
Pour avoir une idée de la satisfaction générale des clients, j’ai pris en compte les points suivants lors de la lecture des avis :
- Notes de satisfaction utilisateurs
- Problèmes fréquemment rencontrés
- Tendances des retours positifs
- Fréquence des mises à jour
- Engagement de la communauté
Pourquoi chercher une alternative à Nagios ?
Bien que Nagios soit un bon choix pour le développement logiciel, il existe de nombreuses raisons pour lesquelles certains utilisateurs recherchent des solutions alternatives. Vous pourriez vouloir une alternative à Nagios parce que…
- Vous avez besoin d’interfaces utilisateur plus intuitives
- Votre équipe a besoin d’une meilleure évolutivité
- Vous recherchez une configuration plus simple
- Vous souhaitez des capacités d’analyse avancée
- Votre entreprise a besoin de systèmes d’alerte plus rapides
Si vous vous reconnaissez dans l’un de ces cas, vous êtes au bon endroit. Ma sélection regroupe plusieurs options de développement logiciel mieux adaptées aux équipes confrontées à ces difficultés avec Nagios et recherchant des solutions alternatives. Pour les équipes souhaitant des solutions de surveillance plus larges, l’exploration des alternatives à New Relic peut offrir des options supplémentaires pour une surveillance complète de la performance des applications.
Principales fonctionnalités de Nagios
Voici quelques-unes des fonctionnalités clés de Nagios, afin de vous aider à comparer ce que proposent les solutions alternatives :
- Capacités de surveillance : Suit les performances et la disponibilité des serveurs, des applications et des dispositifs réseau.
- Système d'alerte : Envoie des notifications par e-mail ou SMS en cas de problème, permettant une réponse rapide.
- Interface web : Propose un tableau de bord convivial pour la surveillance et les rapports en temps réel.
- Plugins personnalisables : Prend en charge une variété de plugins pour des fonctionnalités étendues adaptées à des besoins spécifiques.
- Scalabilité : Peut être dimensionné pour surveiller de grands environnements avec de nombreux dispositifs.
- Soutien communautaire : Soutenu par une forte communauté pour le dépannage et l'amélioration continue.
- Réglementation des problèmes : Fonctions telles que l'accusé de réception des alertes et les gestionnaires d'événements pour la résolution automatique des incidents.
- Planification proactive : Outils pour l'analyse de tendance, la planification de capacité et la gestion des périodes de maintenance planifiées.
- Rapports : Génère des rapports de disponibilité et d'historique pour suivre la performance et la conformité aux SLA.
- Fonctionnalités multi-locataires : Permet à plusieurs utilisateurs d'accéder à des vues personnalisées de l'infrastructure.
Et ensuite :
Si vous êtes en train de rechercher un développement logiciel, contactez un conseiller SoftwareSelect pour des recommandations gratuites.
Vous remplissez un formulaire et avez une brève discussion où ils analysent précisément vos besoins. Ensuite, vous recevrez une liste restreinte de logiciels à examiner. Ils vous accompagneront également tout au long du processus d'achat, y compris lors des négociations tarifaires.