12 meilleures alternatives à Datadog examinées en 2026

Meilleures alternatives à Datadog – Liste rapide
Voici ma sélection des meilleures alternatives à Datadog :


Si vous utilisez Datadog pour la surveillance cloud, vous avez peut-être rencontré des difficultés, comme des coûts élevés ou des fonctionnalités complexes qui ne correspondent pas aux besoins de votre équipe. Vous n'êtes pas seul. De nombreux experts techniques recherchent des alternatives à Datadog pour mieux répondre à leurs exigences spécifiques.
D'après mon expérience, trouver l'outil adapté peut augmenter considérablement l'efficacité de votre équipe. C'est pourquoi j'ai testé et évalué de manière indépendante différentes alternatives à Datadog. Mon objectif est de vous proposer un guide impartial et approfondi pour vous aider à prendre une décision éclairée.
Dans cet article, je partage mes meilleures alternatives à Datadog, en mettant l'accent sur les fonctionnalités uniques et les avantages susceptibles de mieux convenir à votre équipe. Explorons ensemble les options qui pourraient mieux répondre aux besoins de votre entreprise.
Qu'est-ce que Datadog ?
Datadog est une plateforme de surveillance cloud qui vous permet de suivre en temps réel vos applications, votre infrastructure et vos journaux. Les professionnels IT, développeurs et équipes d'exploitation utilisent généralement Datadog pour surveiller les performances et résoudre rapidement les incidents. Des fonctionnalités telles que la surveillance en temps réel, la gestion des logs et des tableaux de bord personnalisables permettent d'identifier les goulots d'étranglement de performance et de maintenir la santé des systèmes. De façon générale, Datadog propose un moyen simple de garantir le bon fonctionnement de vos systèmes.
Résumé des meilleures alternatives à Datadog
Ce tableau comparatif synthétise les détails tarifaires de mes principales alternatives à Datadog pour vous aider à trouver celle qui correspond à votre budget et à vos besoins professionnels.
| Tool | Best For | Trial Info | Price | ||
|---|---|---|---|---|---|
| 1 | Best for flexible data retention | 14-day free trial + free demo available | From $0.05/GB | Website | |
| 2 | Best for AI-driven dependency mapping at scale | Free demo + 15-day free trial available | From $7/host/month (billed annually) | Website | |
| 3 | Best unified full-stack telemetry ecosystem | Free trial + free demo available | Pricing upon request | Website | |
| 4 | Best pull-based metrics engine for Kubernetes | Free-forever plan available | Free to use | Website | |
| 5 | Best for enterprise-grade security analytics | 14-day free trial + free demo available | Pricing upon request | Website | |
| 6 | Best for real-time app discovery | Free demo available | From $21.20/MVS/month | Website | |
| 7 | Best for data-source-agnostic visualization | Free plan + free trial available | From $19/month + usage | Website | |
| 8 | Best for AWS environments | Free plan available | Pay-as-you-go model | Website | |
| 9 | Best for large-scale log search | Free trial + free demo available | From $0.07/GB data ingested | Website | |
| 10 | Best for OpenTelemetry-native backend monitoring | 30-day free trial + free demo available | From $49/month | Website | |
| 11 | Best for AI-assisted troubleshooting | 14-day free trial + free demo available | From $0.20/million metric data points | Website | |
| 12 | Best for Azure integration | Free demo available | Pricing upon request | Website |
Why Trust Our Software Reviews
-

Site24x7
Visit WebsiteThis is an aggregated rating for this tool including ratings from Crozdesk users and ratings from other sites.4.6 -
GitHub Actions
Visit WebsiteThis is an aggregated rating for this tool including ratings from Crozdesk users and ratings from other sites.4.8 -
Docker
Visit WebsiteThis is an aggregated rating for this tool including ratings from Crozdesk users and ratings from other sites.4.6


Avis sur les meilleures alternatives à Datadog
Vous trouverez ci-dessous mes analyses approfondies sur les meilleures alternatives à Datadog ayant intégré ma sélection. Mes avis détaillent les principales fonctionnalités, avantages et inconvénients, intégrations et cas d’utilisation idéaux de chaque outil pour vous aider à choisir celui qui vous conviendra le mieux.
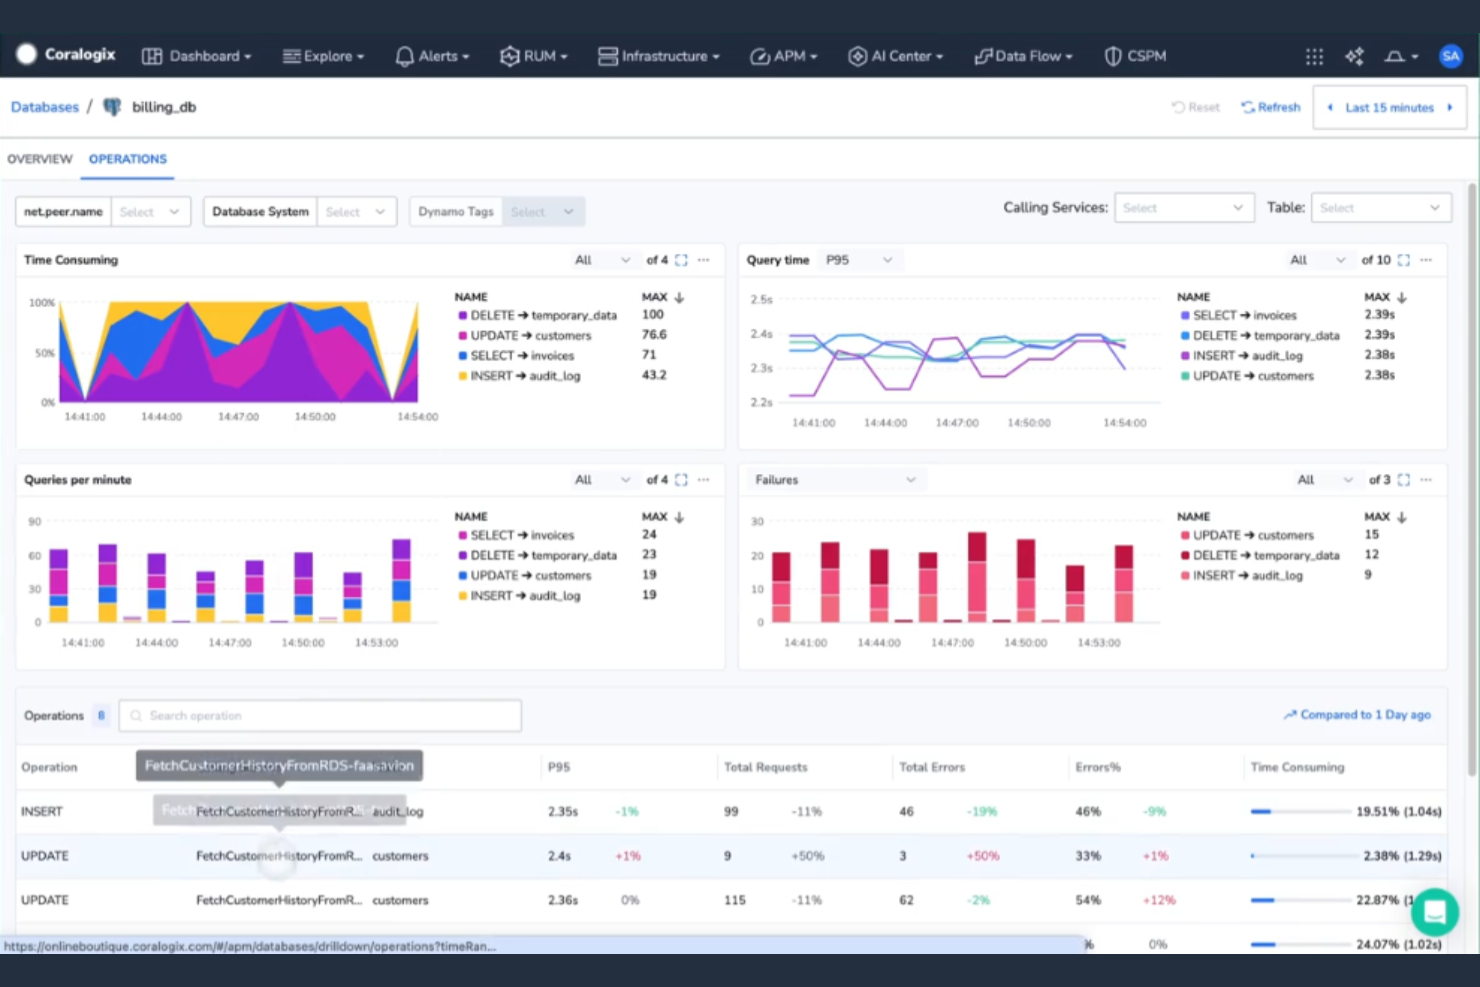
Coralogix is a log analytics and monitoring platform designed for DevOps teams and IT professionals. It helps you manage and analyze log data to gain insights and improve system performance.
Why it's a good Datadog alternative: Coralogix offers flexible data retention options, allowing you to control how long you keep your data. Its real-time analytics provide immediate insights into your logs. With machine learning capabilities, Coralogix helps you identify patterns and anomalies quickly. This can be particularly useful for teams looking to optimize data storage and retrieval.
Standout Features and Integrations:
Features include live tailing, which lets you view log data in real-time to catch issues as they happen. The platform's machine learning algorithms improve anomaly detection. You can also use its customizable dashboards to focus on the metrics that matter most to your team.
Integrations include AWS, Microsoft Azure, Google Cloud Platform, Kubernetes, Docker, GitHub, Slack, Jira, PagerDuty, and more.
Pros and Cons
Pros:
- Machine learning insights, including immediate anomaly detection
- Real-time log analytics
- Flexible data retention
Cons:
- Tiered configurations can become expensive
- Complex interface and proprietary query language
Dynatrace is an AI-powered monitoring platform used by IT and DevOps teams to gain insights into infrastructure and application performance across the entire stack. It automates monitoring and provides real-time data to optimize your systems.
Why it's a good Datadog alternative: Dynatrace's AI-driven insights help you automatically detect anomalies and predict issues before they affect users. Its full-stack monitoring covers everything from applications to microservices, providing a unified view. The AI capabilities also reduce manual work by offering automated root cause analysis. This makes it easier for your team to focus on strategic tasks rather than firefighting.
Standout Features and Integrations:
Features include real user monitoring, which provides insights into user experiences. The platform's automatic discovery maps out your entire IT environment. You also get access to API monitoring, making your integrations perform well.
Integrations include AWS, Microsoft Azure, Google Cloud, Kubernetes, ServiceNow, Slack, Jira, VMware, SAP, IBM, and more.
Pros and Cons
Pros:
- Scalable for large enterprises
- AI-driven root cause analysis
- Causal topology mapping
Cons:
- Higher licensing cost
- Challenging submenu interface
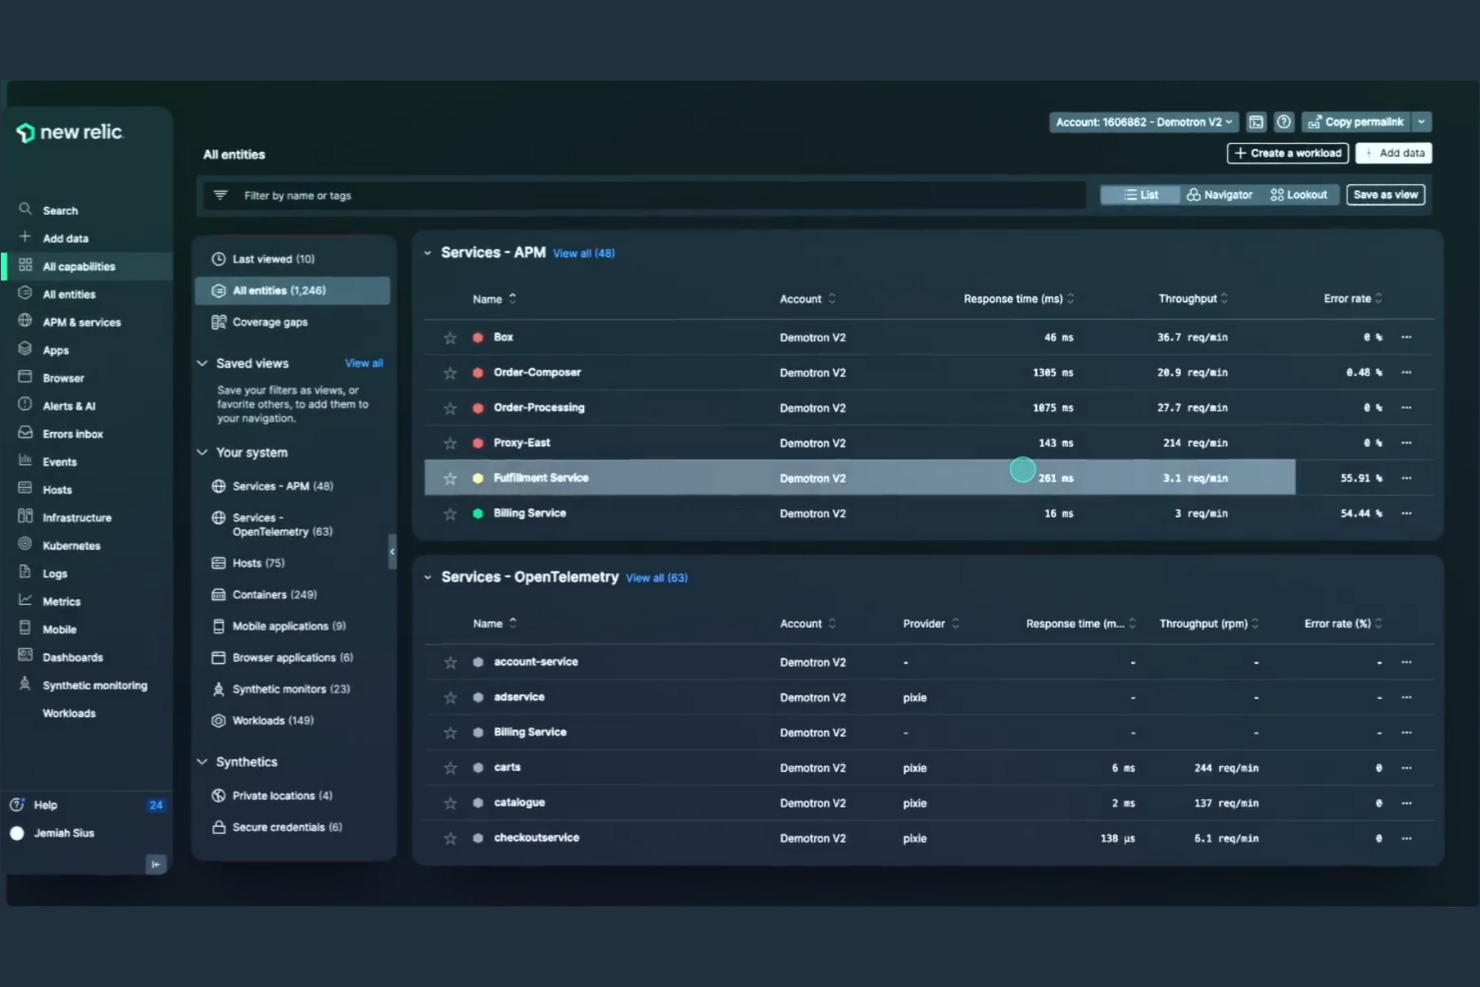
New Relic is an application performance monitoring (APM) tool utilized by developers and IT operations teams to ensure optimal application performance. It provides insights into application behavior and infrastructure health.
Why it's a good Datadog alternative: With extensive integrations, New Relic allows you to connect to a wide variety of services and platforms. Its real-time APM and alerting features help you stay on top of performance issues. Customizable dashboards give you the flexibility to tailor metrics to your team's needs. This makes it easier to manage complex environments with diverse technologies.
Standout Features and Integrations:
Features include synthetic monitoring, which simulates user interactions to catch issues early. Distributed tracing helps you understand the flow of requests in your applications. You can also use advanced analytics to gain deeper insights into your data.
Integrations include AWS, Microsoft Azure, Google Cloud, Kubernetes, Docker, Slack, PagerDuty, Jenkins, GitHub, Jira, and more.
Pros and Cons
Pros:
- Consolidated entity-centric view
- Powerful APM and tracing
- Extensive integration options
Cons:
- Some features require advanced setup
- Complex pricing model
Prometheus is an open-source monitoring and alerting toolkit primarily used by developers and IT operations teams. It focuses on capturing time series data to provide insights into system performance and reliability.
Why it's a good Datadog alternative: Prometheus provides an open-source solution allowing for a high degree of customization and flexibility. Its powerful query language, PromQL, lets you explore and analyze data efficiently. The tool's focus on time series data helps you monitor and alert on key metrics. Plus, its ability to integrate with various systems makes it adaptable to different environments.
Standout Features and Integrations:
Features include a flexible data model that supports multi-dimensional data collection. The alert manager allows you to define and manage alerts effectively. You can also use built-in visualization tools to create insightful dashboards.
Integrations include Kubernetes, Docker, Consul, etcd, Amazon EC2, Google Cloud Platform, Microsoft Azure, DigitalOcean, and Grafana.
Pros and Cons
Pros:
- Efficient time-series data handling
- Customizable query language
- Open-source flexibility
Cons:
- No native long-term storage
- Limited built-in visualization
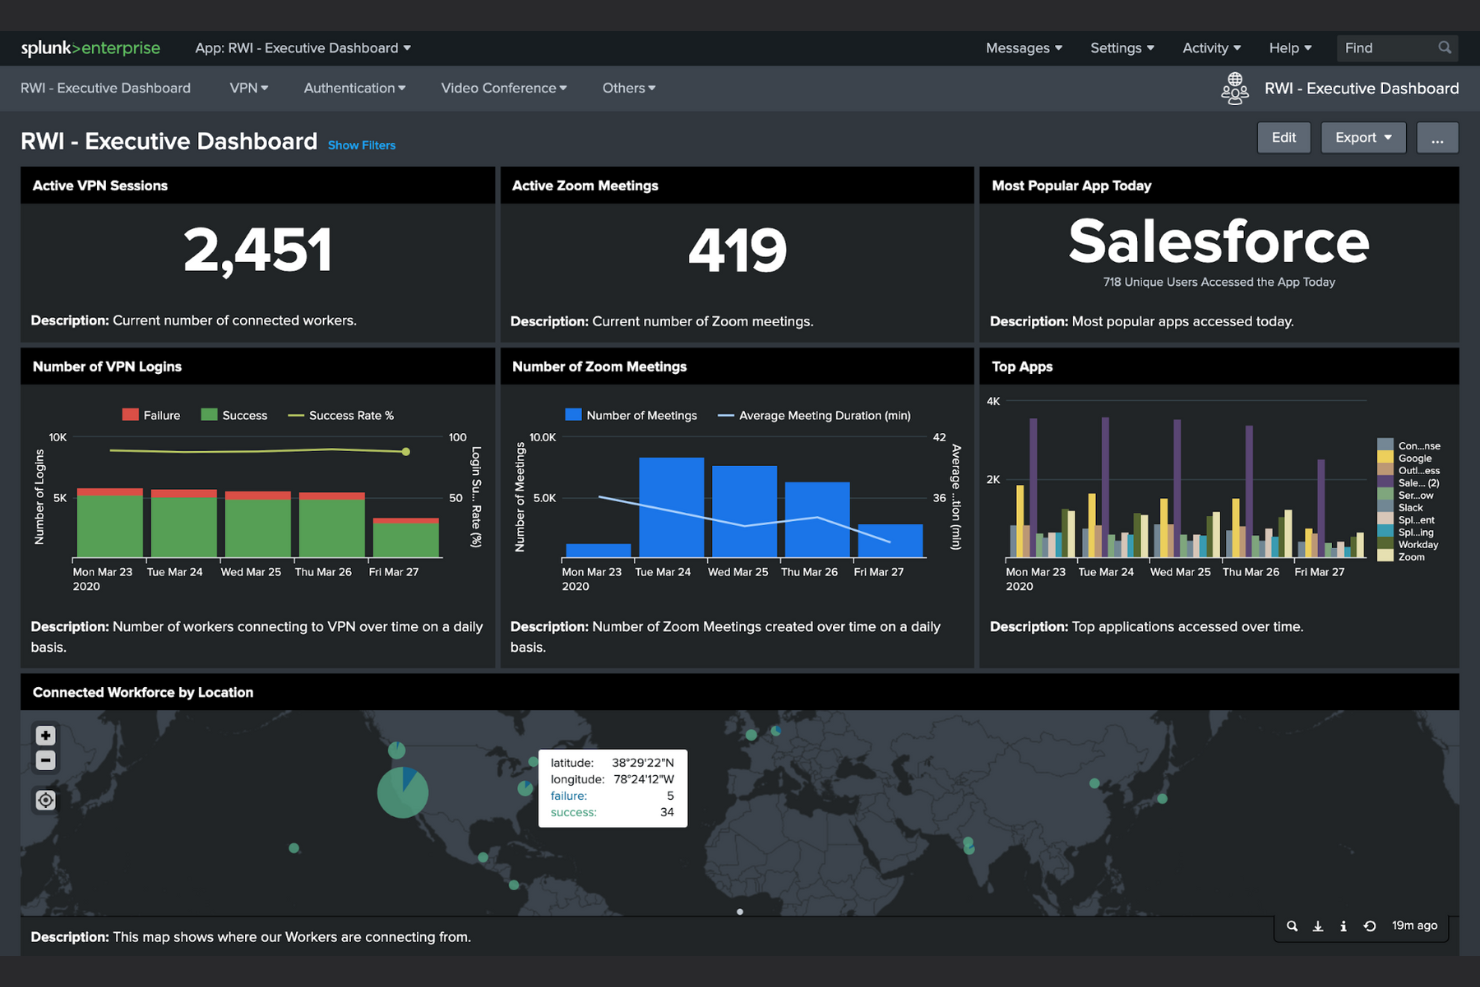
Splunk is a data analytics platform used by IT and security professionals to monitor and analyze machine-generated data. It helps you gain insights from logs, metrics, and events to improve operational performance and security.
Why it's a good Datadog alternative: Splunk excels in security analytics, including SIEM, providing advanced threat detection and response capabilities. Its powerful search and visualization tools enable you to quickly identify and mitigate security risks. The platform's ability to handle large data volumes makes it suitable for complex environments. You can also customize dashboards to focus on the security metrics that matter most to your team.
Standout features and integrations:
Features include advanced search capabilities that allow you to explore your data in detail. The platform's machine learning tools improve predictive analytics for better decision-making. You can also benefit from real-time monitoring to keep your systems secure.
Integrations include AWS, Microsoft Azure, Google Cloud Platform, AppDynamics, ServiceNow, Docker, Kubernetes, Salesforce, Cisco, Okta, Palo Alto Networks, and more.
Pros and Cons
Pros:
- Extensive integration marketplace
- Strong security and SIEM tools
- Advanced log analytics
Cons:
- High total cost of ownership
- Heavy indexer maintenance
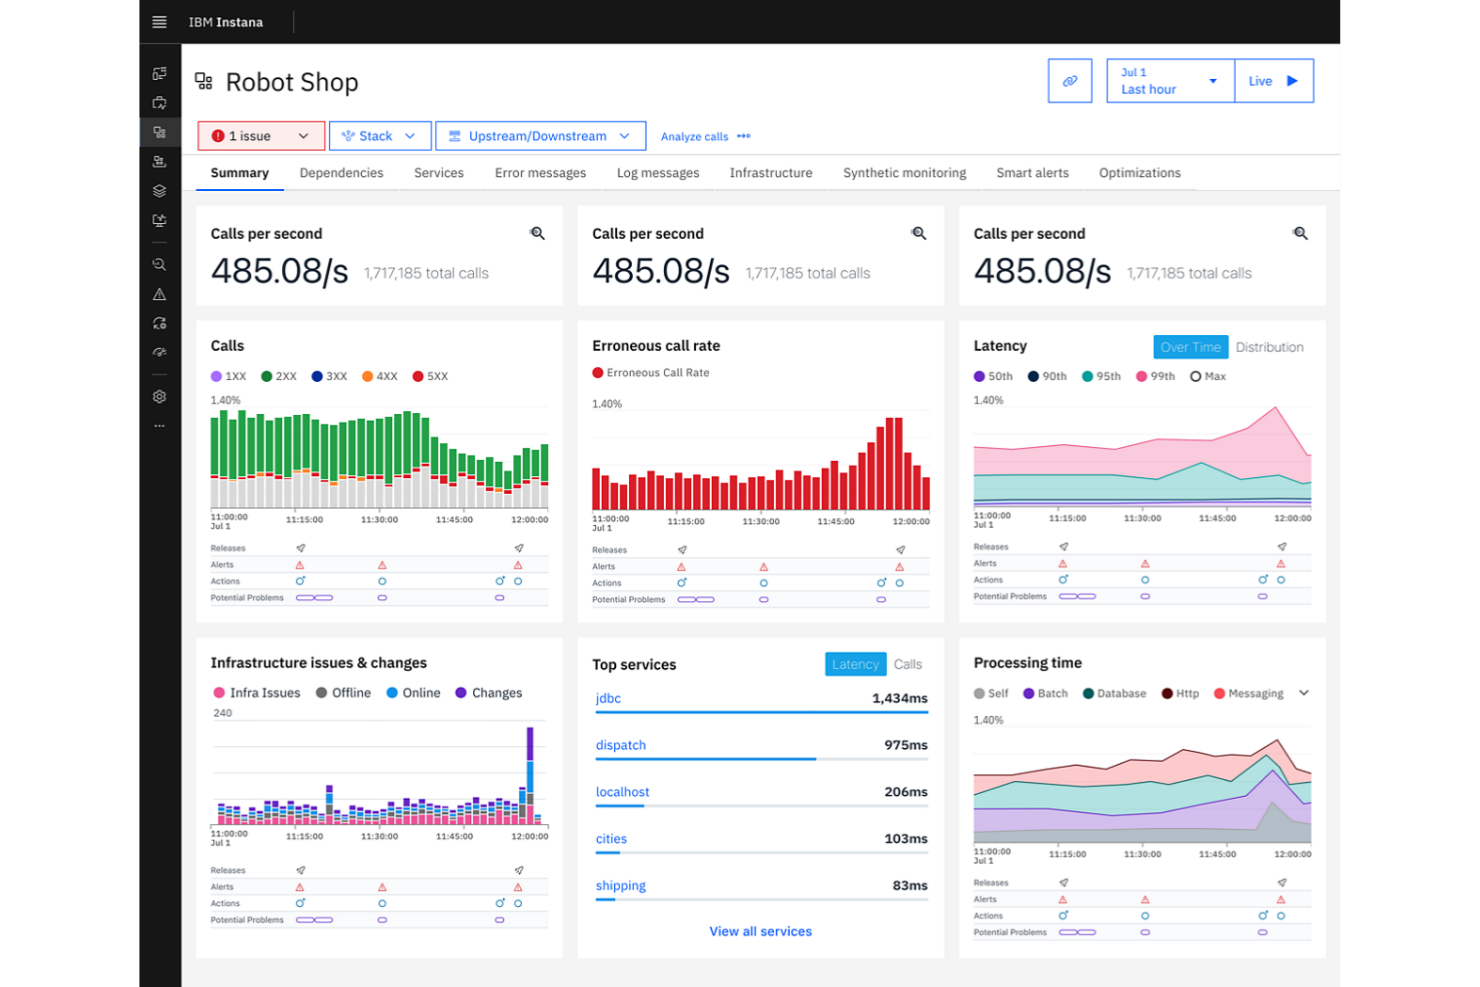
IBM Instana is an APM tool designed for DevOps and IT operations teams. It provides real-time insights into application performance and infrastructure health.
Why it's a good Datadog alternative: With real-time AI insights and correlation capabilities, IBM Instana automatically detects issues and provides actionable data to resolve them. Its automatic discovery and mapping of services gives you a complete view of your environment. The tool's AI-driven root cause analysis helps you quickly identify and fix problems. Continuous updates mean your team always has the latest information at their fingertips.
Standout Features and Integrations:
Features include continuous integration with DevOps workflows to improve your team's efficiency. The platform offers end-to-end transaction tracing to monitor the user experience. You can also access detailed infrastructure monitoring for deeper insights into system performance.
Integrations include Kubernetes, Docker, AWS, Microsoft Azure, Google Cloud Platform, IBM Cloud, Red Hat OpenShift, VMware, Jenkins, Grafana, and more.
Pros and Cons
Pros:
- Strong Kubernetes support
- Automatic dependency mapping
- Real-time tracing and monitoring
Cons:
- Steep initial configuration
- Opaque per-MVS pricing
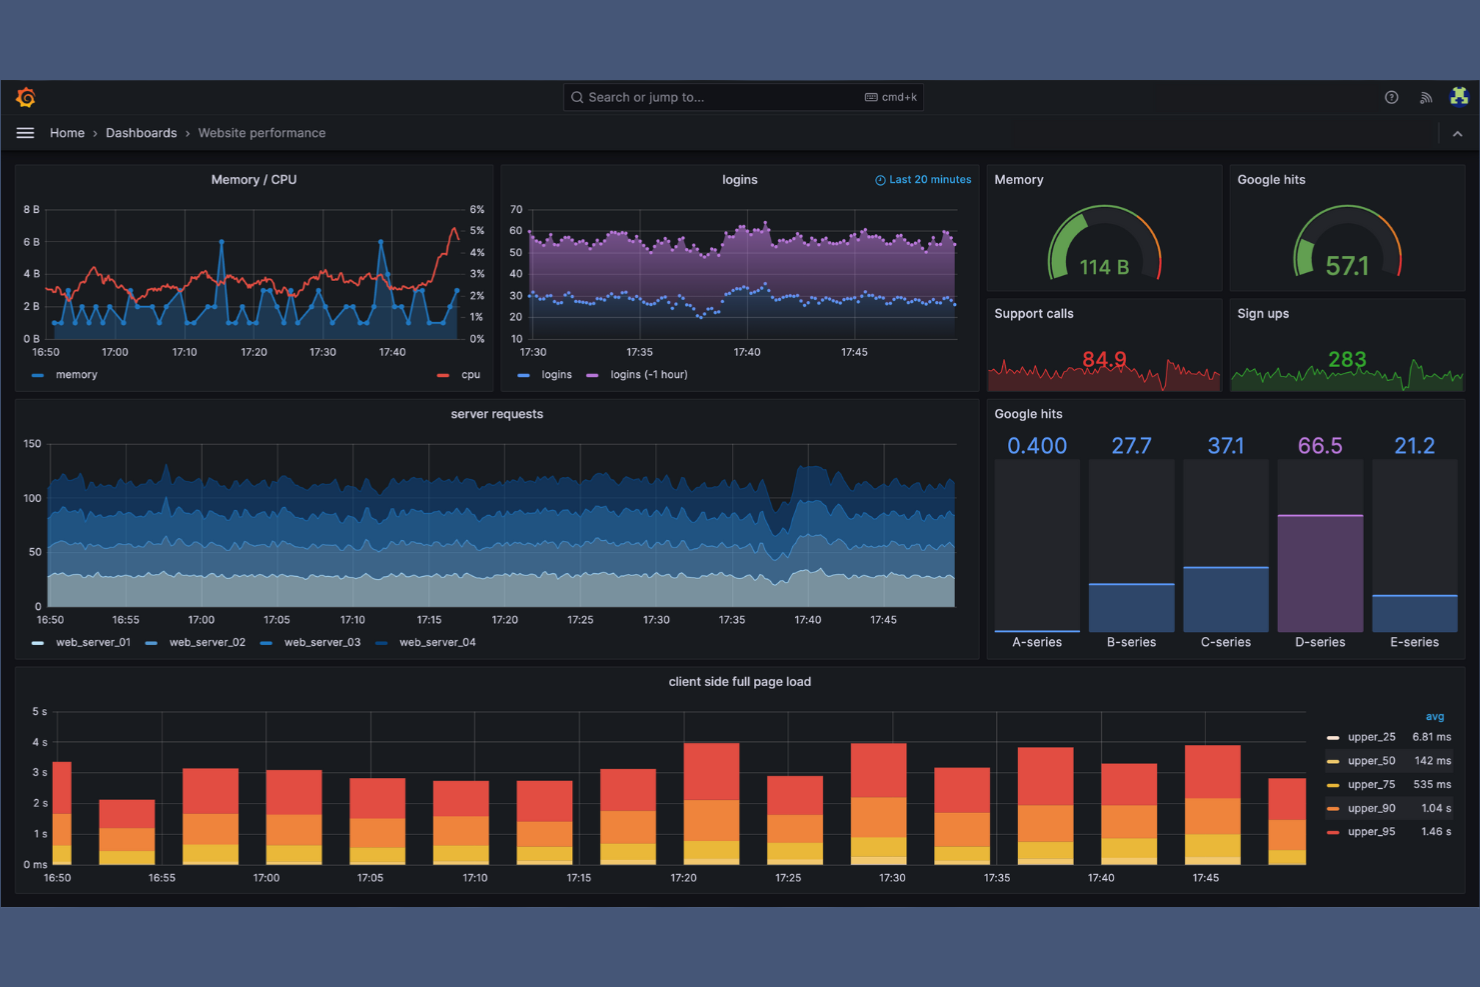
Grafana is a data visualization and monitoring platform used by IT and DevOps teams to create interactive and shareable dashboards. It helps you monitor and analyze metrics from various data sources.
Why it's a good Datadog alternative: Grafana excels in visualizing metrics with its wide range of customizable dashboards. You can tailor these dashboards to display the data that's most relevant to your team. The platform's flexible alerting system keeps you informed about critical changes. Its open-source nature means you can adapt it to fit your exact needs.
Standout Features and Integrations:
Features include templating, which lets you create reusable and dynamic dashboards. The annotation feature helps you mark important events on graphs for context. You can also use its alerting capabilities to receive notifications based on specific thresholds.
Integrations include Grafana Labs stack, Prometheus, InfluxDB, Elasticsearch, AWS CloudWatch, Microsoft Azure Monitor, Google Cloud, MySQL, PostgreSQL, Graphite, OpenTSDB, and more.
Pros and Cons
Pros:
- Strong visualization capabilities
- Efficient data aggregation
- Advanced multi-source visualization
Cons:
- Limited built-in analytics
- High operational complexity
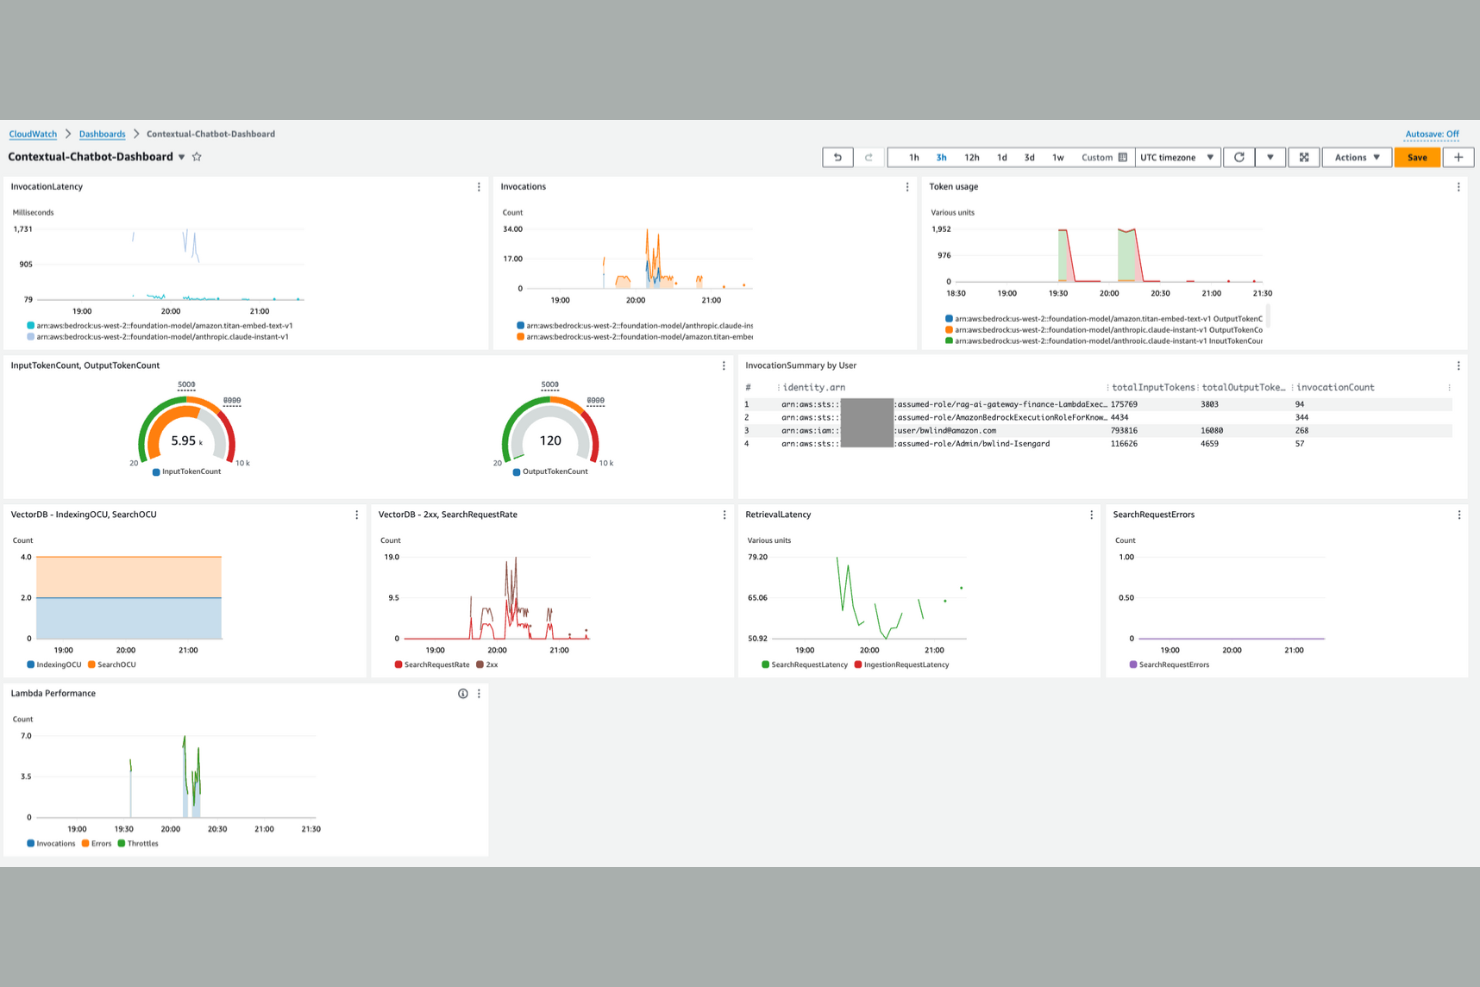
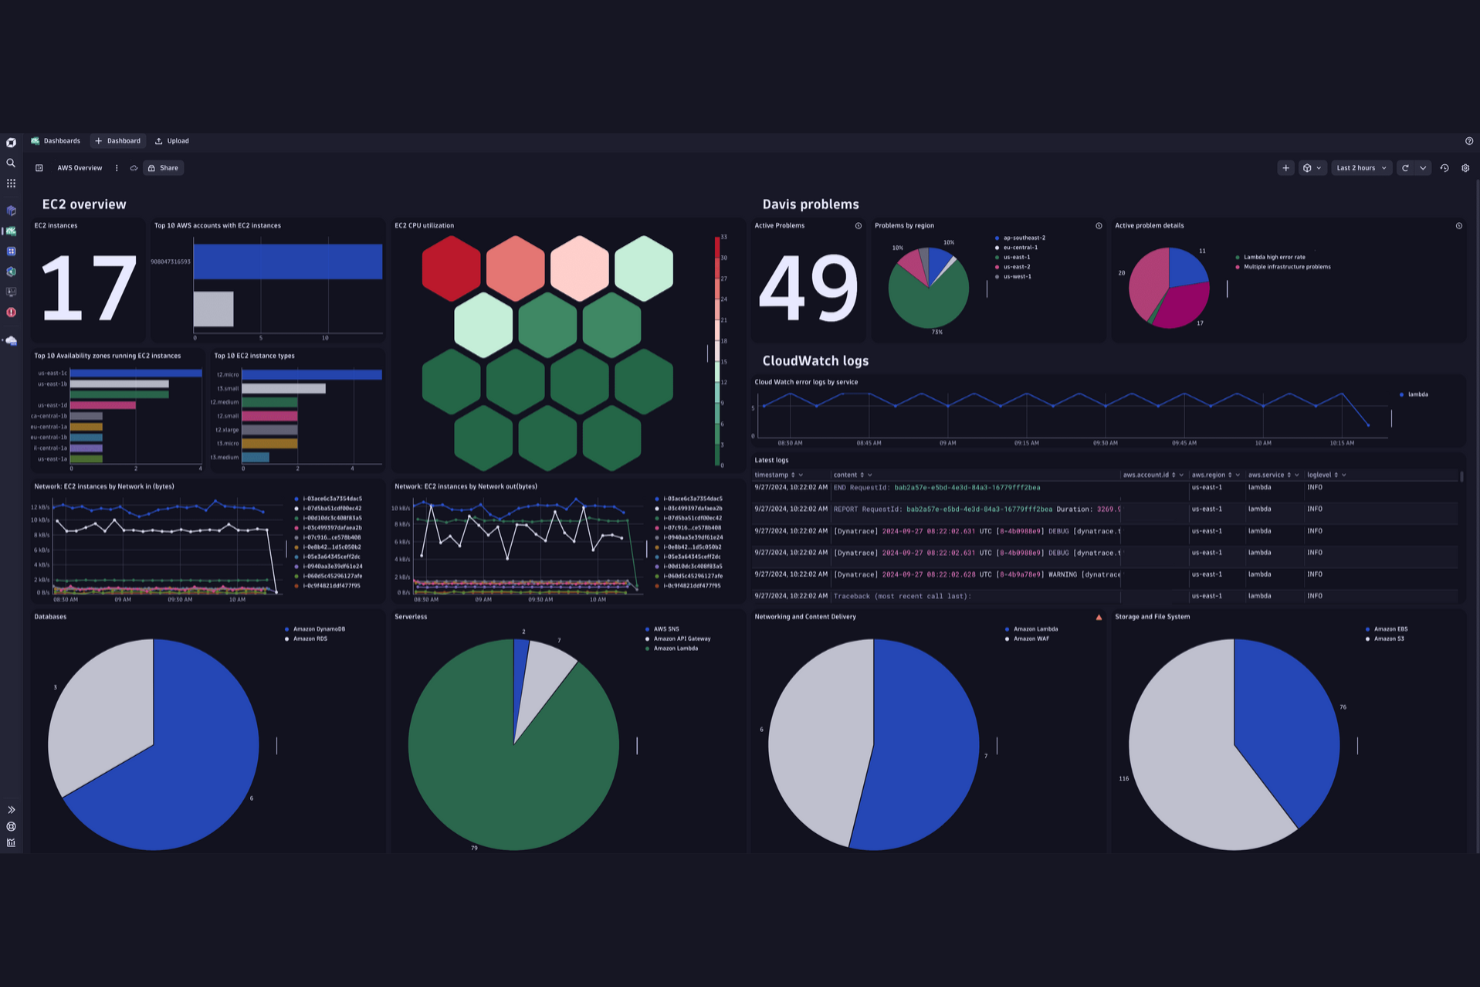
Amazon CloudWatch is a monitoring and management service built for developers, system operators, and IT managers who are using AWS resources. It helps you collect and track metrics, monitor log files, and set alarms.
Why it's a good Datadog alternative: With its deep integration with AWS, Amazon CloudWatch offers coherent monitoring of all your AWS resources. It provides detailed performance data and operational health insights. The service's ability to set alarms based on metric thresholds helps in proactive management. Additionally, its automatic scaling feature maintains your application's performance levels.
Standout Features and Integrations:
Features include detailed monitoring, allowing you to collect and analyze metrics at one-minute intervals. The service also offers log data storage and management, helping you troubleshoot issues quickly. You can set custom dashboards to visualize metrics that matter most to your team.
Integrations include AWS Lambda, Amazon EC2, Amazon S3, Amazon RDS, Amazon ECS, AWS Elastic Beanstalk, Amazon API Gateway, AWS CloudTrail, AWS Step Functions, AWS IoT, and more.
Pros and Cons
Pros:
- Customizable alarms
- Detailed performance data
- Integrated with AWS security
Cons:
- Requires AWS expertise
- Limited cross-cloud visibility
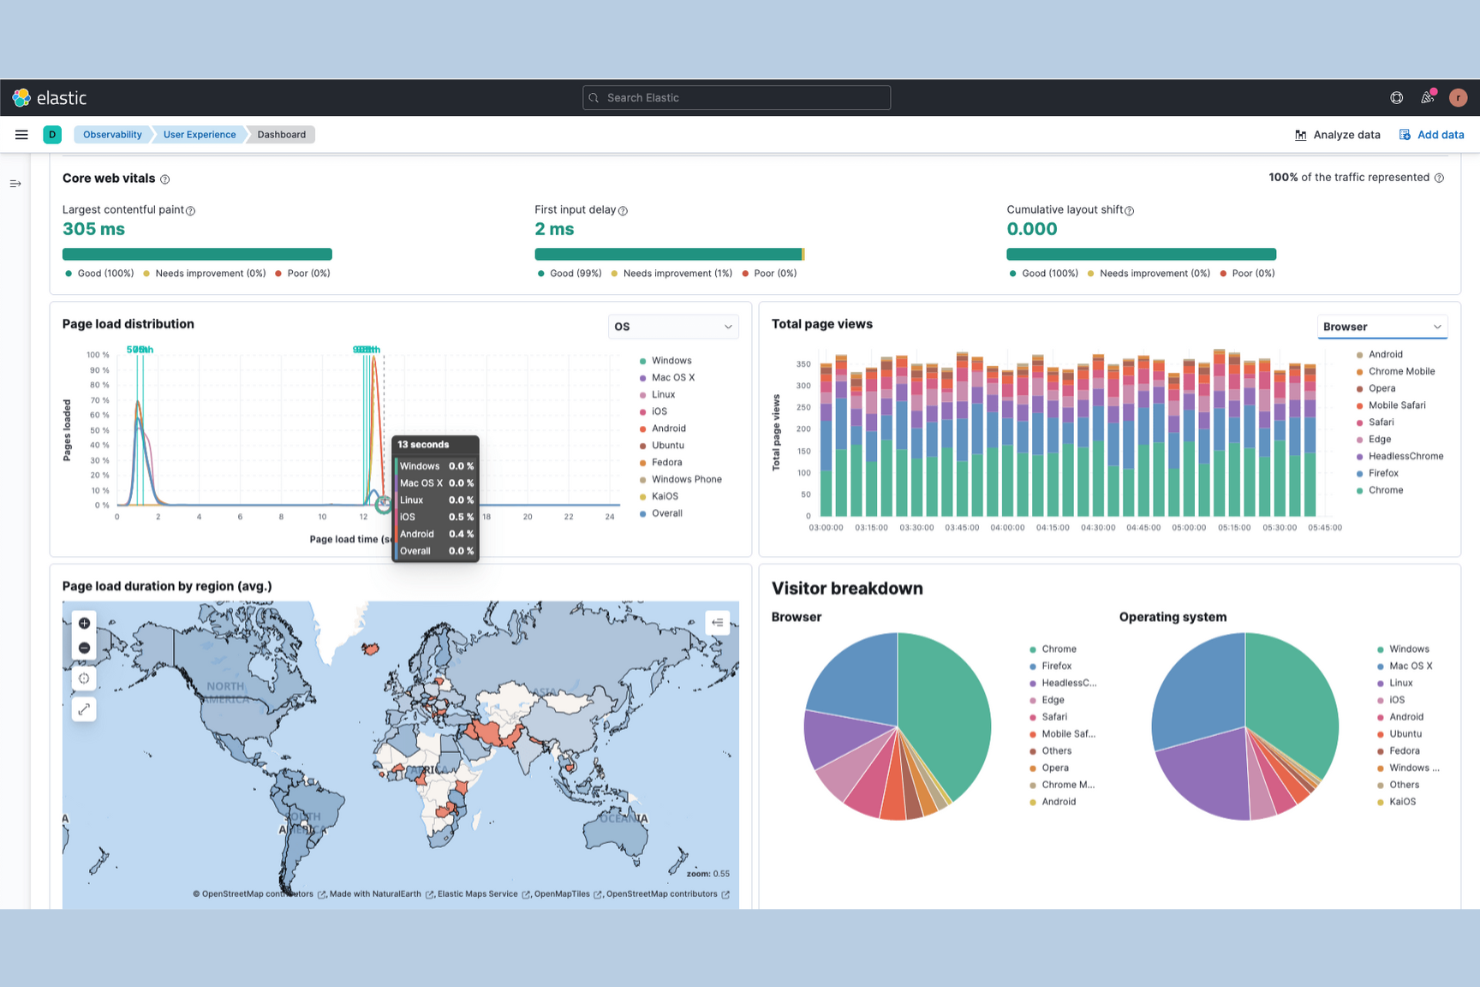
Elastic is a search-powered analytics platform that serves developers and IT teams needing to search, analyze, and visualize data in real time. It supports various functions, including logging, security, and observability.
Why it's a good Datadog alternative: Elastic excels in search capabilities, making it easier to find and analyze specific data points. Its observability tools provide deep insights into application performance and infrastructure health. The platform's scalability allows you to handle large volumes of data efficiently. With customizable dashboards, your team can focus on the metrics that matter most.
Standout Features and Integrations:
Features include powerful search capabilities that let you query large datasets quickly. The platform's machine learning features help you detect anomalies in your data. You can also use its visualization tools to create insightful dashboards that highlight key metrics.
Integrations include Kubernetes, Docker, AWS, Microsoft Azure, Google Cloud Platform, Apache Kafka, Apache Hadoop, Logstash, Beats, MySQL, and more.
Pros and Cons
Pros:
- Highly flexible data ingestion methods
- Scalable log and metrics analysis
- Strong full-text search capabilities
Cons:
- Can be resource-intensive
- Potential for operational lock-in
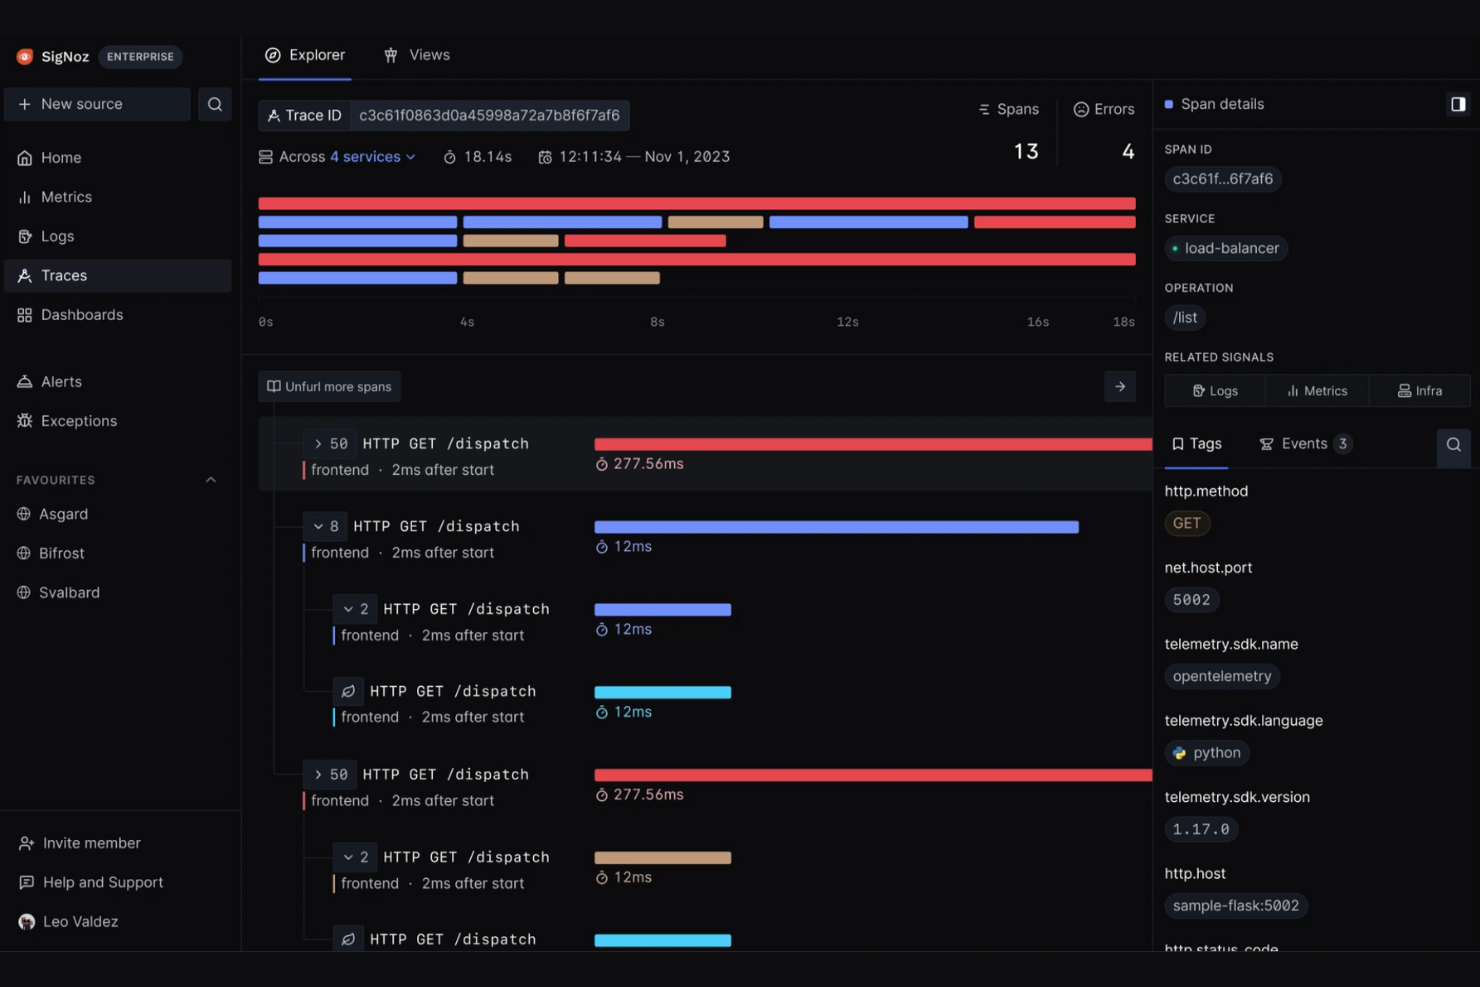
SigNoz is an open-source, full-stack observability tool designed for monitoring applications and infrastructure. Developers and IT teams primarily use it to track performance metrics and troubleshoot issues.
Why it's a good Datadog alternative: As an open-source alternative, SigNoz provides the flexibility and cost-effectiveness needed to self-host and avoid vendor lock-in. Features such as distributed tracing, log management, and customizable dashboards support open-source monitoring. You can also benefit from high-performance data ingestion with ClickHouse, which increases data query speed. SigNoz's commitment to OpenTelemetry future-proofs and adapts to your team's changing needs.
Standout Features and Integrations:
Features include real-time alerts that notify your team of issues as they arise. The customizable dashboards let you tailor views to your specific needs. You can also leverage distributed tracing to pinpoint performance bottlenecks.
Integrations include Kubernetes, Prometheus, OpenTelemetry, and more.
Pros and Cons
Pros:
- Vendor-neutral OTel standard
- Self-hosting flexibility
- High-speed telemetry correlation
Cons:
- Less mature enterprise features
- Smaller integration ecosystem
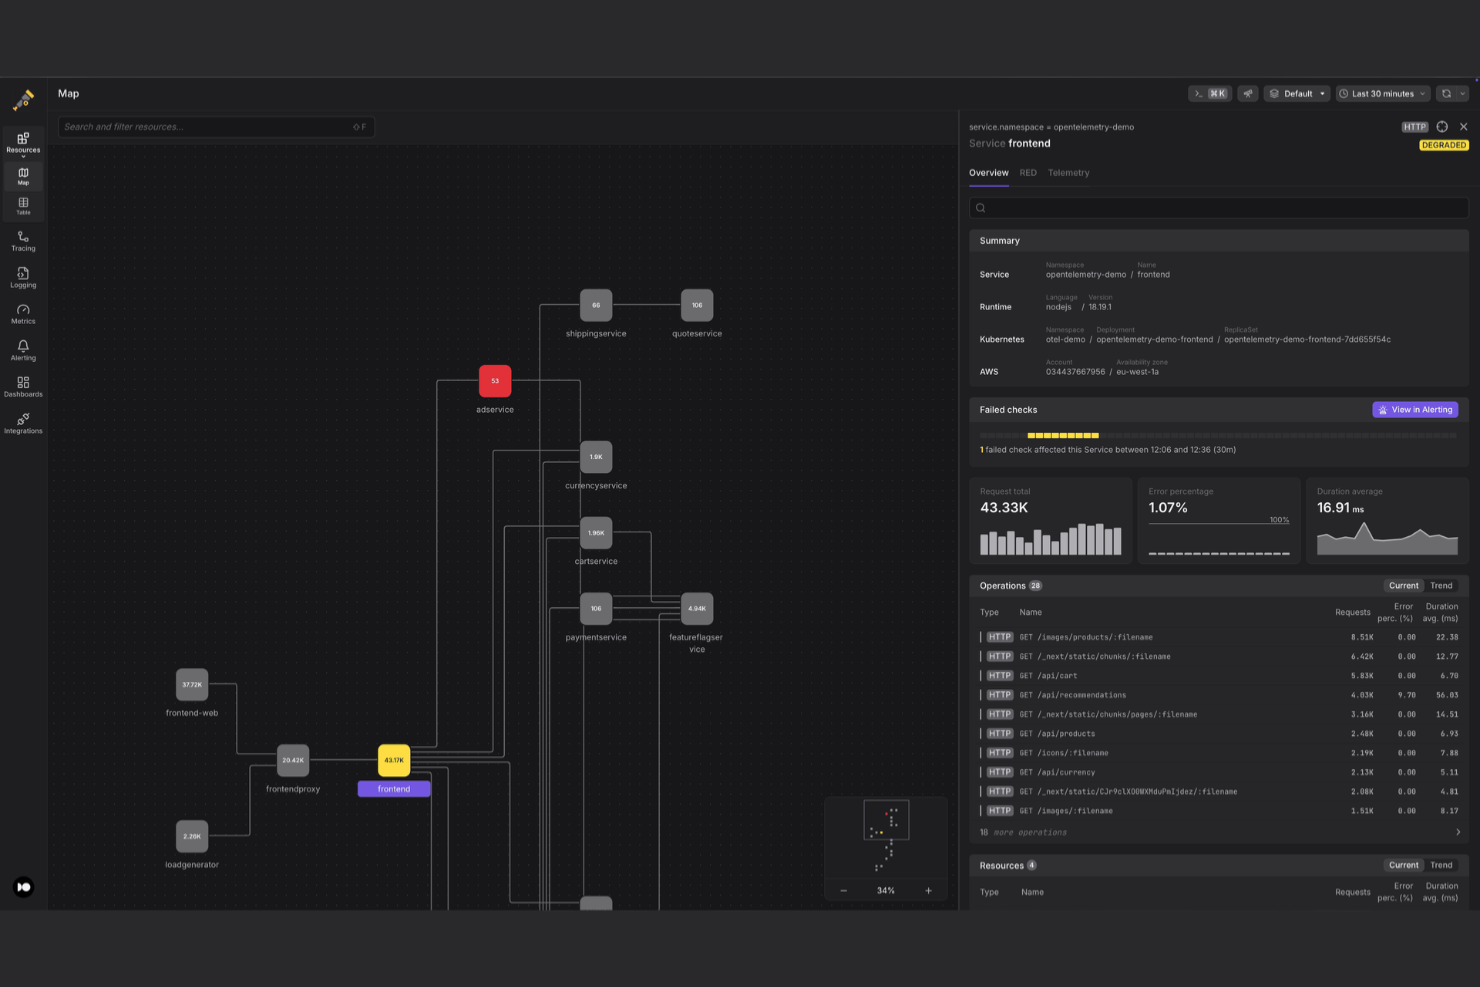
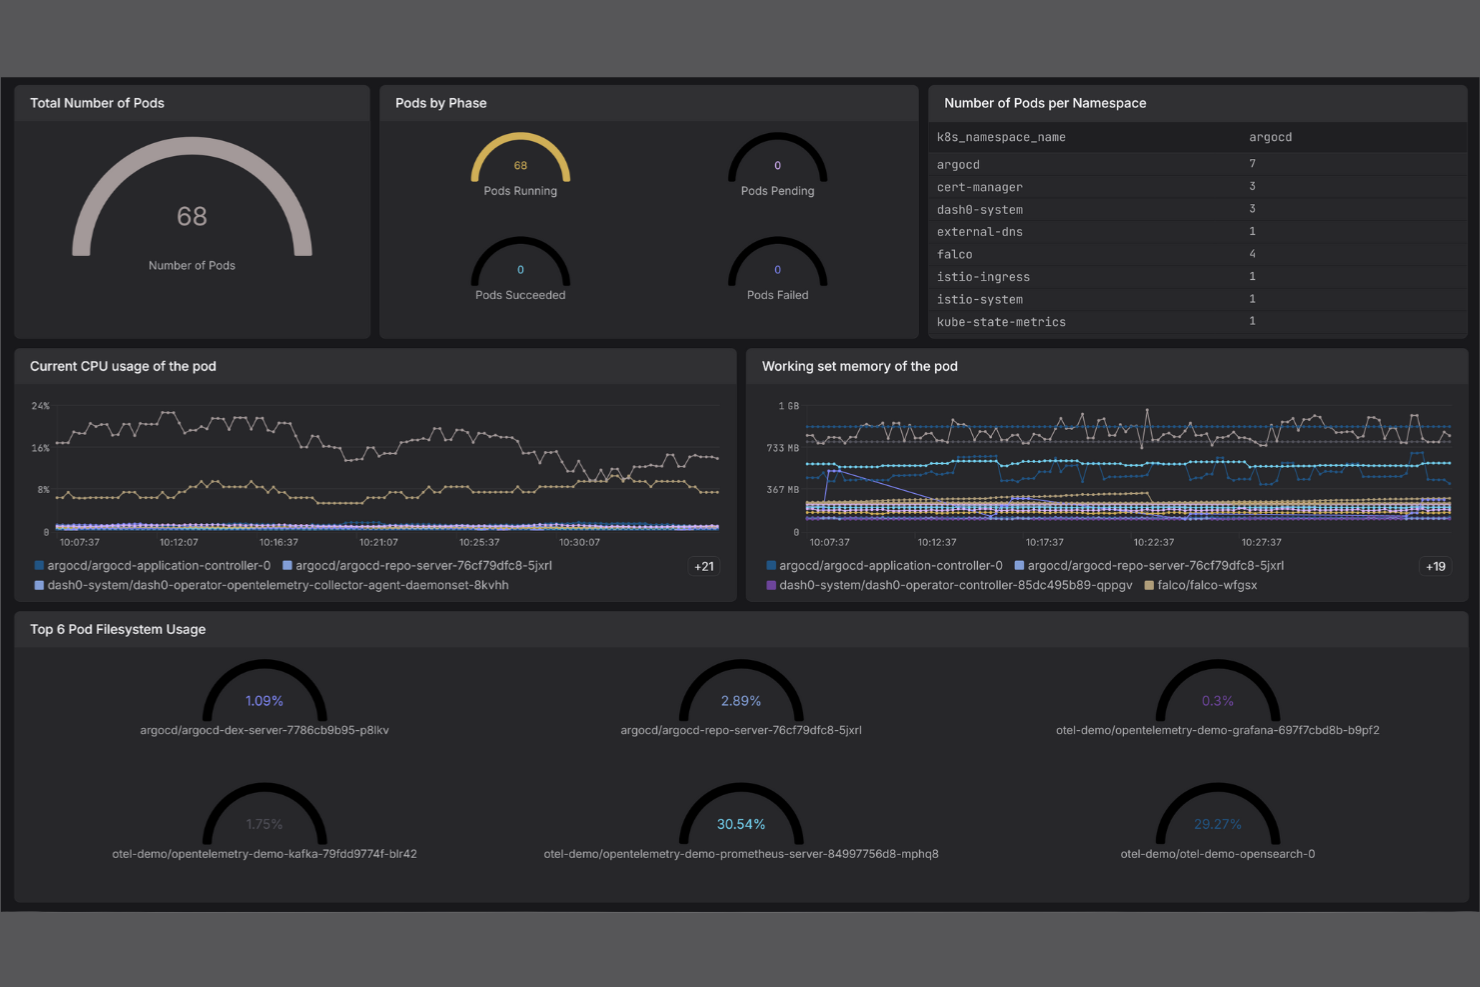
Dash0 is an AI-native observability platform aimed at developers, SREs, and platform engineers. It helps simplify the monitoring and management of logs, metrics, and traces.
Why it's a good Datadog alternative: Dash0 offers AI-native observability, allowing for simplified monitoring without complex setups. Its instant log filtering and centralized metrics monitoring ensure you can track performance efficiently. The platform's OpenTelemetry-native design supports instrumentation, provides flexibility, and prevents vendor lock-in. Real-time tracing and customizable dashboards enable your team to manage and visualize data more effectively.
Standout Features and Integrations:
Features include instant log filtering, which makes it easy to find specific logs quickly. The centralized metrics monitoring lets you keep an eye on all your key performance indicators in one place. You can also use real-time tracing to gain immediate insights into application performance.
Integrations include Kubernetes, Prometheus, AWS, Google Cloud Platform, Microsoft Azure, Datadog, Grafana, and more.
Pros and Cons
Pros:
- OTEL-first troubleshooting
- Real-time tracing
- Instant log filtering
Cons:
- Limited integration capabilities
- Lacks some advanced functionalities
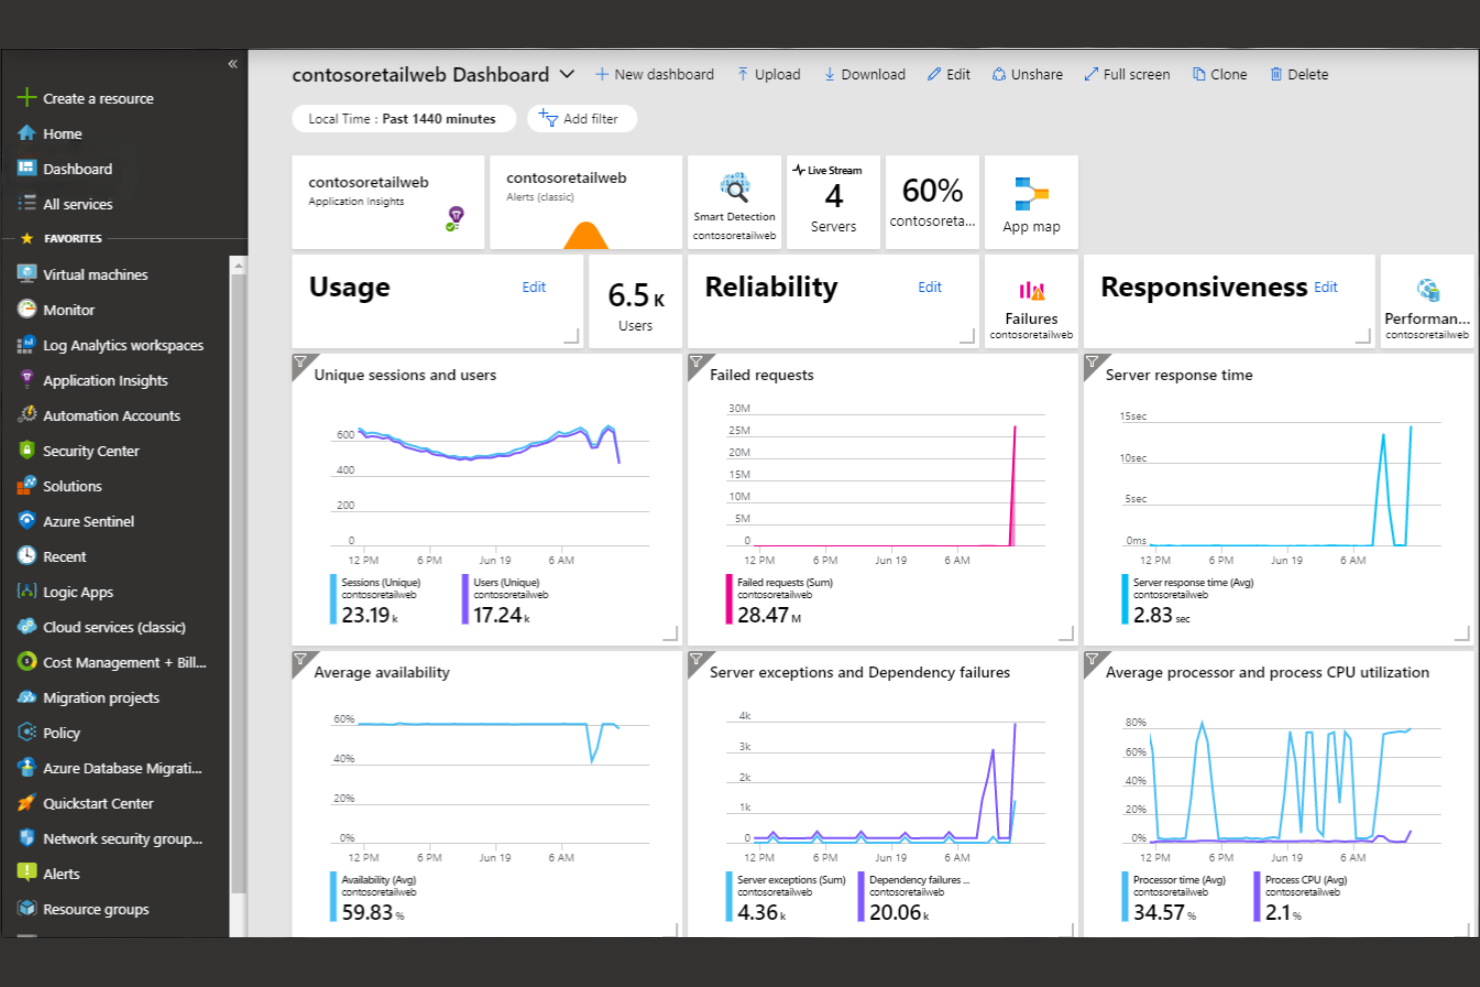
Azure Monitor is an all-in-one monitoring service designed for IT professionals and developers using Microsoft Azure. It collects, analyzes, and acts on telemetry data from your cloud and on-premises environments.
Why it's a good Datadog alternative: With native Microsoft Azure integration, Azure Monitor provides smooth monitoring across your Azure resources. It offers built-in analytics for deep insights into your applications. The service's ability to create alerts based on custom metrics notifies you promptly about any pipeline issues. Additionally, its scalability supports large and dynamic environments, making it ideal for growing businesses.
Standout Features and Integrations:
Features include log analytics, which help you query and analyze log data efficiently. Application insights provide end-to-end monitoring of your applications. The service also includes network performance monitoring to track and diagnose network issues.
Integrations include Azure Automation, Azure Log Analytics, Azure Event Hubs, Azure Logic Apps, Azure Functions, Azure DevOps, Microsoft Graph, Power BI, and more.
Pros and Cons
Pros:
- Supports hybrid cloud setups
- Built-in log analytics tools
- Native Microsoft Azure integration and observability
Cons:
- Limited visibility into non-Azure environments
- Significant manual setup for dashboards and alerts
Autres alternatives à Datadog
Voici quelques autres alternatives à Datadog qui n’ont pas été retenues dans ma sélection principale mais qui méritent d’être explorées :
- Sumo Logic
For cloud-native log analytics
- Zabbix
Open-source, on-prem monitoring
- LogicMonitor
For hybrid infrastructure monitoring
- ManageEngine Applications Manager
For unified app performance
- Sentry
For application error tracking
- Better Stack
For incident response
- HyperDX
For real-time debugging
- Chronosphere
For cloud-native scale metrics


Critères de sélection des alternatives à Datadog
Pour sélectionner les meilleures alternatives à Datadog figurant dans cette liste, j'ai pris en compte les besoins courants et les points de douleur des acheteurs concernant les plateformes de surveillance cloud, comme la scalabilité et la capacité d'intégration. J'ai aussi suivi le cadre suivant pour garantir une évaluation structurée et équitable :
Fonctionnalités essentielles (25 % de la note totale)
Pour apparaître dans cette sélection, chaque solution devait répondre aux cas d'usage suivants :
- Surveillance des performances système
- Alerte sur anomalies
- Visualisation des métriques
- Collecte des logs
- Prise en charge des environnements cloud
Fonctionnalités différenciantes (25 % de la note totale)
Pour affiner encore la sélection, j'ai également recherché des fonctionnalités uniques, telles que :
- Analyses assistées par IA
- Tableaux de bord personnalisables
- Analyses en temps réel
- Analytique prédictive
- Prise en charge multi-cloud
Facilité d’utilisation (10 % du score total)
Pour évaluer la facilité d’utilisation de chaque système, j’ai pris en compte les éléments suivants :
- Interface utilisateur intuitive
- Navigation aisée
- Options de personnalisation
- Accessibilité sur tous les appareils
- Efficacité des flux de travail
Intégration des nouveaux utilisateurs (10 % du score total)
Pour évaluer l’expérience d’intégration sur chaque plateforme, j’ai pris en compte les éléments suivants :
- Disponibilité de vidéos de formation
- Tours de produit interactifs
- Niveau de courbe d’apprentissage requis
- Webinaires en direct
- Assistance via chatbot
Service client (10 % du score total)
Pour évaluer le service client de chaque fournisseur de logiciel, j’ai pris en compte les éléments suivants :
- Disponibilité de l’assistance 24h/24 et 7j/7
- Temps de réponse
- Support multicanal
- Accès à la base de connaissances
- Assistance personnalisée
Rapport qualité/prix (10 % du score total)
Pour juger du rapport qualité/prix de chaque plateforme, j’ai pris en compte les éléments suivants :
- Tarification concurrentielle
- Offre fonctionnelle
- Souplesse de licence
- Coût des modules complémentaires
- Retour sur investissement
Avis clients (10 % du score total)
Pour apprécier la satisfaction globale des clients, j’ai pris en compte les éléments suivants lors de la lecture des avis :
- Satisfaction des utilisateurs
- Réclamations courantes
- Appréciation des fonctionnalités
- Retour sur le support
- Fiabilité du produit
Pourquoi chercher une alternative à Datadog ?
Bien que Datadog soit une bonne plateforme de supervision cloud, il existe plusieurs raisons pour lesquelles certains utilisateurs recherchent des solutions alternatives. Vous pourriez chercher une alternative à Datadog car…
- Vous avez besoin d’options tarifaires plus abordables
- Votre équipe requiert une configuration et une gestion plus simples
- Vous cherchez une meilleure intégration avec des outils spécifiques
- Votre entreprise a besoin de davantage d’options de personnalisation
- Vous cherchez un support pour une région géographique donnée
- Votre équipe souhaite de meilleurs contrôles de confidentialité des données
Si l’un de ces cas correspond à votre situation, vous êtes au bon endroit. Ma liste comprend plusieurs options de plateformes de supervision cloud mieux adaptées aux équipes rencontrant ces défis avec Datadog et souhaitant explorer des solutions alternatives.
Fonctionnalités clés de Datadog
Voici quelques-unes des fonctionnalités principales de Datadog, afin de vous aider à comparer et évaluer ce que proposent les solutions alternatives :
- Supervision de l’infrastructure : Surveille les métriques, conteneurs et réseaux pour garantir le bon fonctionnement de vos systèmes.
- Supervision des performances applicatives : Donne de la visibilité sur la performance des applications et la gestion des bases de données pour optimiser l’expérience utilisateur.
- Gestion des journaux : Permet de gérer les logs avec des fonctions telles que l’analyse de données sensibles pour assurer sécurité et conformité.
- Supervision de l’utilisateur réel : Suit les parcours utilisateur et la performance du front-end afin d’améliorer l’expérience numérique.
- Supervision synthétique : Simule les interactions des utilisateurs afin de garantir la disponibilité et le temps de fonctionnement.
- Supervision de la sécurité : Fournit une détection des menaces en temps réel et la gestion de la conformité pour sécuriser vos données.
- Gestion des services : Facilite la gestion des incidents et des workflows de prise en charge pour optimiser l’efficacité opérationnelle.
- Capacités d’IA : Utilise des outils d’intelligence artificielle pour détecter les anomalies et surveiller la performance des modèles afin d’apporter des informations approfondies.
- Supervision serverless : Permet de surveiller les applications serverless pour garantir leurs meilleures performances.
Et maintenant :
Si vous êtes en train d’évaluer une plateforme de supervision cloud, contactez gratuitement un conseiller SoftwareSelect pour recevoir des recommandations personnalisées.
Vous remplissez un formulaire et discutez brièvement pour détailler vos besoins spécifiques. Ensuite, vous recevrez une liste restreinte de logiciels à examiner. Ils vous accompagneront même tout au long du processus d'achat, y compris lors des négociations tarifaires.