Die 10 besten Profiling-Tools zur Leistungssteigerung 2026

10 Beste Profiling-Tools Shortlist


Profiling-Tools helfen Ihnen dabei, die Performance Ihrer Software zu messen und zu analysieren, um Engpässe zu identifizieren und zu beheben.
Wenn Sie jemals versucht haben, durch das Durchsehen von Logs Verzögerungen, Speicherlecks oder CPU-Spitzen zu diagnostizieren, wissen Sie, wie frustrierend das sein kann. Diese Tools geben Ihnen einen klaren Einblick, was wirklich hinter den Kulissen passiert, sodass Sie nicht raten müssen.
Ich habe sowohl mit Open-Source- als auch mit kommerziellen Profiler-Tools in verschiedenen Technologiestacks gearbeitet und weiß, worauf es in der Praxis ankommt. In diesem Leitfaden teile ich die Tools, denen ich vertraue, und erkläre, warum sie eine Überlegung wert sind.
Warum Sie unseren Software-Bewertungen vertrauen können
Wir testen und bewerten seit 2023 Software. Als Technologie-Führungskräfte wissen wir, wie kritisch und herausfordernd es ist, die richtige Entscheidung bei der Softwareauswahl zu treffen.
Wir investieren viel in gründliche Recherche, um unserer Zielgruppe zu helfen, bessere Kaufentscheidungen zu treffen. Wir haben über 2.000 Tools für verschiedene Technikanwendungsfälle getestet und mehr als 1.000 umfassende Softwarebewertungen geschrieben. Erfahren Sie wie wir transparent bleiben und unsere Methodik der Softwarebewertung.
Beste Profiling-Tools Zusammenfassung
| Tool | Best For | Trial Info | Price | ||
|---|---|---|---|---|---|
| 1 | Am besten für detaillierte Performance-Einblicke | Kostenloser Tarif + kostenlose Demo verfügbar | Ab $26/Monat (jährlich abgerechnet) | Website | |
| 2 | Am besten geeignet für Performance-Monitoring von Anwendungen | 14-tägige kostenlose Testversion + kostenloser Tarif verfügbar | Ab $15/Nutzer/Monat (jährlich abgerechnet). | Website | |
| 3 | Am besten geeignet für Kundendatenmanagement und Integration | Kostenlose Demo verfügbar | Ab $120/Nutzer/Monat (jährliche Abrechnung). | Website | |
| 4 | Am besten für Speicher- und CPU-Profiling in Python | Not available | Preis auf Anfrage. | Website | |
| 5 | Am besten geeignet für die Visualisierung von Call Stacks in Python | Not available | Preis auf Anfrage. | Website | |
| 6 | Am besten geeignet für Sampling-Profiling von Python-Anwendungen | Not available | Da py-spy ein Open-Source-Tool ist, sind die Kernfunktionen kostenlos. | Website | |
| 7 | Am besten für Leistungsüberwachung mit Fehlerverfolgung geeignet | Not available | Ab $26/Benutzer/Monat (jährliche Abrechnung). | Website | |
| 8 | Am besten geeignet für Debugging und Entwicklung mit PHP | Not available | Preise auf Anfrage. | Website | |
| 9 | Am besten für industrielles Produkt-Profiling | Not available | Preise auf Anfrage. | Website | |
| 10 | Am besten geeignet für Live-Code-Tracing auf Entwicklungsarbeitsplätzen | Not available | Preis auf Anfrage. | Website |
-

TestDevLab
Visit Website -
Site24x7
Visit WebsiteThis is an aggregated rating for this tool including ratings from Crozdesk users and ratings from other sites.4.7 -
GitHub Actions
Visit WebsiteThis is an aggregated rating for this tool including ratings from Crozdesk users and ratings from other sites.4.8


Beste Profiling-Tools Bewertungen
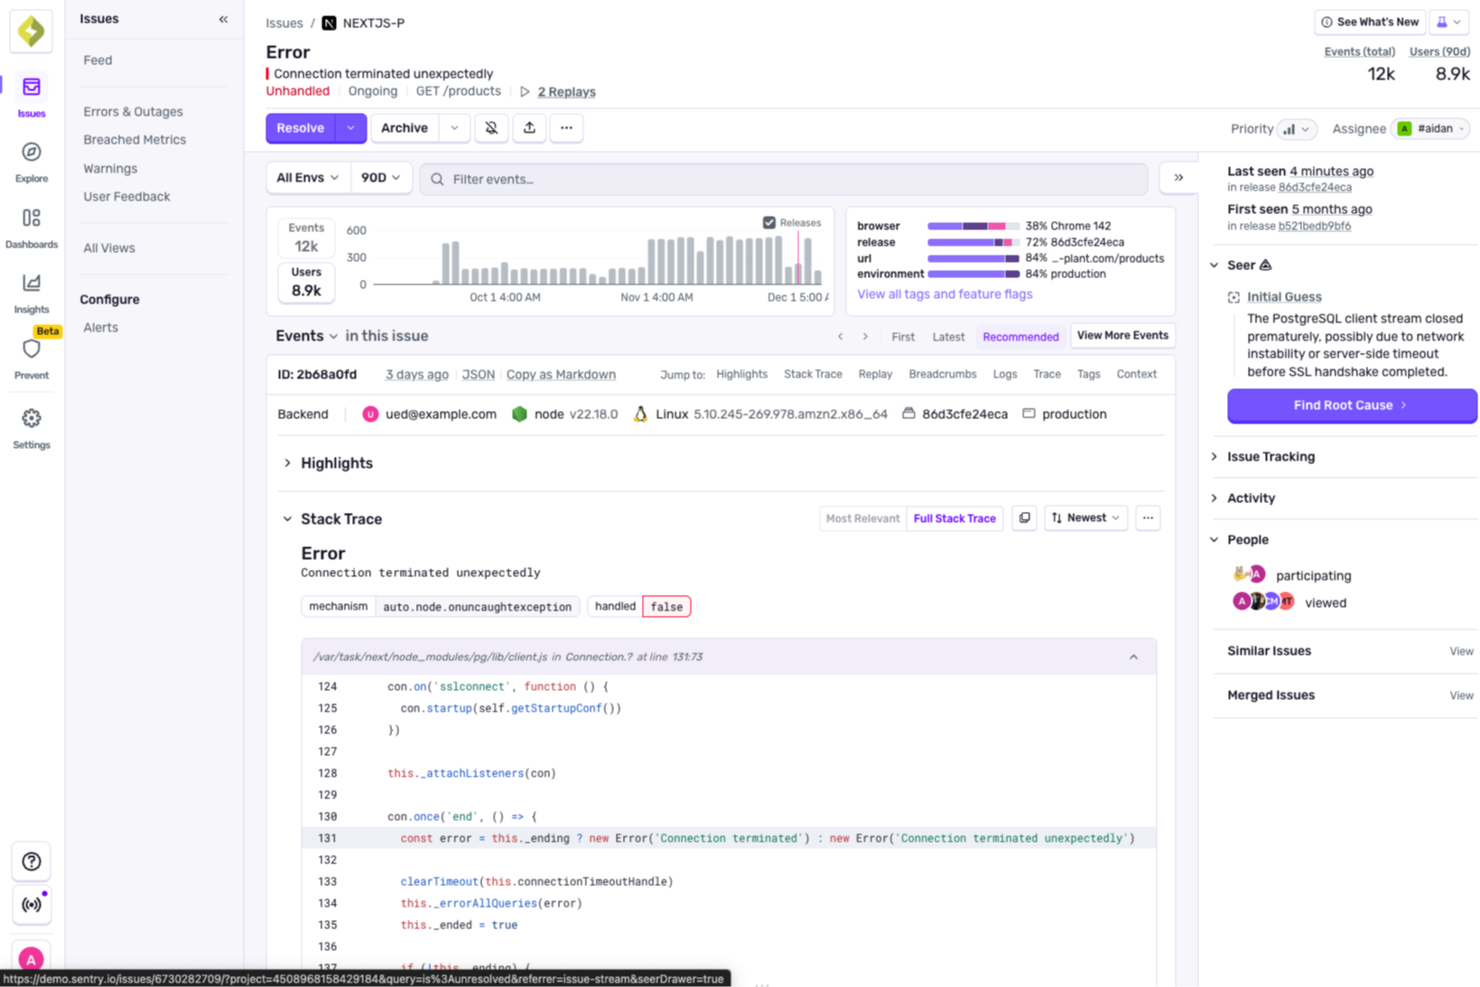
Für Entwickler, die eine zuverlässige Lösung zur Verbesserung der Anwendungsleistung suchen, bietet Sentry einen integrierten Ansatz für Fehlerüberwachung und Performance-Profiling. Es richtet sich an Web- und Mobile-Entwickler und stellt Tools bereit, um Performance-Engpässe aufzudecken und den Debugging-Prozess zu vereinfachen. Durch die gezielte Behandlung von Herausforderungen wie Fehlerverfolgung und Performance-Einblicken sorgt Sentry für ein reibungsloseres Entwicklungserlebnis.
Warum ich Sentry gewählt habe
Ich habe Sentry wegen seiner einzigartigen Fähigkeit gewählt, dank des Profiling-Features detaillierte Performance-Einblicke zu liefern. Durch das Erfassen von Funktionsaufrufen und Ausführungszeiten ermöglicht Sentry die Identifizierung und Behebung von Leistungsproblemen, ohne dass eine eigene Instrumentierung notwendig ist. Die nahtlose Integration des Tools mit GitHub und Slack unterstützt zudem den Entwicklungs-Workflow, indem sie Kontext für Korrekturen liefert und eine reibungslosere Zusammenarbeit ermöglicht. Dadurch ist Sentry die ideale Wahl für Teams, die die Anwendungsleistung optimieren und die Debugging-Zeit reduzieren möchten.
Sentry Hauptfunktionen
Neben seinen Profiling-Fähigkeiten bietet Sentry mehrere Funktionen, die seinen Nutzen als Profiling-Tool erweitern:
- Fehlerüberwachung: Erfasst Fehler in Ihrer Anwendung automatisch und stellt detaillierte Berichte bereit, um Probleme effizient zu beheben.
- Sitzungswiedergabe: Ermöglicht die Ansicht von Nutzersitzungen, um den Kontext von Fehlern zu verstehen und das Nutzererlebnis zu verbessern.
- KI-Debugger (Seer): Analysiert Protokolle und Abläufe, um die Ursachen von Fehlern zu identifizieren und bietet KI-gestützte Vorschläge für Korrekturen.
- Tracing: Liefert Einblicke in langsame Anfragen und Performance-Engpässe, um die Geschwindigkeit Ihrer Anwendung zu optimieren.
Sentry-Integrationen
Integrationen umfassen GitHub, Slack, Jira, GitLab, Bitbucket, Trello, Azure DevOps, Vercel und AWS Lambda.
Pros and Cons
Pros:
- KI markiert Probleme in Pull Requests
- Automatisierte Generierung von Unit-Tests
- Echtzeit-Fehlerüberwachung in der Produktion
Cons:
- Ersteinrichtung kann komplex sein
- KI-Vorschläge sollten überprüft werden
New Product Updates from Sentry

Sentry Adds Heatmaps to Application Metrics
Sentry introduced heatmaps for Application Metrics to visualize metric value distributions over time, helping teams spot patterns like latency bursts and use heatmaps in Custom Dashboards. For more information, visit Sentry's official site.
 .
.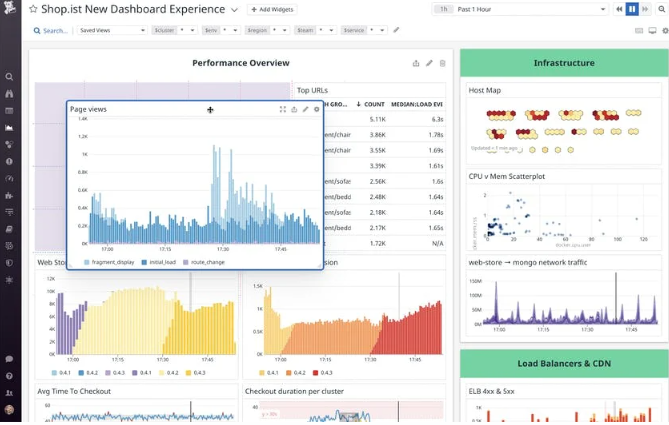
Datadog ist eine leistungsstarke Monitoring-Plattform im Cloud-Maßstab, die Daten aus Anwendungen, Infrastruktur und Logs zentralisiert. Speziell für moderne Cloud-Umgebungen entwickelt, bietet sie detaillierte Einblicke in die Anwendungsleistung und sorgt so für optimale Betriebszeiten und eine schnelle Fehlererkennung.
Warum ich Datadog gewählt habe: Die Entscheidung für Datadog wurde durch den ganzheitlichen Ansatz im Performance-Monitoring beeinflusst. Im Vergleich zu anderen Tools zeigte Datadog stets die Fähigkeit, tiefe Einblicke zu liefern, ohne dabei die Benutzerfreundlichkeit zu beeinträchtigen. Ich finde, dass für Unternehmen mit Fokus auf Anwendungs-Performance-Monitoring Datadog eindeutig zu den Spitzenreitern zählt.
Hervorstechende Funktionen & Integrationen:
Datadog überzeugt mit Funktionen wie Echtzeit-Dashboards, Anomalie- und Ausreißer-Erkennung sowie End-to-End-Request-Tracing. Leistungsstarke Visualisierungstools verbessern die Überwachungsmöglichkeiten. Was Integrationen angeht, ist Datadog mit zahlreichen Plattformen kompatibel, einschließlich AWS, Docker, Slack und vielen mehr, was ein umfassendes Monitoring-Erlebnis ermöglicht.
Pros and Cons
Pros:
- Umfassendes Monitoring für Anwendungen, Infrastruktur und Logs
- Große Auswahl an Integrationen mit beliebten Plattformen
- Effiziente Anomalie-Erkennung und Alarmsysteme
Cons:
- Für Neueinsteiger kann es eine Lernkurve geben
- Einige erweiterte Funktionen sind mit Zusatzkosten verbunden
- Die Ersteinrichtung kann bei komplexen Infrastrukturen zeitaufwändig sein.
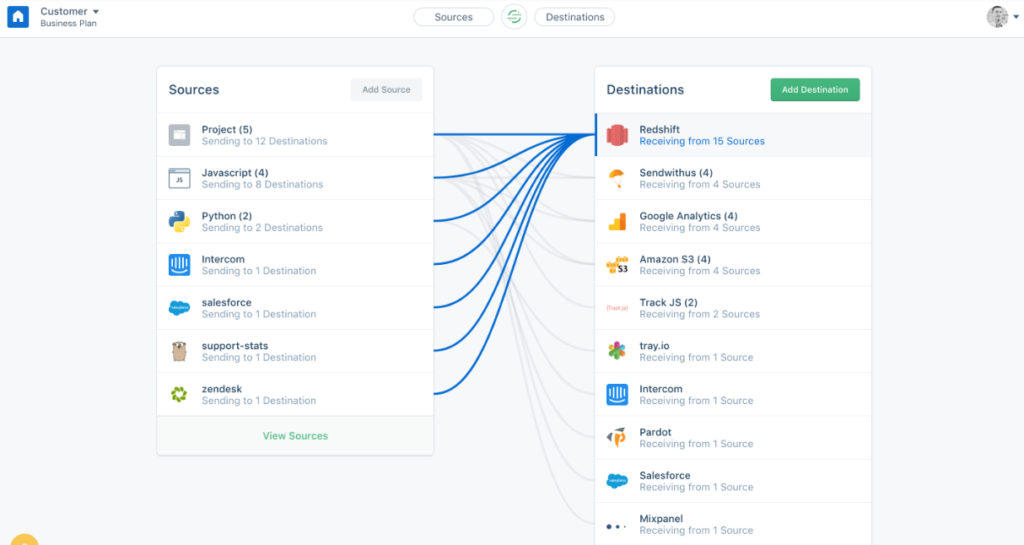
Segment bietet eine Plattform, die Kundendaten aus verschiedenen Kontaktpunkten konsolidiert, verwaltet und integriert. Entwickelt, um Datenquellen zu vereinheitlichen, ist es eine hervorragende Lösung für Unternehmen, die einen effizienten Ansatz für das Kundendatenmanagement und die Integration suchen.
Warum ich Segment gewählt habe: Ich habe Segment nach einem ausführlichen Vergleich mit ähnlichen Plattformen in diese Liste aufgenommen. Ausschlaggebend war die starke Architektur, die sich nicht nur auf das Sammeln von Daten konzentriert, sondern auch auf deren Validierung und Genauigkeit. Für Unternehmen, die eine umfassende Lösung für das Kundendatenmanagement mit nahtloser Integration suchen, ist Segment besonders hervorzuheben.
Hervorstechende Funktionen & Integrationen:
Zu den Hauptfunktionen von Segment zählen die Echtzeit-Erfassung von Daten aus verschiedenen Kanälen sowie Validierungstools, die die Integrität der erfassten Daten gewährleisten. Darüber hinaus sind die Datenpipelines darauf ausgelegt, Daten effizient zu konsolidieren und weiterzuleiten. Auf Integrationsebene arbeitet Segment mit vielen Plattformen zusammen, darunter – aber nicht beschränkt auf – Analysetools, Marketing-Automatisierungssoftware und CRM-Systeme.
Pros and Cons
Pros:
- Effiziente Datenerfassung über mehrere Kontaktpunkte
- Validierungstools sichern die Datenintegrität
- Breites Spektrum an Integrationen mit wichtigen Business-Tools
Cons:
- Könnte für kleinere Unternehmen oder Start-ups zu umfangreich sein
- Für die volle Nutzung ist ein gewisser Kenntnisstand erforderlich
- Das Preismodell könnte für kostenbewusste Unternehmen hoch ausfallen.
Scalene ist ein Top-Tool für Python-Entwickler zur Analyse der CPU- und Speicherauslastung.
Warum ich Scalene ausgewählt habe: Scalene fiel mir auf, als ich nach einem effizienten Profiler-Tool speziell für Python suchte. Im Vergleich zu anderen Mitbewerbern überzeugte Scalene durch seine hohe Präzision beim Aufdecken von Speicher- und CPU-Nutzung. Meiner Einschätzung nach ist es am besten für das Speicher- und CPU-Profiling in Python geeignet, da es beide Kennzahlen einzigartig kombiniert. Dadurch erhalten Entwickler ein ganzheitliches Bild über die Leistung ihrer Anwendung.
Herausragende Funktionen & Integrationen:
Scalene liefert besonders präzise Leistungsmetriken ohne hohe Belastung. Die Besonderheit besteht in der Fähigkeit, den Speicherverbrauch auf Codezeilenebene zu profilieren – etwas, das bei anderen Tools selten zu finden ist. Scalene bietet Kompatibilität mit Java-Anwendungen für Integrationen und ist dadurch vielseitig einsetzbar, insbesondere für Projekte, die sowohl Python als auch Java nutzen.
Pros and Cons
Pros:
- Präzises Speicherprofiling auf Codezeilenebene
- Kompatibel mit Java-Anwendungen
- Erfasst sowohl Speicher- als auch CPU-Kennzahlen effizient
Cons:
- Könnte für Einsteiger eine steilere Lernkurve haben
- Eingeschränkte Unterstützung für SQL- und API-Profiling im Vergleich zu spezialisierten Tools
- Manche fortgeschrittene Funktionen können für Gelegenheitnutzer überwältigend sein
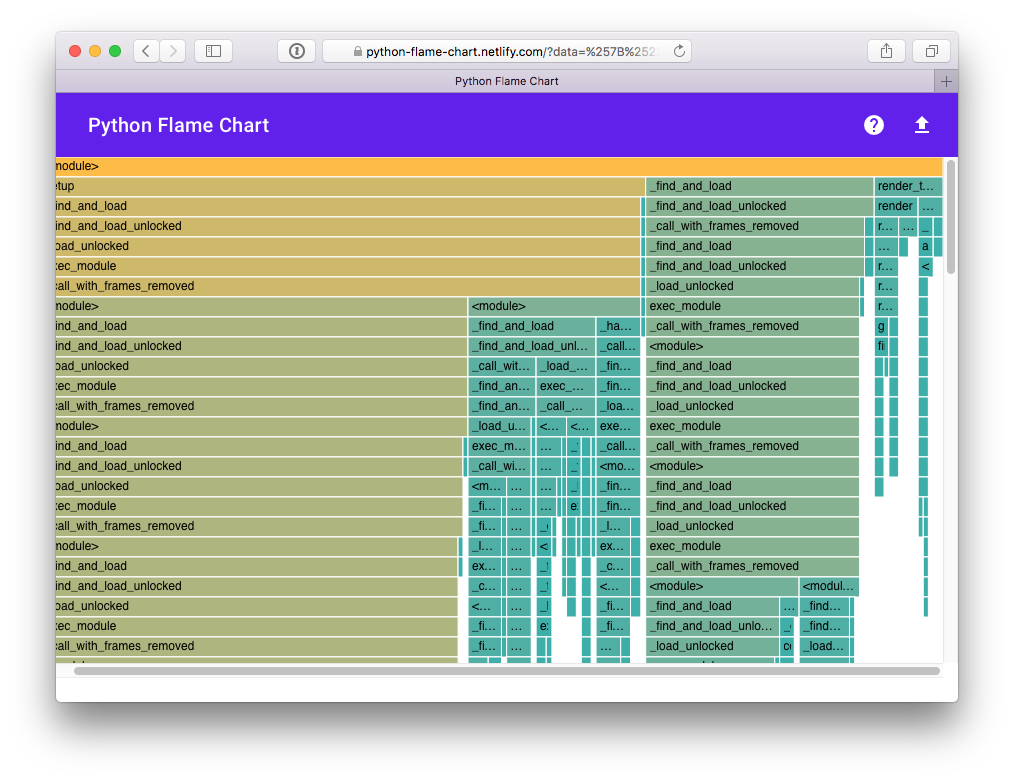
Pyinstrument ist ein Python-Profiling-Tool, das Entwicklern eine klare und detaillierte Visualisierung des Aufrufstapels ihres Programms bietet. Mit der Fähigkeit, komplexe Aufrufhierarchien optisch darzustellen, zeigt sich klar, dass es sich hervorragend zur Visualisierung von Call Stacks in Python eignet.
Warum ich Pyinstrument gewählt habe: Ich habe Pyinstrument nach einem gründlichen Vergleich mit anderen Tools dieser Kategorie ausgewählt. Besonders beeindruckt hat mich die einzigartige Möglichkeit, komplexe Aufrufhierarchien visuell darzustellen. Ich halte es für überlegen, wenn es darum geht, Python-Aufrufstapel abzubilden, was meine Überzeugung bestärkt, dass es das beste Tool zur Visualisierung von Call-Strukturen in Python ist.
Hervorstechende Funktionen & Integrationen:
Pyinstrument bietet eine umfangreiche Benutzeroberfläche zur Visualisierung von Call Stacks und unterstützt so Business-Intelligence-Prozesse. Die Dashboards liefern Entwicklern umfassende Übersichten über das Verhalten ihres Codes. Neben den Kernfunktionen integriert sich Pyinstrument gut mit Tools zur Datenbereinigung und Datenabgleich, was die Vielseitigkeit für datengetriebene Projekte erhöht.
Pros and Cons
Pros:
- Detaillierte Call-Stack-Visualisierung unterstützt Business-Intelligence-Prozesse
- Umfassende Dashboards bieten einen Gesamtüberblick über die Code-Performance
- Effektive Integrationen mit Datenbereinigungs- und Datenabgleichstools
Cons:
- Eventuell nicht geeignet für Echtzeit-Profiling
- Erfordert manuelle Konfiguration für bestimmte erweiterte Funktionen
- Begrenzte Unterstützung für Nicht-Python-Sprachen
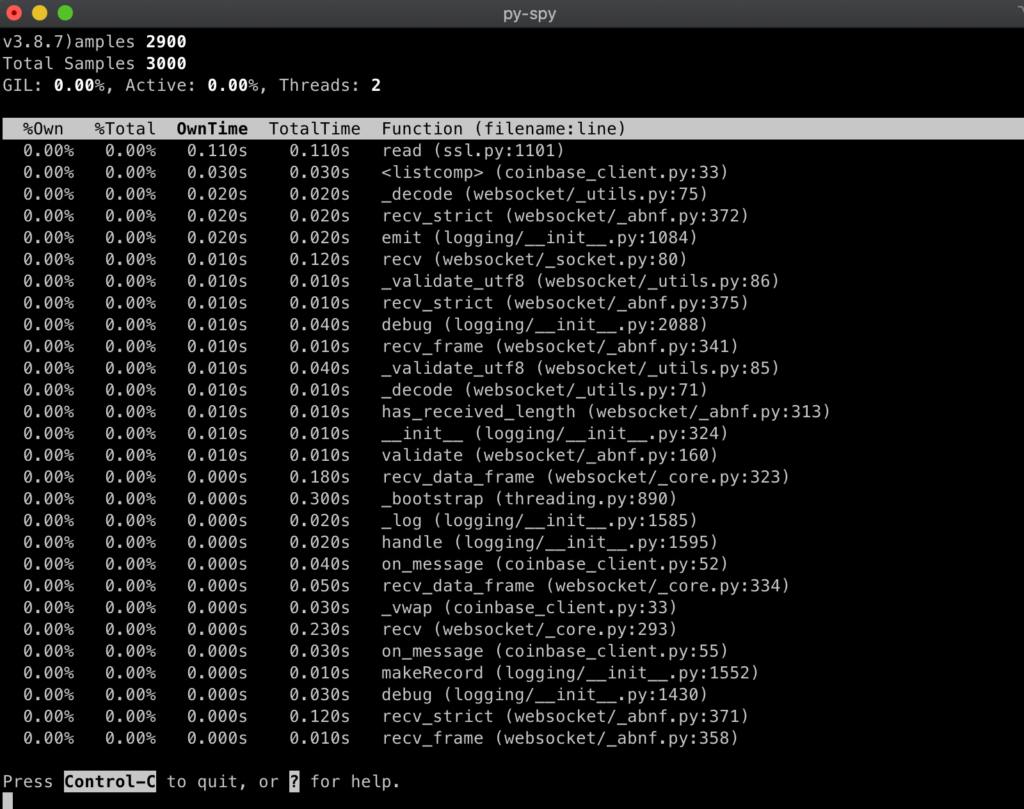
py-spy ist ein Tool, das entwickelt wurde, um Python-Anwendungen durch Abtasten ihrer Ausführung zu profilieren. Es zeichnet sich als wertvolles Werkzeug für Entwickler aus, die eine detaillierte Speicherprofilierung anstreben, ohne den normalen Betrieb ihrer Python-Apps zu stören.
Warum ich py-spy ausgewählt habe: Bei der Auswahl der optimalen Werkzeuge für das Python-Profiling war py-spy für mich eine natürliche Wahl. Besonders überzeugte mich der nicht-intrusive Ansatz zur Speicherprofilierung sowie die Fähigkeit, effizient Metadaten zu extrahieren. Im Vergleich zu anderen Tools wurde schnell deutlich, dass py-spy durch seine Fähigkeiten hervorsticht und seine Position als bestes Werkzeug für ein Sampling-Profiling von Python-Anwendungen festigt.
Hervorstechende Funktionen & Integrationen:
Eine der zentralen Funktionen von py-spy ist die Möglichkeit, Speicherprofilierung ohne Änderungen am Code oder Neustarts der Anwendung durchzuführen. Das Tool ist außerdem in der Lage, umfangreiche Metadaten aus den Profilergebnissen zu erfassen, was die Qualität der gewonnenen Einblicke deutlich erhöht. Obwohl py-spy sich hauptsächlich auf Python konzentriert, sind auch die Open-Source-Datenintegrationen erwähnenswert, die Flexibilität und Transparenz bieten.
Pros and Cons
Pros:
- Ermöglicht eine nicht-intrusive Speicherprofilierung
- Erfasst effektiv und liefert aufschlussreiche Metadaten
- Durch die Nutzung von Open-Source-Daten wird Transparenz sichergestellt und Verbesserungen durch die Community ermöglicht
Cons:
- Einige fortgeschrittene Funktionen können für Anfänger eine steile Lernkurve bedeuten
- Da es speziell für Python entwickelt wurde, ist die Vielseitigkeit für mehrere Programmiersprachen begrenzt
- Es gibt kein eigenes Supportsystem, hauptsächlich Community-Unterstützung.
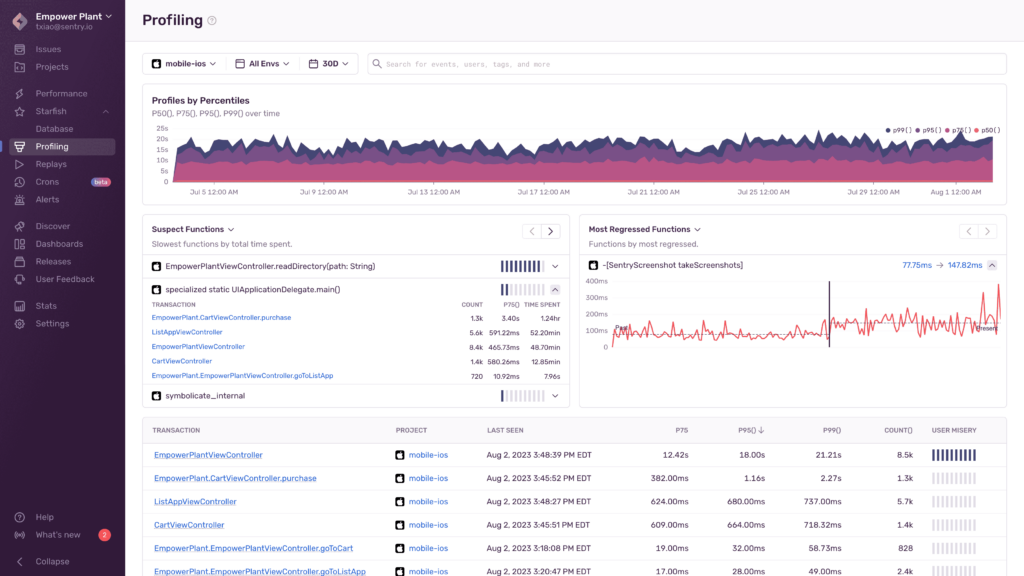
Sentry Profiling ist ein Tool, das entwickelt wurde, um Entwicklern die Überwachung der Anwendungsleistung zu ermöglichen und gleichzeitig Fehler zu verfolgen. Diese Kombination hilft Entwicklern, Engpässe im Quellcode zu identifizieren und so ein reibungsloses Benutzererlebnis sicherzustellen.
Warum ich Sentry Profiling gewählt habe: Unter den vielen Profiling-Tools hat Sentry Profiling meine Aufmerksamkeit erregt. Meine Entscheidung basierte auf der doppelten Fähigkeit, sowohl Leistungsüberwachung anzubieten als auch Fehler im Blick zu behalten. Nach dem Vergleich mit anderen Tools ist Sentry Profiling wirklich am besten geeignet für diejenigen, die Leistungsüberwachung mit Fehlerverfolgung kombinieren möchten.
Hervorstechende Funktionen & Integrationen:
Eine der wichtigsten Funktionen von Sentry Profiling ist die tiefgehende Analyse des Quellcodes, wodurch eine effiziente Fehlerbehebung möglich ist. Zudem stellt der integrierte Fehlerüberwachungsmechanismus sicher, dass Entwickler Anomalien erkennen, bevor diese das Benutzererlebnis beeinflussen. Bei den Integrationen verbindet sich Sentry mit vielen Plattformen, darunter GitHub, Slack und Jira, sodass Entwickler ein stimmiges Ökosystem haben.
Pros and Cons
Pros:
- Umfassende Einblicke in den Quellcode für effizientes Troubleshooting
- Duale Funktionen: Leistungsüberwachung und Fehlerverfolgung
- Große Auswahl an Integrationen, die den Nutzen des Tools steigern
Cons:
- Kann für kleine Projekte oder Anfänger zu komplex sein
- Jährliche Abrechnung ist möglicherweise nicht für alle Nutzer bevorzugt
- Einige Nutzer berichten von einer steileren Lernkurve im Vergleich zu anderen Profiling-Tools.
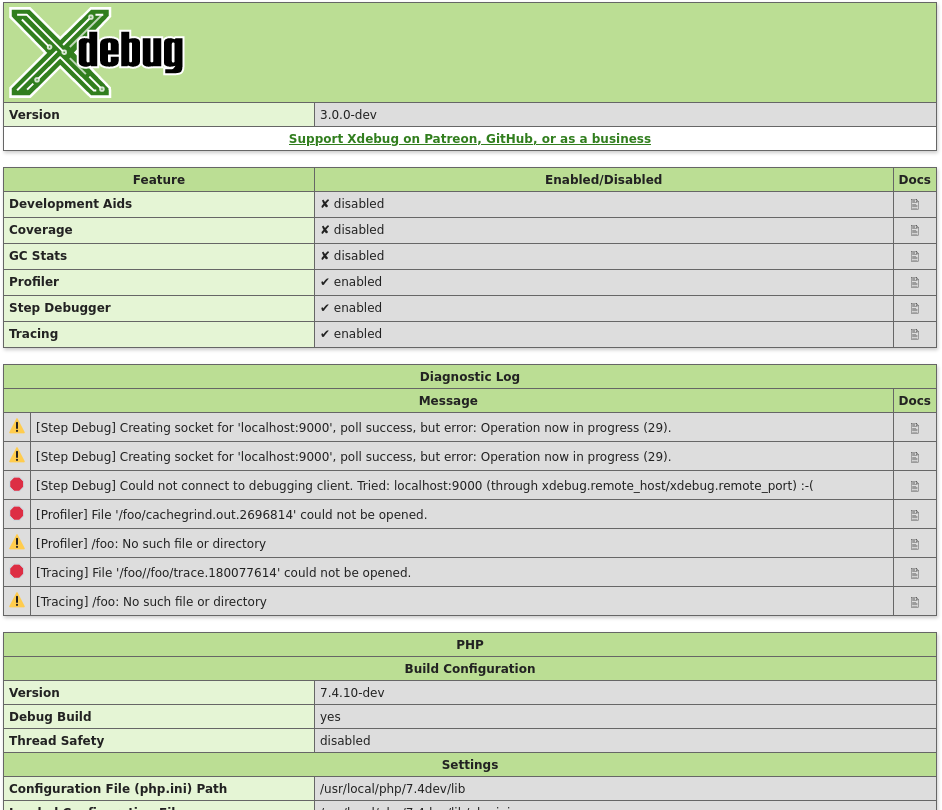
Xdebug, speziell für PHP entwickelt, ist ein unverzichtbares Tool mit detaillierten Debugging-Funktionen. Die Lösung spezifischer Herausforderungen während der PHP-Entwicklung festigt seine Position als erste Wahl für alle, die eine PHP-spezifische Debugging- und Entwicklungsumgebung benötigen.
Warum ich Xdebug ausgewählt habe: Bei der Auswahl von Tools für das PHP-Debugging stach Xdebug in meinen Bewertungen immer als Spitzenreiter hervor. Seine Präzision bei der Identifizierung von Performance-Problemen und die unerreichte Tiefe im PHP-Laufzeitumfeld heben es deutlich ab. Ich erkannte diese Eigenschaften und entschied mich mit Überzeugung für Xdebug als die beste Lösung für PHP-Debugging und -Entwicklung.
Hervorstechende Funktionen & Integrationen:
Xdebug überzeugt durch die Fähigkeit, Performance-Probleme schnell aufzudecken und Entwicklern die Möglichkeit zu geben, diese effektiv zu beheben. Die Funktionen bieten Einblicke in die Laufzeit-Allocation, wodurch Ressourcen effizient genutzt werden. Darüber hinaus sorgt die Kompatibilität mit zahlreichen Plugins für ein reibungsloseres und stärker integriertes Entwicklungserlebnis.
Pros and Cons
Pros:
- Erkennt Performance-Probleme in PHP-Anwendungen meisterhaft
- Detaillierte Einblicke in die Laufzeit-Allocation
- Integration mit mehreren Plugins
Cons:
- Für Anfänger steilere Lernkurve
- Kann bei Ausführung auf Produktionsservern einen Overhead verursachen
- Die Konfiguration kann bei komplexen Anwendungen aufwendig sein
SPX, ein innovatives Daten-Profiling-Tool, wurde in erster Linie entwickelt, um den spezifischen Anforderungen des industriellen Produkt-Profilings gerecht zu werden. Angesichts der Komplexität dieses Bereichs ist SPX einzigartig positioniert, um aufschlussreiche Profiling-Funktionen zu bieten, was das Prädikat 'Beste Lösung für' industrielle Produkte verstärkt.
Warum ich SPX gewählt habe: Während meines sorgfältigen Auswahlprozesses stach SPX als echter Lichtblick hervor. Im Vergleich zu anderen Tools überzeugte SPX mit seinem maßgeschneiderten Ansatz für Industrieprodukte. Das klare Bekenntnis zur Datenqualität und die umfassenden Profiling-Funktionen führten dazu, dass für mich SPX im Bereich des industriellen Profilings unübertroffen ist.
Herausragende Funktionen & Integrationen:
SPX bietet leistungsstarke Funktionen zur Sicherstellung von Datenqualität, die zuverlässiges und verwertbares Profiling ermöglichen. Die Unterstützung einer IDE (Integrierte Entwicklungsumgebung) macht das Tool vielseitig und benutzerfreundlich. Darüber hinaus existieren Integrationen mit verschiedenen .NET-Plattformen, was seinen Einsatzbereich erweitert und die Kompatibilität mit diversen Unternehmensanwendungen sicherstellt.
Pros and Cons
Pros:
- Konzentration auf industrielles Produkt-Profiling
- Starker Fokus auf Datenqualität
- Lässt sich sehr gut in .NET-Plattformen integrieren
Cons:
- Eventuell nicht geeignet für Profiling außerhalb des Industriebereichs
- Benötigt spezielle Fachkenntnisse, um das volle Potenzial auszuschöpfen
- Kann aufgrund des branchenspezifischen Fokus als Nischenlösung wahrgenommen werden
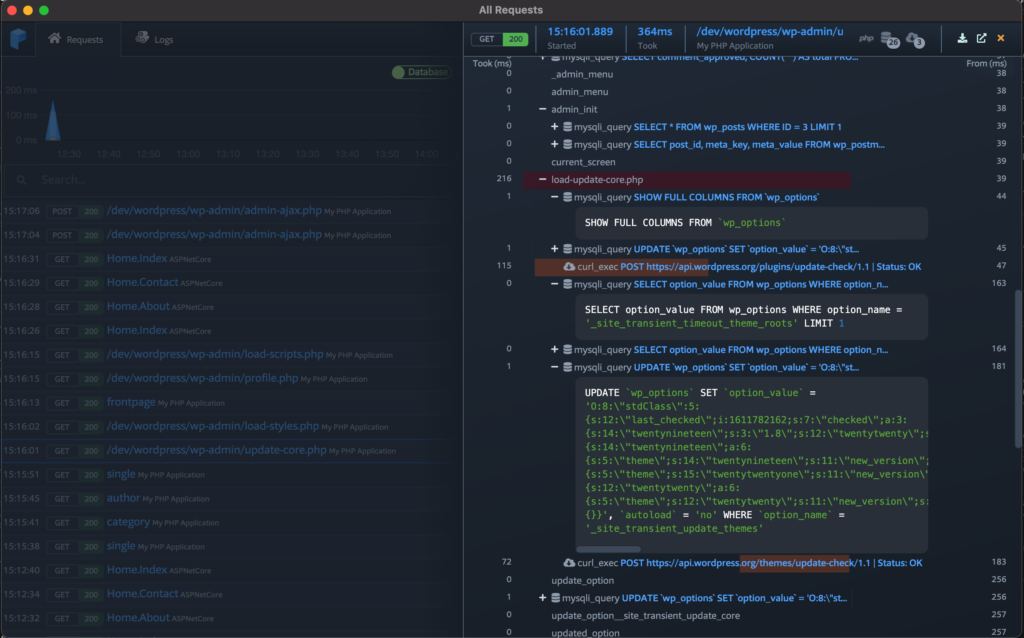
Prefix bietet Entwicklern einen klaren Einblick in das Verhalten ihres Codes in Echtzeit. Speziell für Entwicklungsarbeitsplätze konzipiert, ermöglicht es Live-Code-Tracing in Echtzeit und ist somit ein unschätzbares Werkzeug für alle, die eine unmittelbare Sicht auf die Performance ihres Codes wünschen – genau wie in der Beschreibung unter 'Am besten geeignet für' angegeben.
Warum ich Prefix gewählt habe: Prefix hat sich aus der Vielzahl von Tools, die ich geprüft habe, hervorgetan. Der einzigartige Fokus auf Live-Code-Tracing, speziell zugeschnitten auf Entwicklungsumgebungen, hat meine Aufmerksamkeit geweckt. Entwickler können damit ihren Code live auf den eigenen Arbeitsplätzen nachverfolgen – daher halte ich es für das beste Tool für diesen bestimmten Anwendungsfall.
Herausragende Funktionen & Integrationen:
Die große Stärke von Prefix ist das Live-Code-Profiling, das unmittelbares Feedback zum Codeverhalten liefert. Seine Big-Data-Fähigkeiten helfen Entwicklern außerdem, große Datensätze in Echtzeit zu analysieren. Im Hinblick auf Integrationen fügt sich Prefix in viele Automatisierungs-Workflows ein und erfüllt so die Anforderungen moderner Entwicklungszyklen.
Pros and Cons
Pros:
- Live-Code-Tracing direkt auf Entwicklungsarbeitsplätzen
- Starke Big-Data-Analysefähigkeiten
- Effiziente Integration mit verschiedenen Automatisierungsplattformen
Cons:
- Weniger geeignet für die Überwachung von Produktionsumgebungen
- Für die volle Nutzung ist eine gewisse Erfahrung mit Code-Profiling erforderlich
- Nicht so umfangreich in den Funktionen wie manche dedizierte Profiling-Tools
Weitere bemerkenswerte Profiling-Tools
Unten finden Sie eine Liste weiterer Profiling-Tools, die ich in die engere Auswahl genommen, aber nicht in die Top 10 aufgenommen habe. Es lohnt sich auf jeden Fall, sie anzuschauen.
- Pyroscope
Am besten für kontinuierliche Profilierung in Echtzeit
- Bubbleprof
Am besten geeignet zur Visualisierung von Node.js-Async-Operationen
- Orbit Profiler
Am besten für Spieleentwicklung und Grafik-Anwendungen geeignet


Verwandte Reviews
Auswahlkriterien für Profiling-Tools
Bei der Auswahl der besten Profiling-Tools für diese Liste habe ich typische Käuferbedürfnisse und Probleme wie die Identifizierung von Performance-Engpässen und die Integration in bestehende Entwicklungsumgebungen berücksichtigt. Außerdem habe ich das folgende Rahmenwerk genutzt, um meine Bewertung strukturiert und fair zu halten:
Kernfunktionen (25% der Gesamtbewertung)
Um in diese Liste aufgenommen zu werden, musste jede Lösung diese gängigen Anwendungsfälle abdecken:
- Analyse der CPU-Auslastung
- Überwachung der Speicherverwendung
- Erkennung von Performance-Engpässen
- Profiling von Multithread-Anwendungen
- Erstellung ausführlicher Berichte
Zusätzliche herausragende Funktionen (25% der Gesamtbewertung)
Um die Auswahl weiter einzugrenzen, habe ich auch nach einzigartigen Funktionen gesucht wie:
- Echtzeit-Datenanalyse
- Integration in CI/CD-Pipelines
- Unterstützung verteilter Systeme
- Individuell anpassbare Dashboards
- Erweiterte Visualisierungstools
Benutzerfreundlichkeit (10% der Gesamtbewertung)
Um die Benutzerfreundlichkeit der einzelnen Systeme einzuschätzen, habe ich Folgendes berücksichtigt:
- Intuitive Benutzeroberfläche
- Einfache Navigation
- Minimale Lernkurve
- Anpassbare Einstellungen
- Responsives Design
Onboarding (10% der Gesamtbewertung)
Um das Onboarding-Erlebnis jeder Plattform zu bewerten, habe ich Folgendes betrachtet:
- Verfügbarkeit von Trainingsvideos
- Interaktive Produkttouren
- Zugriff auf Vorlagen
- Chatbot-Unterstützung
- Live-Webinare
Kundensupport (10 % der Gesamtbewertung)
Um die Kundensupport-Dienste jedes Softwareanbieters zu bewerten, habe ich Folgendes berücksichtigt:
- 24/7 Verfügbarkeit
- Mehrere Supportkanäle
- Reaktionszeit
- Kompetentes Personal
- Verfügbarkeit von FAQs
Preis-Leistungs-Verhältnis (10 % der Gesamtbewertung)
Um das Preis-Leistungs-Verhältnis jeder Plattform zu bewerten, habe ich Folgendes berücksichtigt:
- Wettbewerbsfähige Preise
- Abgestufte Abonnementoptionen
- Verfügbarkeit einer kostenlosen Testversion
- Preis im Vergleich zu angebotenen Funktionen
- Rabatte für Jahrespläne
Kundenbewertungen (10 % der Gesamtbewertung)
Um ein Gefühl für die allgemeine Kundenzufriedenheit zu bekommen, habe ich beim Lesen von Kundenrezensionen Folgendes berücksichtigt:
- Gesamtzufriedenheitsbewertung
- Häufig genannte Vor- und Nachteile
- Häufigkeit der Updates
- Von Nutzern gemeldete Probleme
- Erfahrungsberichte aus ähnlichen Branchen
So wählen Sie Profiling-Tools aus
Es ist leicht, sich in langen Funktionslisten und komplexen Preisstrukturen zu verlieren. Damit Sie bei Ihrer individuellen Softwareauswahl fokussiert bleiben, finden Sie hier eine Checkliste mit Faktoren, die Sie im Hinterkopf behalten sollten:
| Faktor | Worauf zu achten ist |
|---|---|
| Skalierbarkeit | Kann das Tool mit Ihrem Team wachsen? Prüfen Sie, ob es erhöhte Datenmengen und Nutzerzahlen ohne Leistungseinbußen bewältigt. Stellen Sie sicher, dass es sowohl aktuelle als auch künftige Anforderungen abdeckt. |
| Integrationen | Lässt es sich einfach mit Ihren bestehenden Systemen verbinden? Prüfen Sie die Kompatibilität mit Entwicklungsumgebungen und anderen Tools, die Ihr Team täglich verwendet. Vermeiden Sie Lösungen, die komplizierte Workarounds zur Integration erfordern. |
| Anpassbarkeit | Können Sie das Tool an Ihren Workflow anpassen? Suchen Sie nach Möglichkeiten, Dashboards, Berichte und Benachrichtigungen zu individualisieren. Es sollte sich an die Prozesse Ihres Teams anpassen lassen, ohne umfangreiche Konfigurationen zu erfordern. |
| Benutzerfreundlichkeit | Ist das Tool für alle Teammitglieder intuitiv bedienbar? Eine steile Lernkurve kann die Produktivität beeinträchtigen. Achten Sie auf einfache Navigation und klare Anweisungen. Testen Sie die Oberfläche, um zu prüfen, ob sie für neue Nutzer verständlich ist. |
| Implementierung und Onboarding | Wie schnell kann Ihr Team es nutzen? Berücksichtigen Sie verfügbare Schulungsressourcen und Unterstützung beim Aufbau. Ein reibungsloser Onboarding-Prozess kann für Akzeptanz und Effektivität entscheidend sein. |
| Kosten | Passen die Preise in Ihr Budget? Bewerten Sie die Gesamtkosten, einschließlich versteckter Gebühren für Zusatzfunktionen oder Support. Vergleichen Sie Abonnementmodelle und prüfen Sie die langfristige Bezahlbarkeit. |
| Sicherheitsvorkehrungen | Sind Ihre Daten und Abläufe geschützt? Überprüfen Sie die Einhaltung von Datenschutzstandards und achten Sie auf Funktionen wie Verschlüsselung und Zugriffskontrollen. Sparen Sie nicht an der Sicherheit. |
| Support-Verfügbarkeit | Gibt es Unterstützung, wenn Sie sie brauchen? Prüfen Sie Supportzeiten und -kanäle des Anbieters. Schnelle Reaktionszeiten und kompetente Hilfe wirken sich positiv auf die Nutzung des Tools aus. |
Was ist ein Profiling-Tool?
Profiling-Tools sind Softwarelösungen, die Ihnen helfen zu messen, wie Ihr Code arbeitet, damit Sie langsame Funktionen, Speicherprobleme oder ineffizienten Ressourceneinsatz erkennen. Sie werden hauptsächlich von Entwicklern und Ingenieuren eingesetzt, die verstehen müssen, wie sich ihre Anwendungen zur Laufzeit verhalten und wo sich Leistungsprobleme verstecken könnten.
Funktionsaufrufdiagramme, Überwachung des Speicherverbrauchs und CPU-Proben nehmen helfen dabei, Engpässe zu lokalisieren, die Systemauslastung zu verstehen und Reaktionszeiten zu verbessern. Diese Tools machen die Optimierung von Anwendungen einfacher, da sie Fakten liefern, anstatt Vermutungen über Performance-Bremsen anzustellen.
Funktionen
Achten Sie bei der Auswahl von Profiling-Tools auf folgende Schlüsselfunktionen:
- Analyse der CPU-Auslastung: Hilft dabei, die Teile der Anwendung zu identifizieren, die am meisten Rechenleistung verbrauchen, und unterstützt so die Optimierung.
- Überwachung der Speicherzuweisung: Verfolgt den Speicherverbrauch, um Lecks und Ineffizienzen zu erkennen und sorgt für eine reibungslosere Performance.
- Erkennung von Performance-Engpässen: Spürt langsame Bereiche im Code auf, sodass gezielte Verbesserungen möglich werden.
- Integrationsmöglichkeiten: Verbindet sich nahtlos mit bestehenden Entwicklungsumgebungen und verbessert damit den Arbeitsablauf.
- Anpassbare Dashboards: Ermöglichen es den Nutzern, Ansichten und Berichte individuell nach ihren Bedürfnissen zu gestalten und verbessern so die Benutzerfreundlichkeit.
- Echtzeit-Datenanalyse: Bietet sofortige Einblicke in die Anwendungsperformance und erleichtert schnelle Entscheidungen.
- Fortschrittliche Visualisierungswerkzeuge: Bieten grafische Darstellungen von Daten, sodass komplexe Informationen leichter verständlich werden.
- Schutzmaßnahmen zur Sicherheit: Stellt den Datenschutz durch Verschlüsselung und Zugriffskontrollen sicher und erhält das Vertrauen der Nutzer.
- Interaktive Produkttouren: Leiten neue Nutzer durch die Funktionen und verbessern das Onboarding-Erlebnis.
- Rund-um-die-Uhr-Support: Bietet jederzeit Unterstützung zur schnellen Problemlösung und steigert die Nutzerzufriedenheit.
Vorteile
Der Einsatz von Profiling-Tools bringt Ihrem Team und Ihrem Unternehmen zahlreiche Vorteile. Hier sind einige, auf die Sie sich freuen können:
- Verbesserte Performance: Durch das Erkennen von CPU- und Speichernutzungsproblemen helfen diese Tools, die Anwendungsgeschwindigkeit und Effizienz zu optimieren.
- Effizientere Fehlersuche: Die Erkennung von Performance-Engpässen ermöglicht es Entwicklern, problematische Codeabschnitte schnell zu finden und zu beheben.
- Besseres Ressourcenmanagement: Durch die Überwachung der Speicherzuweisung wird eine effiziente Nutzung der Systemressourcen sichergestellt und Verschwendung verhindert sowie die Stabilität verbessert.
- Steigerung der Produktivität: Echtzeit-Datenanalyse und anpassbare Dashboards straffen Arbeitsabläufe, sodass Teams sich auf wichtige Aufgaben konzentrieren können.
- Höhere Sicherheit: Funktionen wie Verschlüsselung und Zugriffskontrollen schützen vertrauliche Daten und sorgen für Compliance und Vertrauen.
- Vereinfachtes Onboarding: Interaktive Produkttouren und Lernressourcen erleichtern neuen Nutzern den schnellen Einstieg.
- Zuverlässiger Support: Mit einer 24/7-Verfügbarkeit sorgt der Kundendienst dafür, dass Probleme schnell gelöst und Ausfallzeiten minimiert werden.
Kosten & Preise
Die Auswahl von Profiling-Tools erfordert ein Verständnis der verschiedenen verfügbaren Preismodelle und -pläne. Die Kosten variieren je nach Funktionen, Teamgröße, Zusatzoptionen und mehr. Die folgende Tabelle fasst gängige Pläne, ihre Durchschnittspreise und typische Funktionsumfänge von Profiling-Tools-Lösungen zusammen:
Vergleichstabelle für Profiling-Tool-Pläne
| Plan-Typ | Durchschnittlicher Preis | Häufige Funktionen |
|---|---|---|
| Gratis-Tarif | $0 | Grundlegende CPU- und Speicherüberwachung, eingeschränkte Berichtsfunktionen und Community-Support. |
| Persönlicher Tarif | $10-$30/user/month | Erweiterte Performance-Analyse, anpassbare Dashboards und E-Mail-Support. |
| Business-Tarif | $50-$100/user/month | Echtzeit-Datenanalyse, Integrationsmöglichkeiten, erweiterte Sicherheitsfunktionen und Priority-Support. |
| Enterprise-Tarif | $150-$300/user/month | Umfassende Überwachung, dedizierter Account Manager, fortgeschrittene Sicherheitsoptionen und 24/7 Premium-Support. |
Häufig gestellte Fragen zu Profiling-Tools (FAQs)
Wie helfen Profiling-Tools bei der Leistungsoptimierung?
Profiling-Tools analysieren Ihren Code, um Leistungsengpässe zu erkennen. Dadurch können Sie gezielt optimieren und die Effizienz steigern. Sie liefern Einblicke in CPU-Auslastung, Speicherzuweisung und andere Kennzahlen, die Ihre Anwendung verlangsamen können. Mit diesen Tools können Sie gezielt Verbesserungen vornehmen.
Wie gehen Profiling-Tools mit großskaligen Anwendungen um?
Für den Unternehmenseinsatz entwickelte Profiling-Tools können große Anwendungen durch detaillierte Analysen und übergeordnete Einblicke bewältigen. Sie sind in der Lage, erhöhte Datenmengen und Nutzerzahlen zu verwalten, ohne an Performance einzubüßen. Achten Sie auf Funktionen wie Unterstützung verteilter Systeme, wenn Sie mit umfangreichen Anwendungen arbeiten.
Wie können Profiling-Tools meinen Entwicklungsprozess verbessern?
Profiling-Tools verbessern Ihren Entwicklungsprozess, indem sie Leistungsprobleme schnell identifizieren und lösen. Sie bieten Echtzeitdaten und anpassbare Berichte, sodass Sie fundierte Entscheidungen treffen können. Das Ergebnis: effizienterer Code und ein reibungsloserer Entwicklungszyklus.
Lohnt sich die Investition in ein Premium-Profiling-Tool?
Kostenlose Tools sind für kleinere Projekte oder grundlegende Profilierungsanforderungen oft ausreichend. Für größere und komplexere Anwendungen ist die Investition in ein Premium-Tool jedoch unerlässlich. Premium-Lösungen bieten in der Regel erweiterte Funktionen, besseren Support und mehr Skalierbarkeit – damit sind sie wertvoll, um die optimale Leistung Ihrer Anwendung sicherzustellen.
Können Profiling-Tools für jede Programmiersprache verwendet werden?
Die meisten Profiling-Tools unterstützen mehrere Programmiersprachen, jedoch nicht jede Sprache. Prüfen Sie deshalb vor der Auswahl die Kompatibilität des Tools mit den in Ihrer Anwendung eingesetzten Programmiersprachen.
Wie geht es weiter:
Wenn Sie sich gerade über Profiling-Tools informieren, nehmen Sie Kontakt zu einem SoftwareSelect-Berater auf und erhalten Sie kostenlose Empfehlungen.
Sie füllen ein Formular aus und führen ein kurzes Gespräch, in dem Ihre konkreten Anforderungen besprochen werden. Im Anschluss erhalten Sie eine Liste passender Softwarelösungen zur Auswahl – und werden während des gesamten Kaufprozesses bis hin zu Preisverhandlungen unterstützt.