10 Beste Nagios-Alternativen im Jahr 2026 bewertet

Beste Nagios-Alternativen Übersicht


Die besten Nagios-Alternativen helfen Teams dabei, Systeme zu überwachen, ohne sich mit komplexen Einrichtungsprozessen oder Skalierungsgrenzen auseinandersetzen zu müssen. Sie bieten übersichtlichere Dashboards, einfachere Konfigurationen und flexible Integrationen, die es erleichtern, die Performance von Servern, Netzwerken und Anwendungen zu verfolgen.
Viele Unternehmen beginnen mit der Suche nach Alternativen, nachdem sie Schwierigkeiten mit Nagios-Plugins hatten, die sich nicht problemlos integrieren lassen, viel Zeit mit der Fehlersuche von kryptischen Fehlermeldungen verbringen oder an Leistungsgrenzen stoßen, wenn der Überwachungsbedarf wächst. Diese Herausforderungen bremsen die Abläufe und erschweren es IT-Teams, die Übersicht im großen Maßstab zu behalten.
Ich habe Überwachungsplattformen in Live-Produktionsumgebungen getestet, mit Teams zusammengearbeitet, die von alten Nagios-Installationen migrieren, und ausgewertet, wie diese Tools in hybriden und Cloud-Infrastrukturen abschneiden. Diese Erfahrungen haben mir gezeigt, welche Lösungen den Überwachungsaufwand tatsächlich verringern – und welche neuen Komplexitäten erzeugen.
In diesem Leitfaden erfahren Sie, welche Nagios-Alternativen eine einfachere Einrichtung, bessere Skalierbarkeit und verwertbarere Einblicke bieten, damit Ihr Team sich auf das Beheben von Problemen konzentrieren kann – und nicht auf das Kämpfen mit dem Überwachungssystem.
Was ist Nagios?
Nagios ist eine Open-Source-Plattform für Monitoring und Netzwerkmanagement, die für Netzwerk- und Systemüberwachung konzipiert wurde. IT-Experten und Systemadministratoren nutzen Nagios in der Regel, um eine kritische Infrastruktur im Blick zu behalten und einen reibungslosen Betrieb sicherzustellen.
Seine Alarmierungs-, Berichts- und Überwachungsfunktionen helfen Ihnen, Probleme zu erkennen, die Performance zu analysieren und Netzwerkressourcen effektiv zu verwalten. Insgesamt bietet Nagios einen Mehrwert, indem es Ihrem Team hilft, die Systemzuverlässigkeit aufrechtzuerhalten und Ausfallzeiten zu minimieren.
Beste Nagios-Alternativen Zusammenfassung
Diese Vergleichstabelle fasst die Preisinformationen meiner Top-Auswahl an Nagios-Alternativen zusammen, damit Sie die beste Lösung für Ihr Budget und Ihre geschäftlichen Anforderungen finden.
| Tool | Best For | Trial Info | Price | ||
|---|---|---|---|---|---|
| 1 | Am besten für komplexe IT-Infrastrukturen | Kostenloser Plan verfügbar | Preise auf Anfrage | Website | |
| 2 | Am besten geeignet für Multi-Cloud-Überwachung | 30-tägige kostenlose Testversion + kostenlose Demo verfügbar | Ab $10/Monat (jährliche Abrechnung) | Website | |
| 3 | Ideal für die Überwachung von Webanwendungen | 30-tägige kostenlose Testphase + kostenloser Tarif + kostenlose Demo verfügbar | Ab $19.99/Monat | Website | |
| 4 | Am besten für Plug-and-Play-Installation | Kostenlose Demo verfügbar | Preise auf Anfrage | Website | |
| 5 | Am besten geeignet für Full-Stack-Observability | 14-tägige kostenlose Testversion | Ab $5/Monat | Website | |
| 6 | Am besten für Visualisierungsmöglichkeiten geeignet | Kostenloser Download | Kostenlos nutzbar | Website | |
| 7 | Am besten für AIOps und Beobachtbarkeit | Kostenlose Demo verfügbar | Preise auf Anfrage | Website | |
| 8 | Am besten für End-to-End-Überwachung geeignet | 7-tägige kostenlose Testversion | Preise auf Anfrage | Website | |
| 9 | Am besten für verteilte Netzwerke | Kostenlose Beratung verfügbar | Preise auf Anfrage | Website | |
| 10 | Am besten geeignet für leichtgewichtiges Monitoring | Kostenlose Version verfügbar | Preis auf Anfrage | Website |
Warum Sie unseren Software-Bewertungen vertrauen können
Wir testen und bewerten seit 2023 Software. Als Technologie-Führungskräfte wissen wir, wie kritisch und herausfordernd es ist, die richtige Entscheidung bei der Softwareauswahl zu treffen.
Wir investieren viel in gründliche Recherche, um unserer Zielgruppe zu helfen, bessere Kaufentscheidungen zu treffen. Wir haben über 2.000 Tools für verschiedene Technikanwendungsfälle getestet und mehr als 1.000 umfassende Softwarebewertungen geschrieben. Erfahren Sie wie wir transparent bleiben und unsere Methodik der Softwarebewertung.
-

TestDevLab
Visit Website -
Site24x7
Visit WebsiteThis is an aggregated rating for this tool including ratings from Crozdesk users and ratings from other sites.4.7 -
GitHub Actions
Visit WebsiteThis is an aggregated rating for this tool including ratings from Crozdesk users and ratings from other sites.4.8


Beste Nagios-Alternativen im Test
Nachfolgend finden Sie meine ausführlichen Zusammenfassungen der besten Nagios-Alternativen, die es auf meine Übersicht geschafft haben. Meine Bewertungen geben einen detaillierten Einblick in die wichtigsten Funktionen, Vor- u0026amp; Nachteile, Integrationen und idealen Anwendungsfälle der einzelnen Tools, damit Sie die passende Lösung für sich finden können.
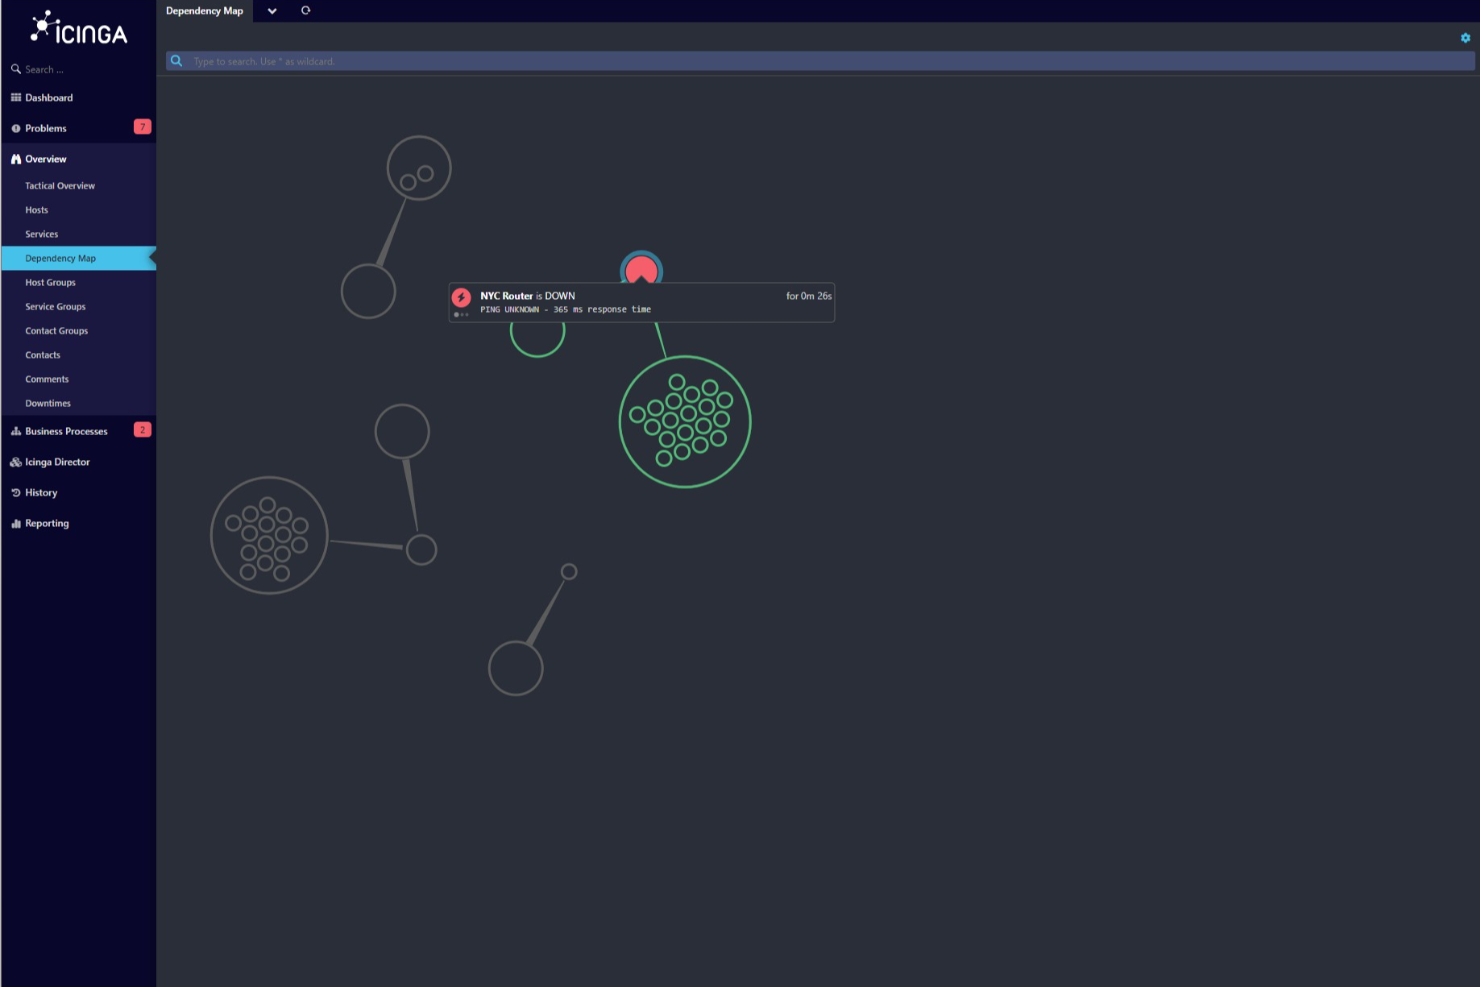
Icinga ist eine Open-Source-Überwachungslösung, die speziell für komplexe IT-Infrastrukturen entwickelt wurde und hauptsächlich von IT-Fachleuten und Organisationen genutzt wird. Sie überwacht Server, Netzwerke, Anwendungen und Cloud-Umgebungen.
Warum es eine gute Nagios-Alternative ist: Icinga glänzt in komplexen IT-Umgebungen mit Überwachung der Infrastruktur, Automatisierung und Benachrichtigungen. Es bietet spezialisierte Überwachung für Kubernetes, Datenbanken und VMware, was es ideal für anspruchsvolle Umgebungen macht. Die Analysefunktionen sowie die Verwaltung von Metriken und Protokollen verschaffen Ihrem Team wertvolle Einblicke. Die Plattform integriert sich zudem mit IT-Service-Management-Tools und erhöht so ihren Nutzen.
Herausragende Funktionen & Integrationen:
Funktionen umfassen Infrastrukturüberwachung, Automatisierung und Cloud-Überwachung. Ebenso werden Analysen und Metrik-/Protokollmanagement geboten und es wird spezialisierte Überwachung für Kubernetes, Datenbanken und VMware unterstützt.
Integrationen umfassen Puppet, Ansible, Chef, SaltStack, Grafana, Graylog, Elasticsearch, InfluxDB, Jira und Slack.
Pros and Cons
Pros:
- Open-Source-Flexibilität
- Unterstützt komplexe Umgebungen
- Kompatibilität mit Nagios-Plugins
Cons:
- Höhere Lernkurve
- Erfordert technisches Fachwissen
New Product Updates from Icinga

Icinga Adds TOTP Two-Factor Authentication to Icinga Web
Icinga added time-based one-time password (TOTP) two-factor authentication to Icinga Web, helping organizations strengthen login security with an additional verification step. For more information, visit Icinga’s official site.
 .
.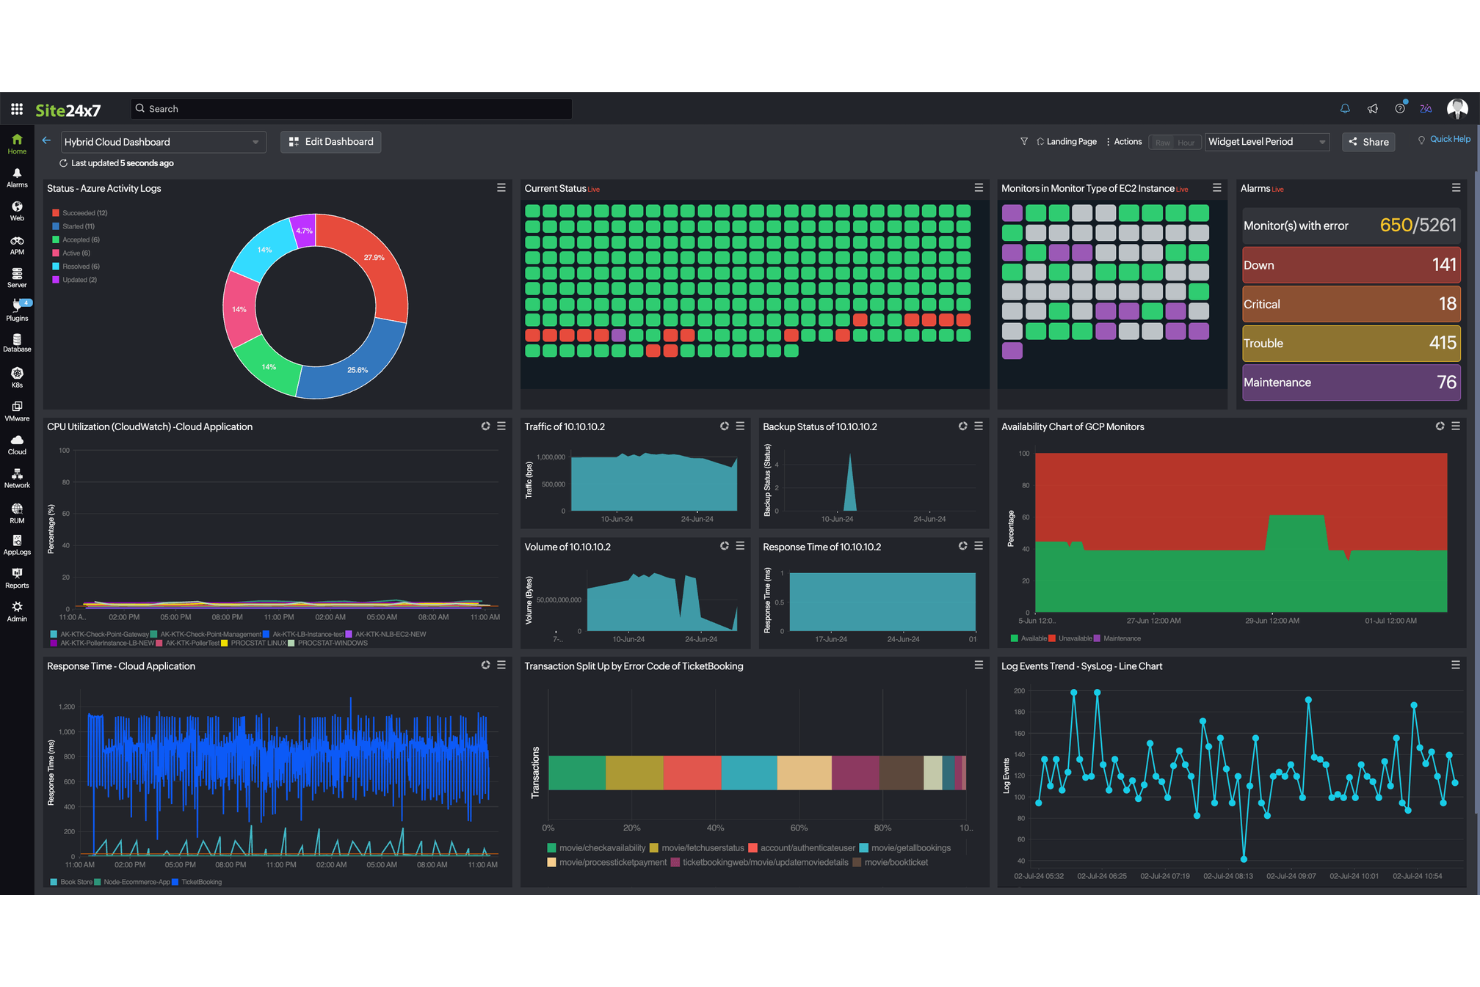
Für Unternehmen, die nach einer zuverlässigen Nagios-Alternative suchen, bietet Site24x7 eine überzeugende Kombination aus Überwachungsfunktionen und benutzerfreundlichen Features. Diese cloudbasierte Lösung richtet sich an IT-Profis und Organisationen, die eine umfassende Überwachung von Servern, Netzwerken, Anwendungen und Websites in verschiedenen Umgebungen benötigen. Site24x7 bewältigt Herausforderungen wie die Verwaltung von Multi-Cloud-Umgebungen und die Automatisierung wiederkehrender Aufgaben und bietet eine kosteneffiziente Möglichkeit, die IT-Infrastruktur mit einem einzigen Tarif zu überwachen.
Warum ich Site24x7 gewählt habe
Ich habe Site24x7 als Top-Nagios-Alternative ausgewählt, weil es zuverlässige Multi-Cloud-Überwachungsfunktionen und Automatisierungsfeatures bietet. Mit Site24x7 können Sie Umgebungen wie AWS, Azure und GCP nahtlos über eine zentrale Konsole überwachen, was das Management komplexer Infrastrukturen erleichtert. Zudem reduziert die Automatisierung wiederkehrender Tätigkeiten den manuellen Aufwand, sodass sich Ihr Team auf strategisch wichtigere Aufgaben konzentrieren kann. Diese Merkmale sind entscheidend für Organisationen, die ihre Effizienz steigern und die Überwachungsprozesse optimieren möchten.
Site24x7 Hauptfunktionen
Neben Multi-Cloud-Überwachung und Automatisierung bietet Site24x7:
- Log-Management: Liefert Einblicke in Ihren gesamten Technologie-Stack für eine bessere Analyse und Fehlerbehebung.
- API-Überwachung: Stellt sicher, dass Ihre APIs korrekt funktionieren, um die Servicezuverlässigkeit zu gewährleisten.
- Statusseiten: Ermöglicht das Erstellen anpassbarer Seiten zur Kommunikation von Ausfallzeiten und zum Aufbau von Nutzervertrauen.
- Vorfallmanagement: Unterstützt die effiziente Bearbeitung von Vorfällen durch detaillierte Dokumentation, einschließlich Fehlerprotokollen und Zeitverläufen.
Site24x7 Integrationen
Integrationen umfassen AWS, Azure, Google Cloud Platform, Docker, Kubernetes, Microsoft Exchange, Microsoft SharePoint und viele mehr.
Pros and Cons
Pros:
- Umfassende Überwachung für verschiedene Systeme
- KI-gestütztes Full-Stack-Monitoring unterstützt das Management von Multicloud-Infrastrukturen
- Flexibles Monitoring lässt sich problemlos mit verschiedenen Infrastrukturelementen integrieren
Cons:
- Fehler bei Benachrichtigungen führen zu Problemen beim Hinzufügen neuer Überwachungskonfigurationen
- Komplexe Konfiguration verlangsamt die anfängliche Einrichtung und das Verständnis der Plattform
New Product Updates from Site24x7

Site24x7 Adds Discovery Issues for AWS Monitoring
Site24x7 added Discovery Issues for AWS monitoring, helping teams identify why resources are not being discovered across services and regions. The feature surfaces permission gaps, policy restrictions, and blocked API actions to support faster troubleshooting. For more information, visit Site24x7’s official site.
 .
.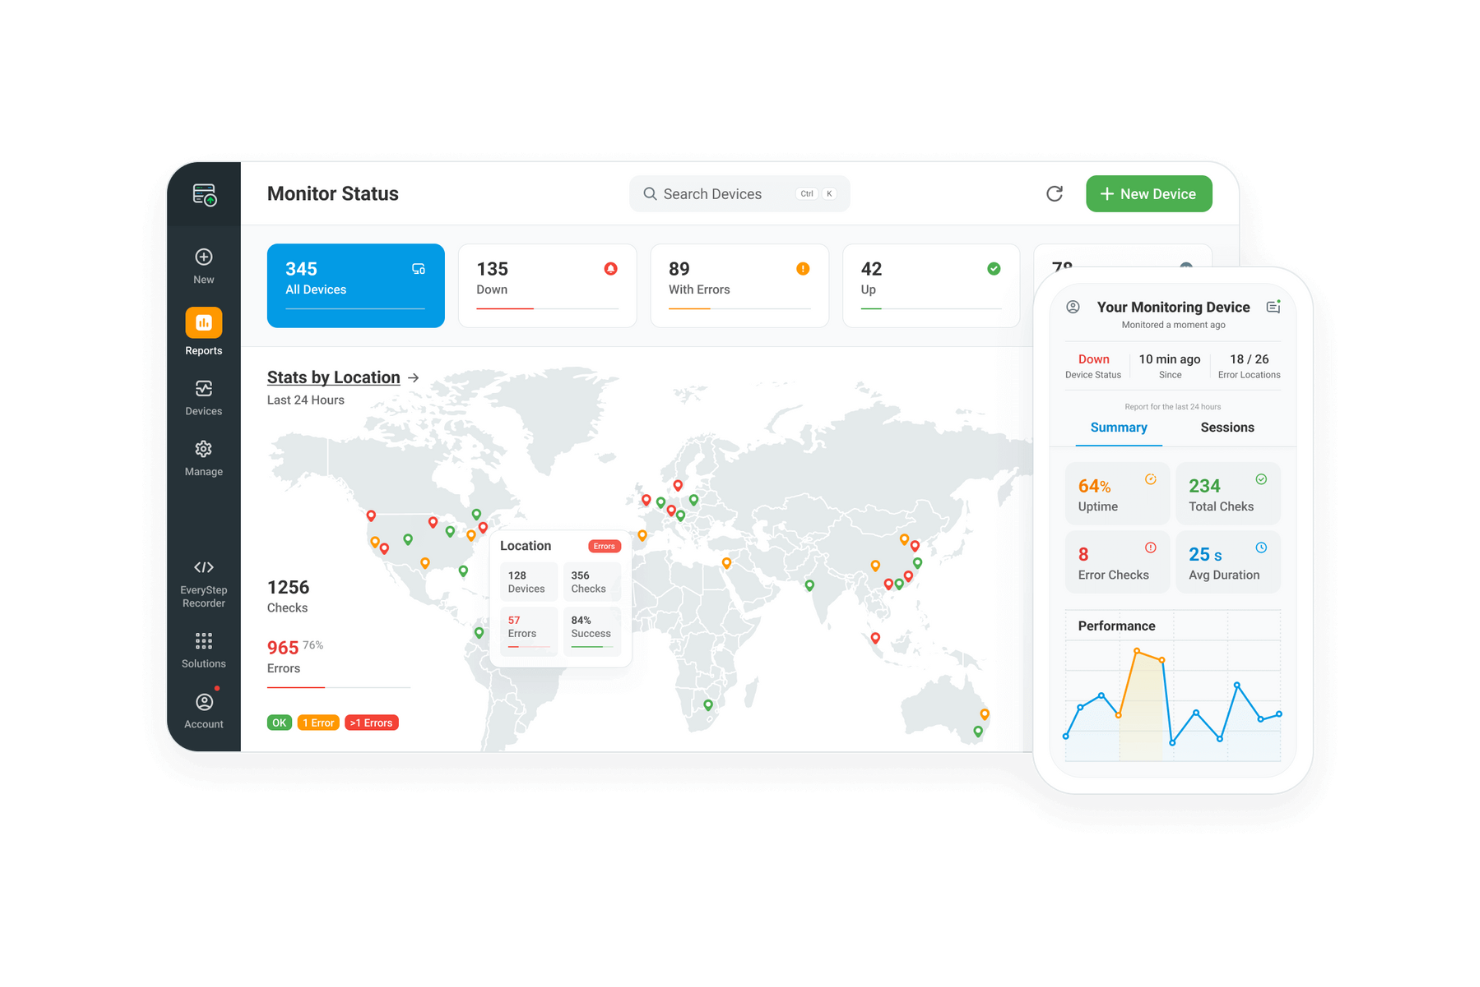
Dotcom-Monitor ist ein Tool zur Überwachung der Web-Performance, das sich an Entwickler, IT-Teams und digitale Marketer richtet. Es hilft dabei, die Verfügbarkeit, Leistung und Funktionalität von Websites sicherzustellen.
Warum es eine gute Nagios-Alternative ist: Dotcom-Monitor ist auf die Überwachung von Webanwendungen spezialisiert und bietet Echtzeit-Einblicke in die Performance. Dank seiner synthetischen Überwachungsfunktionen kann Ihr Team Nutzerinteraktionen simulieren und Probleme proaktiv erkennen. Das Tool bietet umfassende Berichte, die dabei helfen, Leistungstrends im Zeitverlauf zu verstehen. Mit dem Fokus auf Webanwendungs-Überwachung verfolgt es einen spezialisierten Ansatz, der sich von den allgemeinen Überwachungsmöglichkeiten von Nagios unterscheidet.
Herausragende Funktionen & Integrationen:
Funktionen umfassen synthetisches Monitoring, das Nutzerinteraktionen simuliert, um Probleme zu erkennen, bevor sie echte Nutzer beeinträchtigen. Es bietet zudem umfassendes Reporting, um Leistungstrends über die Zeit hinweg zu analysieren. Die Echtzeit-Performance-Einblicke helfen dabei, Probleme schnell zu beheben.
Integrationen umfassen Amazon Web Services, Microsoft Azure, Google Cloud Platform, Jenkins, PagerDuty, Slack, Splunk, New Relic, ServiceNow und Atlassian Jira.
Pros and Cons
Pros:
- Spezialisierte Webanwendungs-Überwachung
- Echtzeit-Performance-Einblicke
- Umfassendes Reporting
Cons:
- Erfordert technisches Know-how
- Beschränkt auf Webanwendungen
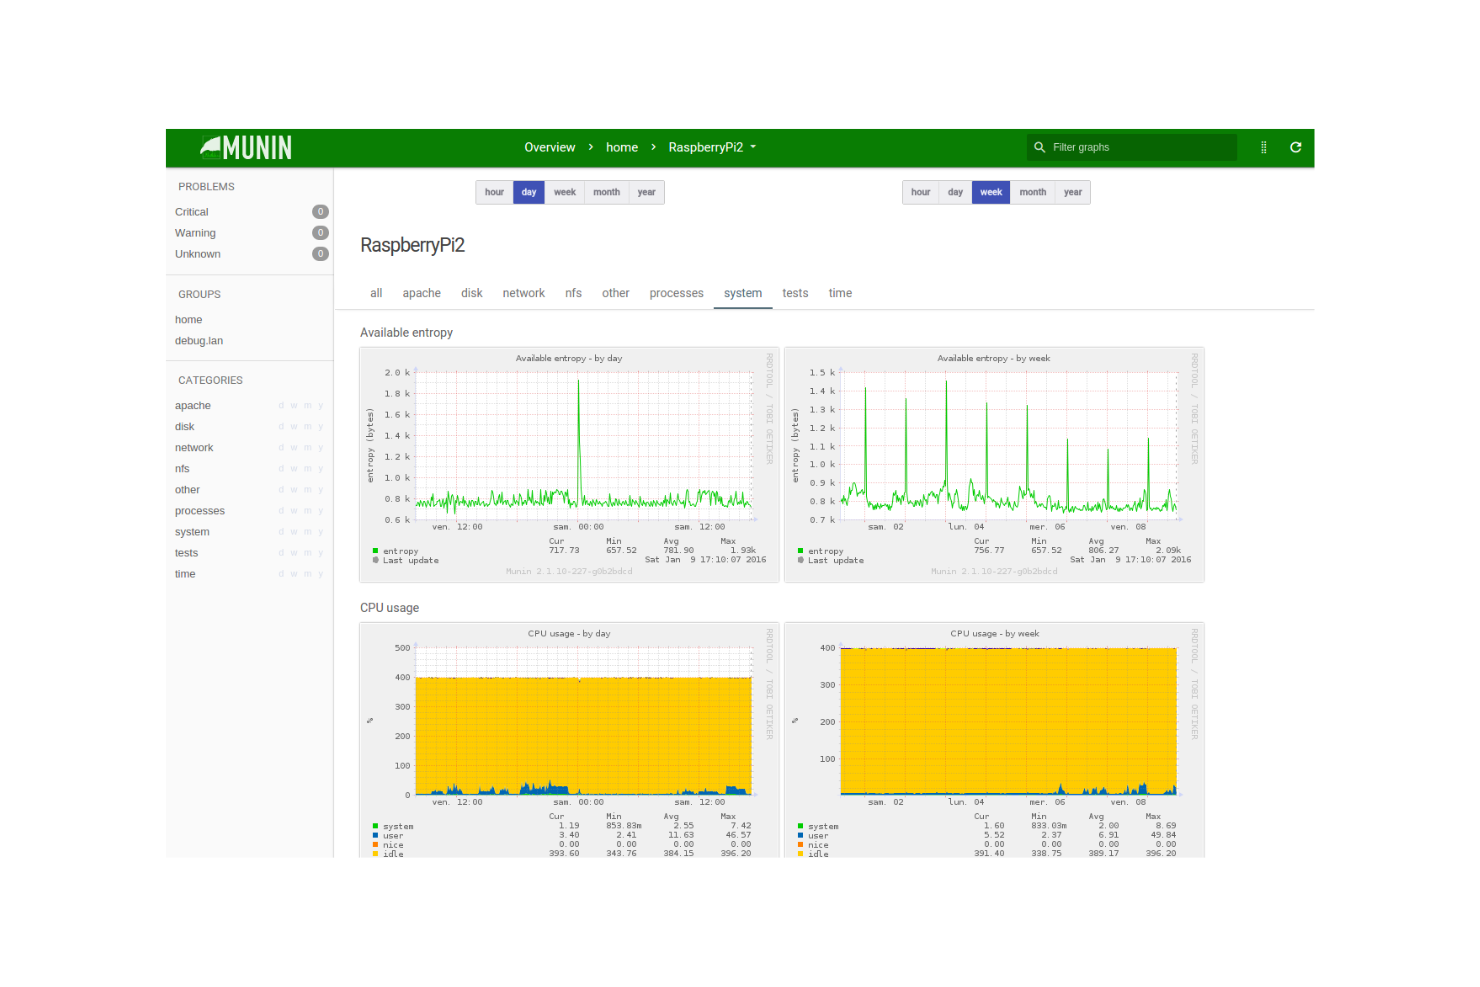
Munin ist ein netzwerkbasiertes Ressourcenüberwachungstool, das für Systemadministratoren und IT-Profis entwickelt wurde. Es bietet Einblicke in die Systemleistung und Ressourcennutzung.
Warum es eine gute Nagios-Alternative ist: Munin bietet eine unkomplizierte Plug-and-Play-Installation, sodass Ihr Team schnell mit dem Monitoring starten kann. Es erstellt automatisch Diagramme aus Leistungsdaten, wodurch sich Trends mühelos visualisieren lassen. Das Tool ist ressourcensparend und belastet Ihre Systeme kaum. Die einfache Bedienbarkeit und der minimale Konfigurationsaufwand machen es zu einer praktischen Wahl für alle, die eine unkomplizierte Alternative zu Nagios suchen.
Herausragende Funktionen & Integrationen:
Funktionen umfassen die automatische Diagrammerstellung, die hilft, Datentrends über die Zeit zu visualisieren. Zudem unterstützt Munin eine leichte Architektur, die den Ressourcenverbrauch auf Systemen minimiert. Dank der einfachen Konfigurationsschritte können Sie ohne komplexe Einrichtung sofort loslegen.
Integrationen gibt es zu Nagios, Cacti, Zabbix, Graphite, InfluxDB, Prometheus, Elasticsearch, Grafana, Jenkins und Docker.
Pros and Cons
Pros:
- Einfache Einrichtung
- Leichte Architektur
- Automatische Diagrammerstellung
Cons:
- Begrenzte Skalierbarkeit
- Grundlegender Funktionsumfang
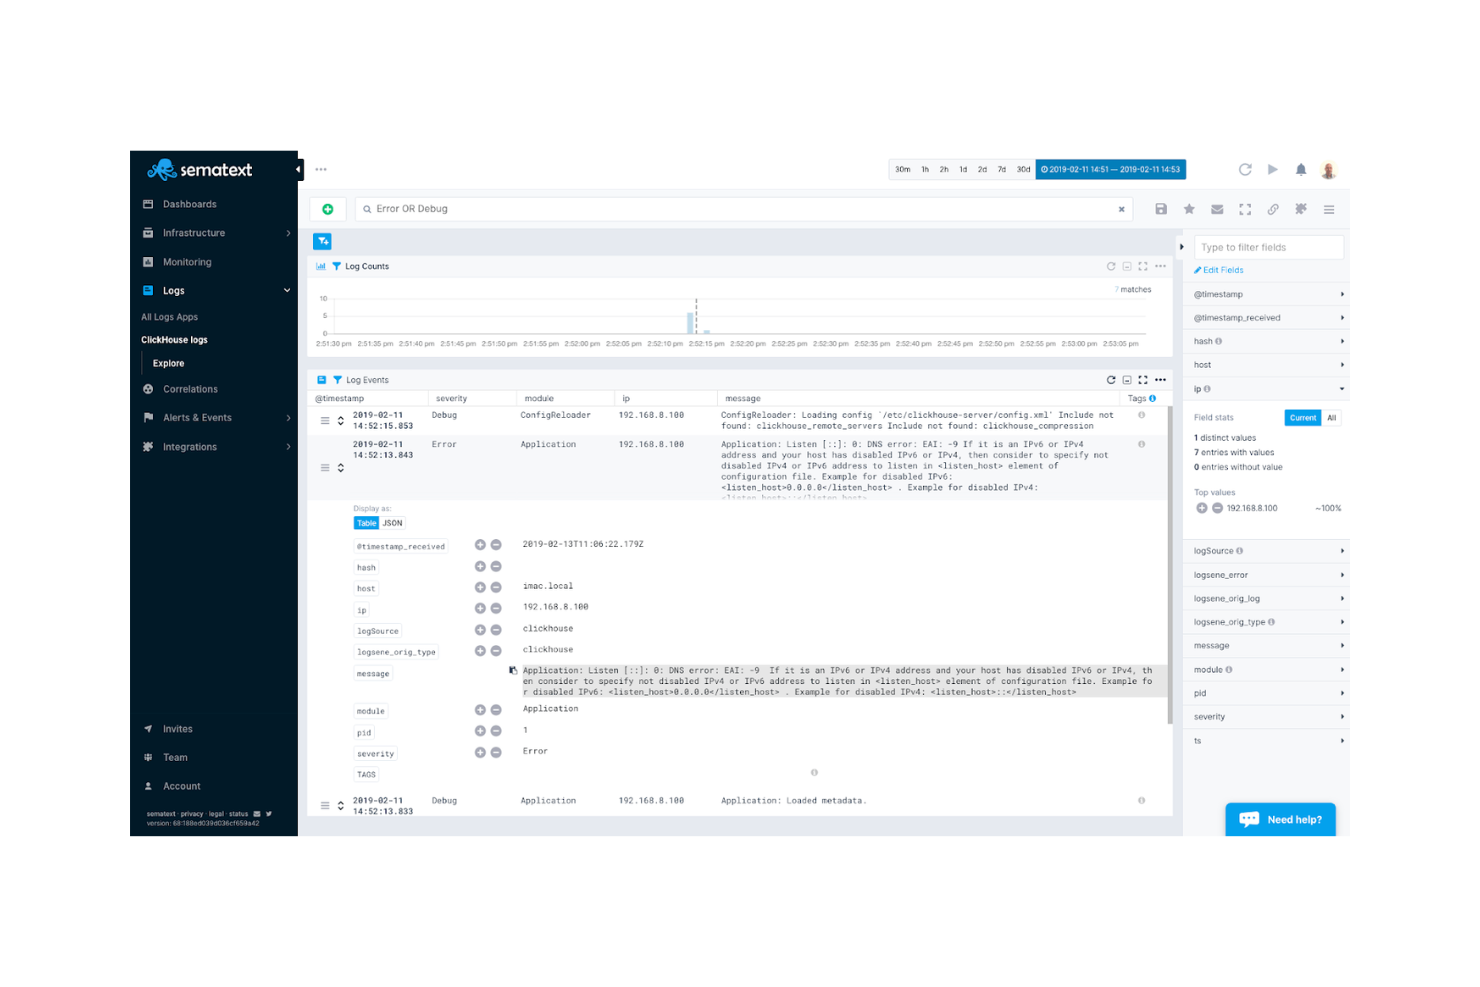
Sematext ist eine cloudbasierte Überwachungs- und Protokollierungsplattform, die sich an Entwickler, IT-Betrieb und DevOps-Teams richtet. Sie bietet Einblicke in die Anwendungsleistung, Infrastrukturüberwachung und das Log-Management.
Warum es eine gute Nagios-Alternative ist: Sematext bietet Full-Stack-Observability, sodass Ihr Team Anwendungen, Infrastruktur und Protokolle alles an einem Ort überwachen kann. Die Analysen in Echtzeit helfen, Leistungsprobleme schnell zu erkennen. Die benutzerfreundlichen Dashboards erleichtern die Datenvisualisierung und das Nachverfolgen von Metriken. Mit seinen umfassenden Überwachungsfunktionen bietet Sematext einen integrierteren Ansatz als Nagios.
Besondere Funktionen & Integrationen:
Funktionen umfassen Echtzeit-Analysen, die Ihrem Team helfen, Probleme schnell zu identifizieren. Die benutzerfreundlichen Dashboards machen die Visualisierung von Daten einfach, sodass Sie Metriken leicht nachverfolgen können. Mit den umfassenden Überwachungsfunktionen behalten Sie stets den vollständigen Überblick über Ihre Systeme.
Integrationen umfassen AWS, Azure, Google Cloud Platform, Kubernetes, Docker, Elasticsearch, Apache Kafka, NGINX, Redis und MySQL.
Pros and Cons
Pros:
- Full-Stack-Observability
- Echtzeit-Analysen
- Benutzerfreundliche Dashboards
Cons:
- Benötigt Einarbeitungszeit
- Begrenzte Offline-Funktionen
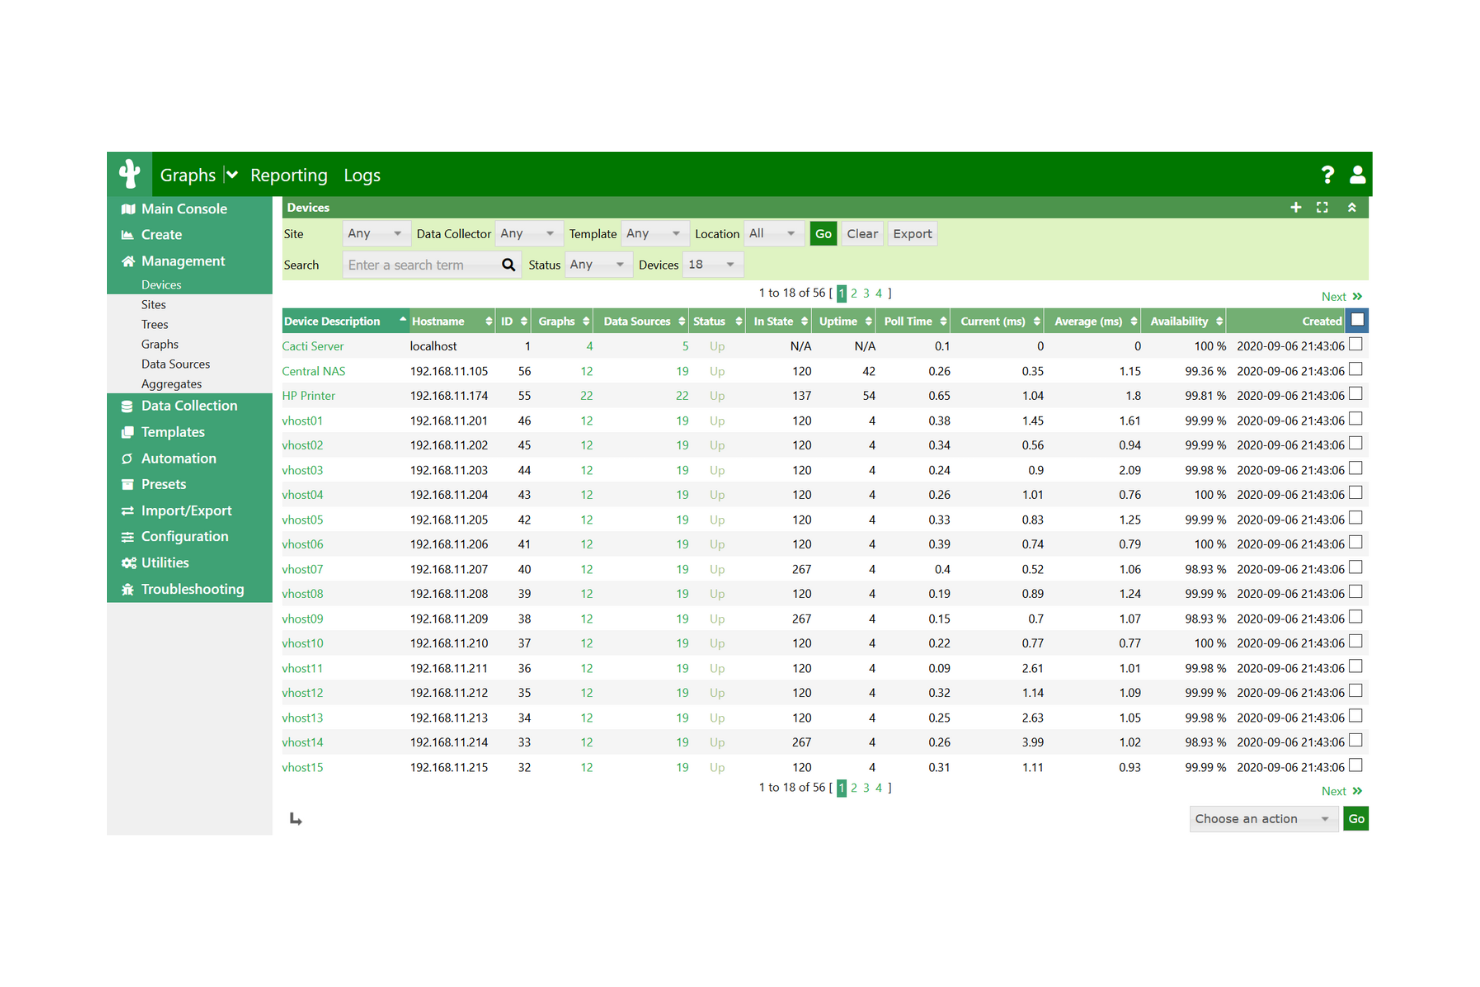
Cacti ist ein Netzwerküberwachungs- und Visualisierungstool, das für IT-Administratoren und Netzwerkmanager entwickelt wurde. Es bietet detaillierte Visualisierungen von Netzwerkdaten und Systemleistung.
Warum es eine gute Nagios-Alternative ist: Cacti überzeugt durch ausgefeilte grafische Darstellungsmöglichkeiten, mit denen Sie detaillierte visuelle Repräsentationen Ihrer Netzwerkdaten erstellen können. Die intuitive Benutzeroberfläche erleichtert die Einrichtung und Verwaltung von Diagrammen, auch bei komplexen Datensätzen. Das Tool unterstützt die Datensammlung über SNMP, was die Präzision der Visualisierungen erhöht. Dank des Schwerpunkts auf Visualisierung bietet Cacti einen klaren Vorteil für Teams, die übersichtliche grafische Einblicke in ihre Netzwerke benötigen.
Herausragende Funktionen & Integrationen:
Funktionen umfassen fortschrittliche Visualisierungsmöglichkeiten, mit denen Sie komplexe Daten einfach veranschaulichen können. Es unterstützt SNMP für eine präzise Datenerfassung und erhöht dadurch die Genauigkeit Ihrer Diagramme. Die intuitive Benutzeroberfläche macht das Einrichten und Verwalten dieser Visualisierungen besonders einfach.
Integrationen umfassen Nagios, InfluxDB, Graphite, Prometheus, Elasticsearch, Grafana, OpenNMS, Zabbix, SolarWinds und Splunk.
Pros and Cons
Pros:
- Ausgezeichnete grafische Darstellungsmöglichkeiten
- Intuitive Benutzeroberfläche
- Unterstützt SNMP-Datenerfassung
Cons:
- Begrenzte Skalierbarkeit
- Einfache Alarmierungsfunktionen
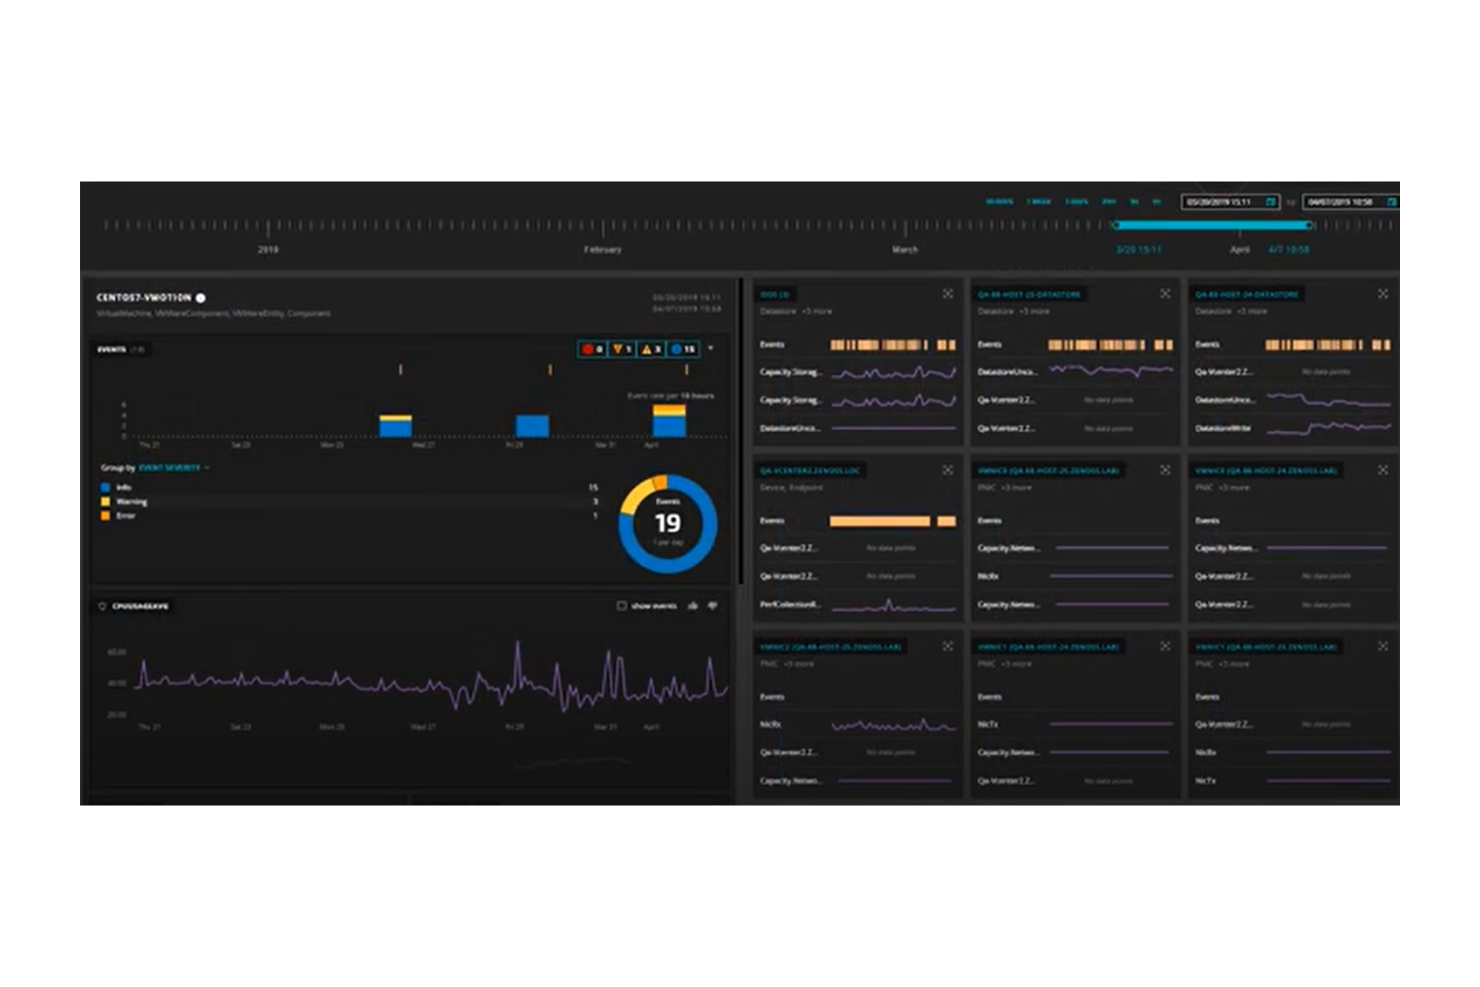
Zenoss Core ist eine hybride Plattform für IT-Überwachung und -Analytik, die für IT-Betriebsteams entwickelt wurde. Sie liefert Einblicke in die Infrastruktur-Performance und hilft, Probleme in Echtzeit zu erkennen und zu beheben.
Warum es eine gute Alternative zu Nagios ist: Zenoss Core integriert AIOps-Funktionen und bietet erweiterte Analytik, um Probleme vorherzusagen und zu verhindern, bevor sie Ihren Betrieb beeinträchtigen. Die Echtzeit-Überwachung verschafft Ihnen einen umfassenden Überblick über Ihre Infrastruktur, sodass Ihr Team schnell auf Vorfälle reagieren kann. Die Observability-Features der Plattform stellen sicher, dass Sie Leistungskennzahlen verfolgen und Einblicke in die Systemgesundheit gewinnen. Mit seinem Fokus auf Analytik und Beobachtbarkeit bietet Zenoss Core einen proaktiveren Ansatz als Nagios.
Hervorstechende Funktionen & Integrationen:
Funktionen beinhalten erweiterte Analytik, die hilft, potenzielle Probleme vorherzusagen und zu verhindern. Die Überwachung in Echtzeit bietet Ihnen eine umfassende Sichtbarkeit Ihrer Infrastruktur. Die Fähigkeiten zur Beobachtbarkeit der Plattform sorgen dafür, dass Sie Leistungskennzahlen und die Systemgesundheit effektiv verfolgen können.
Integrationen umfassen Amazon Web Services, Microsoft Azure, Google Cloud Platform, VMware, Docker, Kubernetes, ServiceNow, Splunk, PagerDuty und Slack.
Pros and Cons
Pros:
- Erweiterte Analysefunktionen
- Echtzeit-Überwachung
- Proaktive Fehlererkennung
Cons:
- Technisches Fachwissen erforderlich
- Komplexität bei der Ersteinrichtung
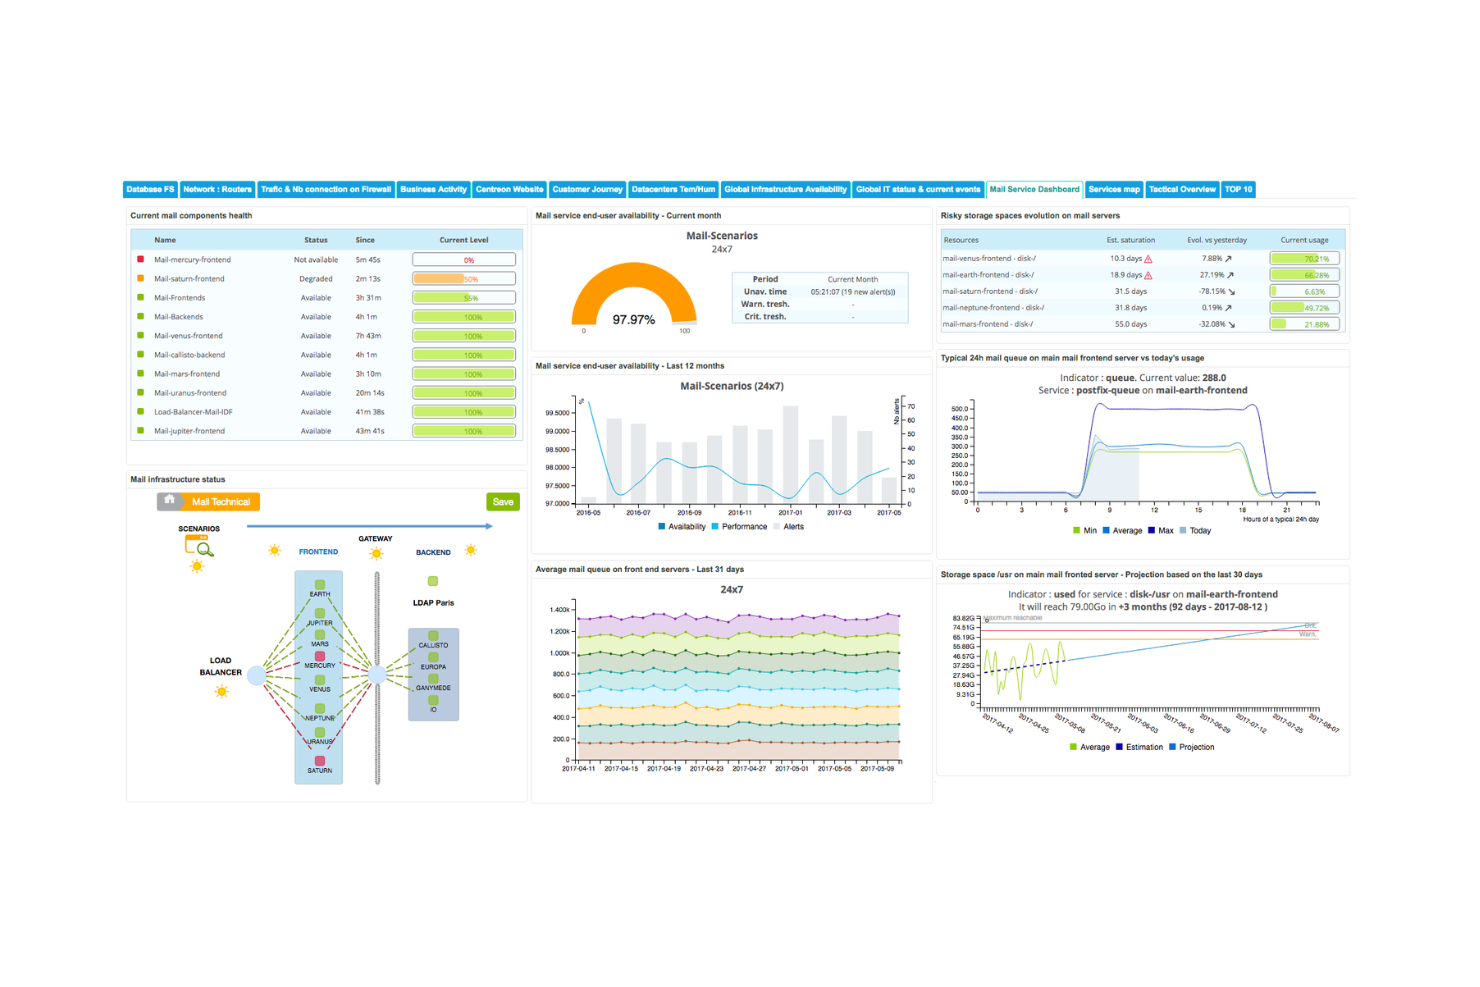
Centreon ist eine IT-Überwachungslösung, die für Unternehmen entwickelt wurde, die eine End-to-End-Transparenz benötigen und wird hauptsächlich von IT-Betriebsteams eingesetzt. Sie überwacht IT-Infrastrukturen, Anwendungen und Netzwerke, um eine optimale Leistung sicherzustellen.
Warum es eine gute Nagios-Alternative ist: Centreon bietet End-to-End-Überwachung mit Funktionen wie automatischer Erkennung und zentralisierten Dashboards. Es liefert Ihrem Team in Echtzeit Einblicke in Ihre IT-Umgebung und hilft, Probleme schnell zu erkennen und zu beheben. Die Skalierbarkeit der Plattform unterstützt wachsende Unternehmen und stellt sicher, dass Sie umfangreiche Netzwerke überwachen können. Durch die benutzerfreundliche Oberfläche und anpassbare Benachrichtigungen lässt sich das System leicht auf Ihre Bedürfnisse zuschneiden.
Herausragende Funktionen & Integrationen:
Funktionen umfassen automatische Erkennung, zentralisierte Dashboards und anpassbare Benachrichtigungen. Zusätzlich bietet es Einblicke in Echtzeit und Skalierbarkeit für wachsende Unternehmen.
Integrationen umfassen Amazon Web Services, Microsoft Azure, Google Cloud Platform, Docker, Kubernetes, VMware, Cisco, Juniper, Slack und ServiceNow.
Pros and Cons
Pros:
- End-to-End-Transparenz
- Automatische Erkennungsfunktion
- Skalierbar für wachsende Unternehmen
Cons:
- Erfordert technisches Fachwissen
- Komplexität der Ersteinrichtung
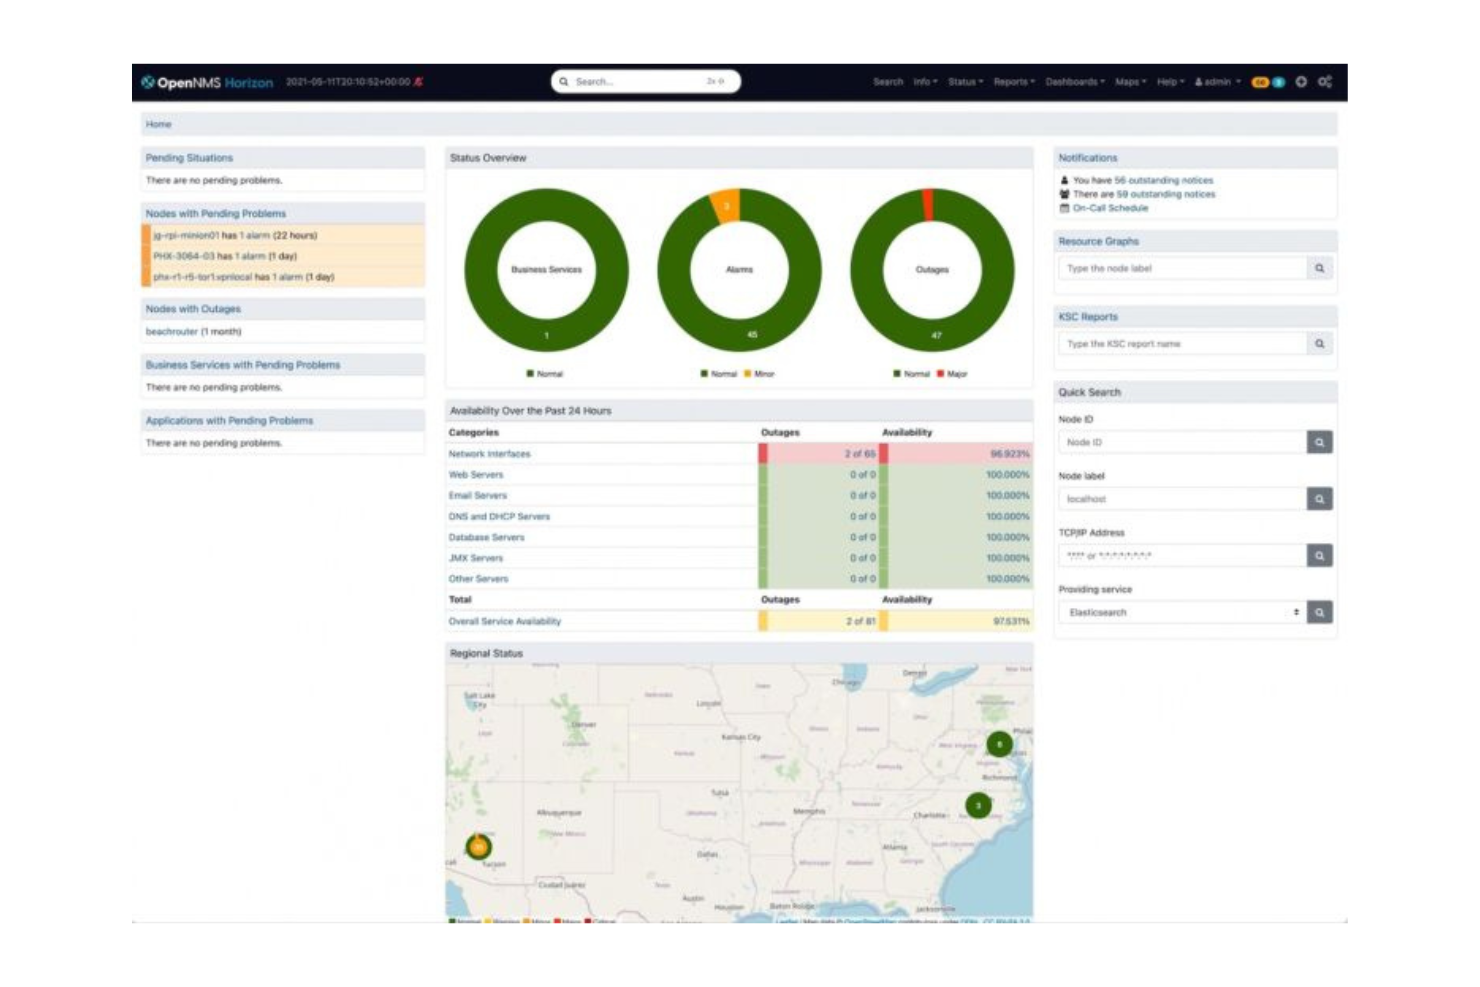
OpenNMS ist eine Open-Source-Netzwerkmanagement-Plattform, die für verteilte Netzwerke entwickelt wurde und hauptsächlich von Netzwerkadministratoren und IT-Fachleuten genutzt wird. Sie bietet Netzwerküberwachung, Ereignismanagement und Leistungsüberwachung.
Warum es eine gute Nagios-Alternative ist: OpenNMS ist auf verteilte Netzwerke zugeschnitten und bietet Funktionen wie Ereignismanagement und Dienstüberwachung. Es unterstützt groß angelegte Implementierungen und ist daher ideal für komplexe Netzwerkstrukturen. Die Plattform ermöglicht die Erfassung und Visualisierung von Leistungsdaten, um Ihrem Team beim Netzwerkmanagement zu helfen. Ihre Skalierbarkeit und die Fähigkeit, verteilte Systeme zu verwalten, heben sie von Nagios ab.
Herausragende Funktionen & Integrationen:
Funktionen umfassen Ereignismanagement, Dienstüberwachung und Leistungsdatenerfassung. Zusätzlich bietet sie Visualisierungstools für die Netzwerkgesundheit und unterstützt groß angelegte Implementierungen für komplexe Netzwerke.
Integrationen umfassen Grafana, Elasticsearch, Prometheus, Kafka, PagerDuty, Slack, Jenkins, AWS, Azure und Google Cloud Plattformen
Pros and Cons
Pros:
- Unterstützt groß angelegte Netzwerke
- Open-Source-Flexibilität
- Detaillierte Leistungsmetriken
Cons:
- Erfordert technisches Fachwissen
- Hohe Lernkurve
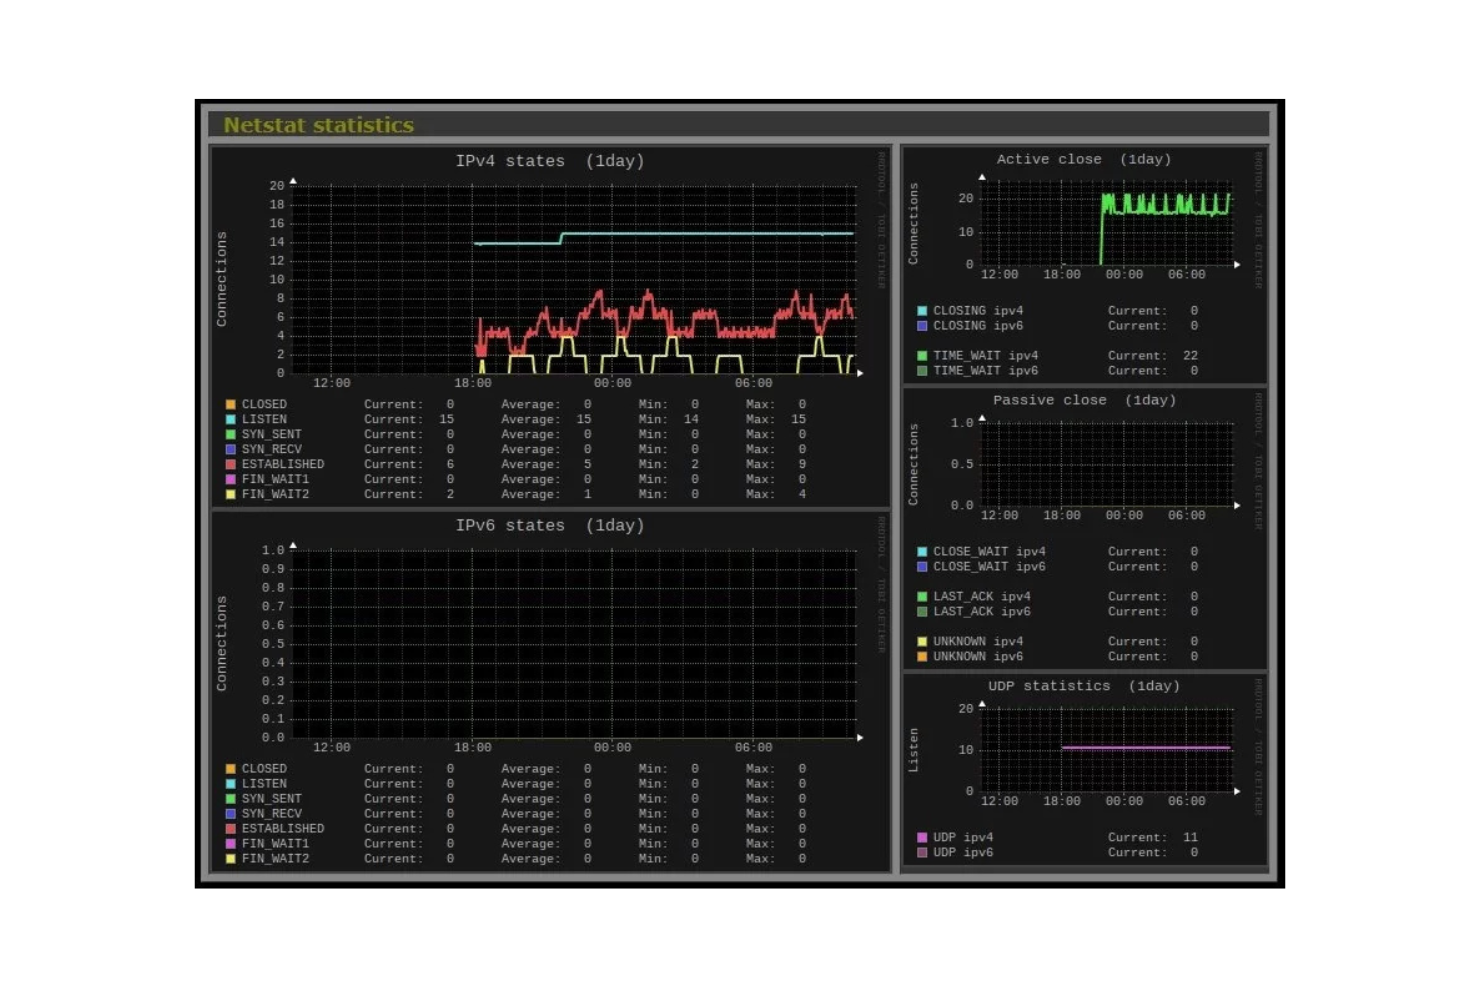
Monitorix ist ein leichtgewichtiges Überwachungstool, das für kleine bis mittelgroße Systeme und Netzwerke entwickelt wurde. Es hilft, die Systemleistung und Ressourcennutzung zu verfolgen, ohne die Systemressourcen stark zu belasten.
Warum es eine gute Nagios-Alternative ist: Monitorix bietet eine schlanke Lösung, die ideal für kleine bis mittelgroße Netzwerke ist. Dank seiner einfachen Einrichtung kann die Überwachung schnell gestartet werden, ohne komplexe Konfigurationen. Das Tool ermöglicht Echtzeitüberwachung und speichert historische Daten, sodass Ihr Team Leistungstrends analysieren kann. Durch den geringen Ressourcenverbrauch eignet es sich besonders für Umgebungen, in denen Effizienz oberste Priorität hat.
Hervorstechende Funktionen & Integrationen:
Funktionen umfassen eine Überwachung in Echtzeit, die sofortige Einblicke in die Systemleistung bietet. Die Erfassung historischer Daten hilft bei der Analyse von Trends über längere Zeiträume. Dank seines schlanken Designs wird das System kaum belastet und ist deshalb besonders effizient für kleinere Setups.
Integrationen umfassen Nagios, Cacti, Zabbix, Grafana, InfluxDB, Elasticsearch, Prometheus, OpenNMS, SolarWinds und Splunk.
Pros and Cons
Pros:
- Leichtgewichtiges Design
- Einfache Einrichtung
- Überwachung in Echtzeit
Cons:
- Begrenzte Skalierbarkeit
- Grundlegender Funktionsumfang
Weitere Nagios-Alternativen
Hier sind weitere Nagios-Alternativen, die es nicht in meine Übersicht geschafft haben, aber dennoch einen Blick wert sind:
- op5 Monitor
Am besten geeignet für Unternehmensskalierbarkeit
- Naemon
Am besten geeignet für modulare Architektur Preise auf Anfrage
- Argus
Am besten für System- und Netzwerküberwachung geeignet


Auswahlkriterien für Nagios-Alternativen
Bei der Auswahl der besten Nagios-Alternativen für diese Liste habe ich häufige Anforderungen und Schmerzpunkte von Käufern berücksichtigt, die sich auf Softwareentwicklungsprodukte beziehen – wie Skalierbarkeit und Integrationsfähigkeit. Außerdem habe ich den folgenden Rahmen genutzt, um meine Bewertung strukturiert und fair zu gestalten:
Kernfunktionen (25 % der Gesamtbewertung)
Um in diese Liste aufgenommen zu werden, musste jede Lösung die folgenden typischen Anwendungsfälle abdecken:
- Systemleistung überwachen
- Echtzeit-Benachrichtigungen bereitstellen
- Netzwerkzustand überwachen
- Protokolle und Daten verwalten
- Mehrere Plattformen unterstützen
Zusätzliche herausragende Funktionen (25 % der Gesamtbewertung)
Um die Auswahl weiter einzugrenzen, habe ich auch nach besonderen Merkmalen gesucht, zum Beispiel:
- Erweiterte Analysefunktionen
- Vollständige Stack-Transparenz
- Prognostische Einblicke
- AIOps-Integration
- Anpassbare Dashboards
Benutzerfreundlichkeit (10% der Gesamtbewertung)
Um mir einen Eindruck von der Benutzerfreundlichkeit jedes Systems zu verschaffen, habe ich Folgendes berücksichtigt:
- Intuitive Benutzeroberfläche
- Einfache Navigation
- Reaktionsschnelles Design
- Anpassbare Einstellungen
- Möglichkeiten zur Nutzer-Rückmeldung
Onboarding (10% der Gesamtbewertung)
Um die Onboarding-Erfahrung jeder Plattform zu bewerten, habe ich Folgendes berücksichtigt:
- Verfügbarkeit von Trainingsvideos
- Interaktive Produkttouren
- Vorgefertigte Vorlagen
- Zugang zu Chatbots
- Webinare und Live-Demos
Kundenservice (10% der Gesamtbewertung)
Um die Kundenservice-Angebote der einzelnen Software-Anbieter zu beurteilen, habe ich Folgendes berücksichtigt:
- Verfügbarkeit von 24/7-Support
- Zugang zu Live-Chat
- Umfassende Wissensdatenbank
- Reaktionszeit auf Anfragen
- Qualität des bereitgestellten Supports
Preis-Leistungs-Verhältnis (10% der Gesamtbewertung)
Um das Preis-Leistungs-Verhältnis der jeweiligen Plattform zu bewerten, habe ich Folgendes berücksichtigt:
- Wettbewerbsfähige Preisgestaltung
- Flexible Zahlungspläne
- Inklusiv-Leistungen im Basistarif
- Kosten zusätzlicher Funktionen
- Rabatte bei jährlicher Abrechnung
Kundenbewertungen (10% der Gesamtbewertung)
Um ein Bild der allgemeinen Kundenzufriedenheit zu bekommen, habe ich bei der Prüfung der Nutzerbewertungen Folgendes berücksichtigt:
- Nutzerzufriedenheit
- Häufig gemeldete Probleme
- Positive Feedback-Trends
- Häufigkeit der Updates
- Community-Engagement
Warum nach einer Nagios-Alternative suchen?
Obwohl Nagios eine gute Softwarelösung für die Entwicklung ist, gibt es verschiedene Gründe, warum einige Nutzer nach Alternativen suchen. Möglicherweise suchen Sie nach einer Nagios-Alternative, weil…
- Sie eine intuitivere Benutzeroberfläche benötigen
- Ihr Team mehr Skalierbarkeit braucht
- Sie eine einfachere Konfiguration suchen
- Sie erweiterte Analysefunktionen wünschen
- Ihr Unternehmen schnellere Alarmsysteme benötigt
Falls Ihnen einer dieser Punkte bekannt vorkommt, sind Sie hier genau richtig. Meine Liste enthält mehrere Softwareoptionen für die Entwicklung, die Teams besser gerecht werden, die vor diesen Herausforderungen mit Nagios stehen und nach Alternativen suchen. Für Teams, die umfassendere Monitoring-Lösungen in Betracht ziehen, kann die Suche nach Alternativen zu New Relic zusätzliche Möglichkeiten für ein umfassendes Application Performance Monitoring bieten.
Nagios: Wichtige Funktionen
Hier sind einige der wichtigsten Funktionen von Nagios, um den Vergleich mit alternativen Lösungen zu erleichtern:
- Überwachungsfunktionen: Überwacht die Leistung und Verfügbarkeit von Servern, Anwendungen und Netzwerkgeräten.
- Benachrichtigungssystem: Sendet Benachrichtigungen per E-Mail oder SMS, wenn Probleme auftreten, um eine schnelle Reaktion zu ermöglichen.
- Web-Oberfläche: Bietet ein benutzerfreundliches Dashboard für die Überwachung und Berichterstellung in Echtzeit.
- Anpassbare Plugins: Unterstützt eine Vielzahl von Plugins für erweiterte Funktionen, die auf spezifische Anforderungen zugeschnitten sind.
- Skalierbarkeit: Kann auf große Umgebungen mit zahlreichen Geräten skaliert werden.
- Community-Support: Wird von einer starken Community für Fehlerbehebung und Weiterentwicklung unterstützt.
- Problemlösung: Funktionen wie Alarmquittierungen und Ereignishandler für automatische Problemlösungen.
- Proaktive Planung: Werkzeuge für Trendanalysen, Kapazitätsplanung und Verwaltung geplanter Ausfallzeiten.
- Berichterstattung: Erstellt Verfügbarkeits- und Verlaufsberichte zur Leistungsüberwachung und Einhaltung von SLAs.
- Mandantenfähigkeit: Mehrere Nutzer können auf jeweils angepasste Ansichten der Infrastruktur zugreifen.
Wie geht es weiter:
Wenn Sie gerade Softwareentwicklung recherchieren, verbinden Sie sich mit einem SoftwareSelect-Berater für kostenlose Empfehlungen.
Sie füllen ein Formular aus und führen ein kurzes Gespräch, in dem Ihre spezifischen Anforderungen geklärt werden. Anschließend erhalten Sie eine Shortlist passender Software zur Überprüfung. Der gesamte Kaufprozess, einschließlich Preisverhandlungen, wird ebenfalls aktiv begleitet.