

AI observability platforms are specialized tools that let you monitor, troubleshoot, and optimize model performance from development to production. For CTOs and IT leads juggling complex infrastructures, choosing the right observability software helps maintain reliability, diagnose failures, meet compliance standards, and make sense of costs across MLOps and agentic workflows.
This guide breaks down the best AI observability tools in 2026, with options for governance, pipeline diagnostics, cost tracking, and anomaly detection, so you can improve uptime, gain actionable insights, and keep your AI stack resilient and future-ready.
Why Trust Our Software Recommendations
6,700+
Reviews
20
Industry experts
16+
Evaluation factors
14
Years
Our team has been testing and reviewing software since 2012. As tech leaders ourselves, we know how difficult—and important—it is to choose the right software.
For this guide, we evaluated tools using hands-on testing and independent research, scoring tools using our selection criteria.
Our reviews reflect our human editorial judgment, not a sales pitch.
Expert reviewers:
- Paulo Gardini MiguelTech Director
 Tim FisherVP of AI
 Gabriel RosasTech Lead & Software Architect
 Christhian GruhnTech Lead & Platform Architect

AI Observability Tools Comparison Table
This comparison table summarizes pricing details for my top AI observability tools selections:
| Tool | Best For | Trial Info | Price | ||
|---|---|---|---|---|---|
| 1 | Best for AI governance with ISO/IEC 42001 compliance | Free demo + 14-day free trial available | From $0.42/GB | Website | |
| 2 | Best for OTel-native AI and agentic monitoring | Free plan + free demo available | Pricing upon request | Website | |
| 3 | Best for AIOps-driven anomaly detection at scale | 7-day free trial | From $0.07/GB | Website | |
| 4 | Best for trace-to-evaluation regression datasets | Free plan + free demo available | From $249/month | Website | |
| 5 | Best for RAG pipeline and retrieval diagnostics | Free plan + free demo available | Pricing upon request | Website | |
| 6 | Best for AI cost forecasting | Free demo available | From $4.50/1000 sessions | Website | |
| 7 | Best for agentic failure triage and RCA | Free plan + free demo available | From $50/month | Website | |
| 8 | Best for governed, multi-agent monitoring | Free plan + free demo available | From $0.002 per trace | Website | |
| 9 | Best for full-stack AI agent tracing | Free plan available | From $19/month | Website | |
| 10 | Best for AI agent cost attribution | 14-day free trial | Pricing upon request | Website |


AI Observability Tools Reviews
Below are my detailed summaries of the best AI observability tools that made it onto my shortlist. My reviews offer a detailed look at the features, capabilities, and best use cases of each platform to help you find the best one for you.
 Best for AI governance with ISO/IEC 42001 compliance
- Free demo + 14-day free trial available
- From $0.42/GB
Visit WebsiteCustomer Rating:4.8/5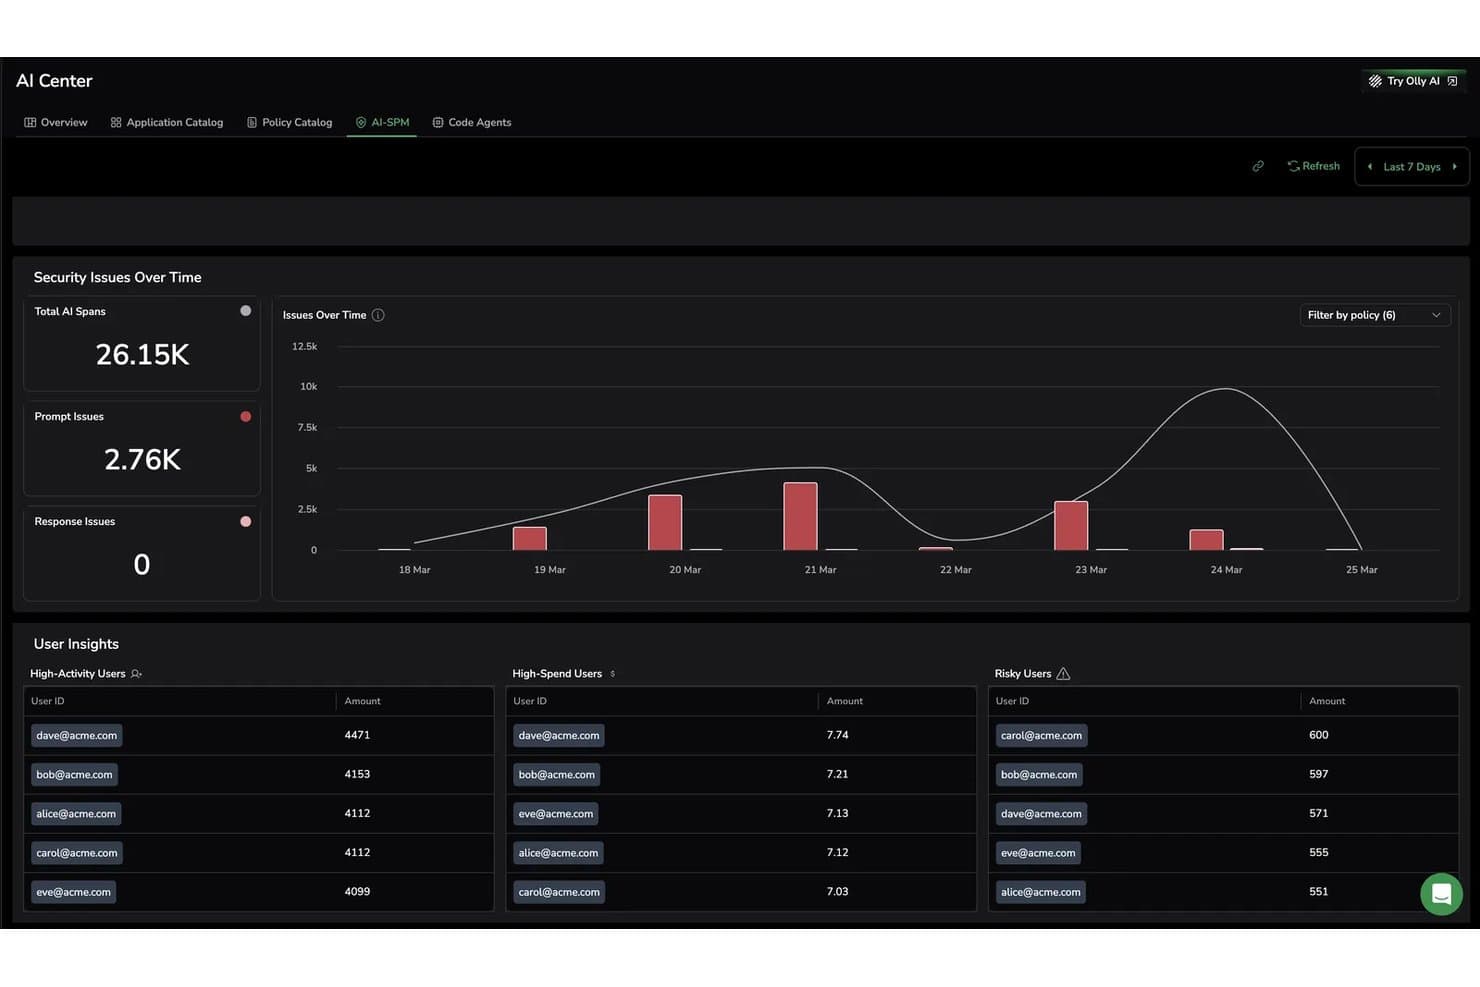
Coralogix tracks AI security issues and risky users in real time. Coralogix is a full-stack observability platform that combines LLM telemetry, AI evaluation, guardrails, anomaly detection, and governance monitoring with traditional APM, log analytics, and SIEM capabilities.
Who Is Coralogix Best For?
Coralogix is a strong fit for IT and DevOps teams that need to govern AI systems alongside traditional infrastructure, especially in regulated industries where compliance standards like ISO/IEC 42001 aren't optional.
Why I Picked Coralogix
I've included Coralogix in my top picks because it's the first observability vendor to earn ISO/IEC 42001:2023 certification, which matters enormously if you're operating AI systems in regulated environments where governance isn't optional. Its AI Discovery module actively scans code repositories to surface AI agents deployed without central IT approval, giving you a complete, auditable map of your organization's AI footprint. Layer on the AI-SPM posture scoring and session-level audit trails, and you have a defensible compliance record built into your workflow.
Coralogix Key Features
- LLM TraceKit: Captures prompts, completions, token counts, tool calls, latency, and cost across providers like OpenAI, Anthropic, AWS Bedrock, and Google Gemini.
- AI Evaluation Engine: Assigns quality and security evaluators to every AI agent, scoring each message in real time.
- Session Explorer: Traces user sessions from start to finish, AI responses, tool calls, and evaluator flags for debugging and compliance auditing.
- eBPF zero-code auto-instrumentation: Hooks into the Linux kernel to capture LLM telemetry across providers without any code changes, at under 1% CPU overhead per node.
Coralogix Integrations
Coralogix integrates with AWS CloudFront, GitHub, Node.js, Okta, Prometheus, Zeek, and UpGuard. It also offers an API for custom telemetry.
Pros and Cons
Pros:
- Uses familiar syntax (Lucene/KQL), making migrations easier
- AI Discovery maps shadow AI deployments
- Detects anomaly automatically
Cons:
- Vector retriever diagnostics not fully documented
- No native human feedback workflow
Learn more about Coralogix: Best for OTel-native AI and agentic monitoring
- Free plan + free demo available
- Pricing upon request
Visit WebsiteCustomer Rating:4.3/5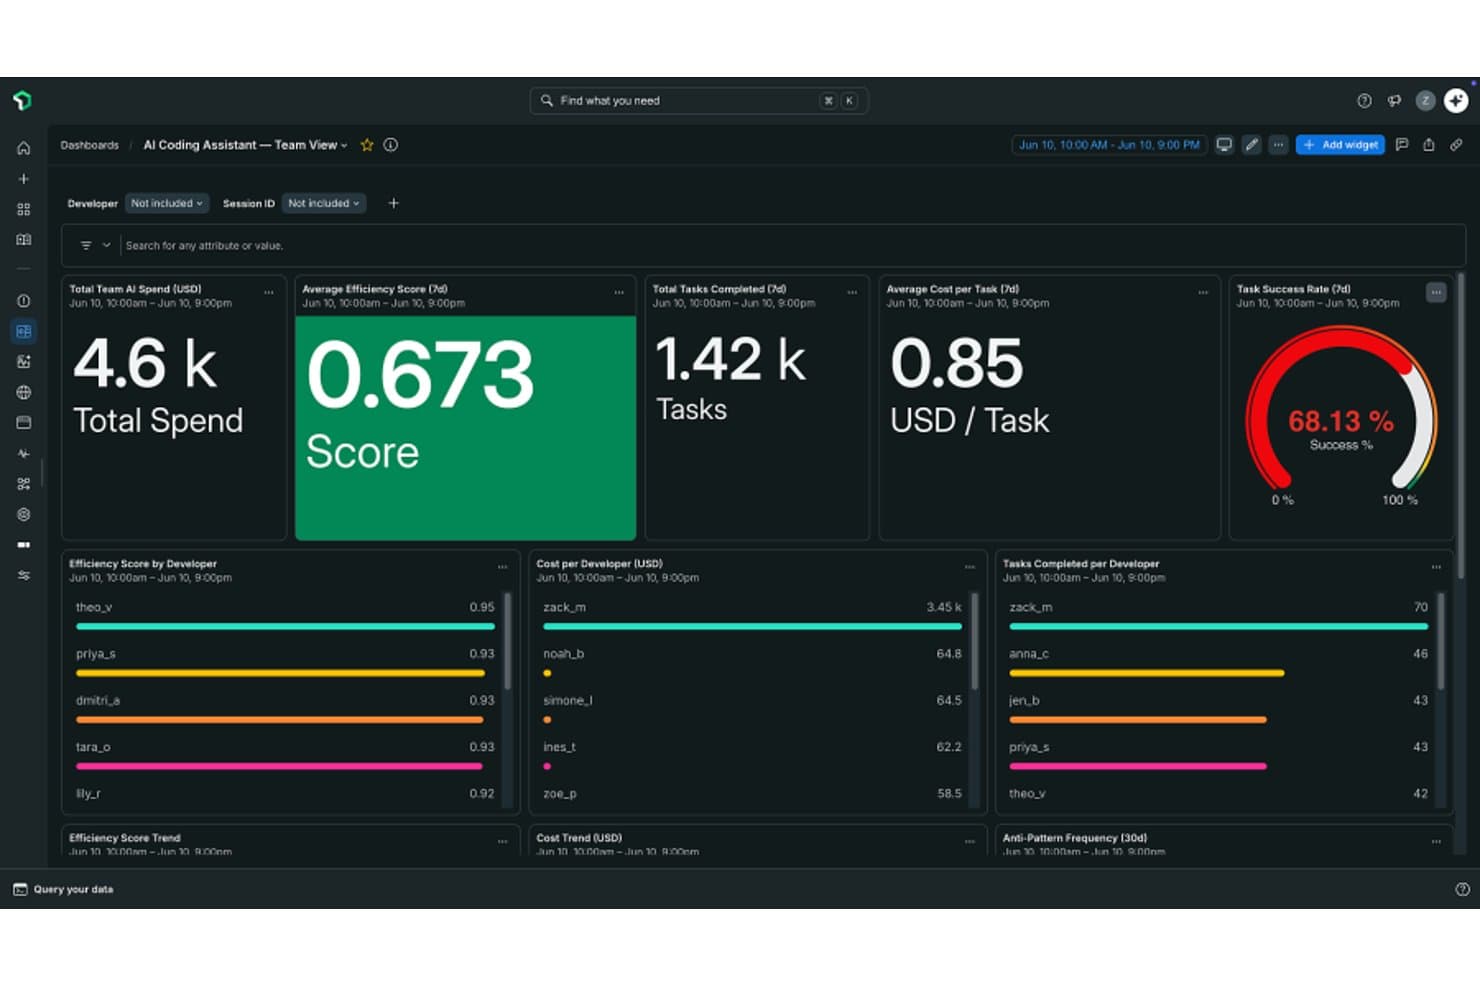
New Relic tracks AI coding team efficiency, spend, and task success rates. New Relic is a full-stack AI observability platform that combines LLM telemetry, distributed tracing, AIOps-driven anomaly detection, and multi-agent workflow monitoring across your entire application and infrastructure layer.
Who Is New Relic Best For?
New Relic is a strong fit for DevOps and SRE teams that already run New Relic for APM and want to extend that same observability stack into LLM and multi-agent AI workloads.
Why I Picked New Relic
New Relic earns its spot on my shortlist because its OTel-native AI monitoring is genuinely production-ready, with the August 2026 GA release letting any OTel-instrumented app send GenAI spans directly without a proprietary agent. I also like how the Agents Service Map visualizes live multi-agent ecosystems, showing agent-to-agent calls, tool utilization, and MCP server lifecycles in a single trace view. That means when an agentic workflow misfires, I can pinpoint exactly which agent or tool call broke the chain.
New Relic Key Features
- Applied Intelligence anomaly detection: ML models scan metrics, logs, and traces for abnormal patterns and correlate related alerts into a single enriched incident for faster investigation.
- Model Inventory dashboard: Tracks all LLM calls across providers, surfacing cost, performance, and quality comparisons in a single view so you can evaluate models running in production.
- PII drop filters: Regex-based filters redact or exclude sensitive data at the ingest pipeline level before it's stored, with a global toggle to disable content recording entirely.
- New Relic AI Assistant: Generates conversational system insights, writes NRQL queries, and runs automated root-cause analysis.
New Relic Integrations
New Relic supports 800+ integrations, including OpenAI, Amazon Bedrock, LangChain, Pinecone, Weaviate, and Amazon SageMaker. It also accepts OpenTelemetry GenAI spans through its native OTLP endpoint.
Pros and Cons
Pros:
- Unified telemetry from LLMs to infrastructure
- Agentic AI workflows visualized in real time
- OTel-native GenAI observability across the stack
Cons:
- SaaS-only, no self-hosted deployment option
- No automated LLM output quality evaluation
Learn more about New Relic: Best for AIOps-driven anomaly detection at scale
- 7-day free trial
- From $0.07/GB
Visit WebsiteCustomer Rating:4.3/5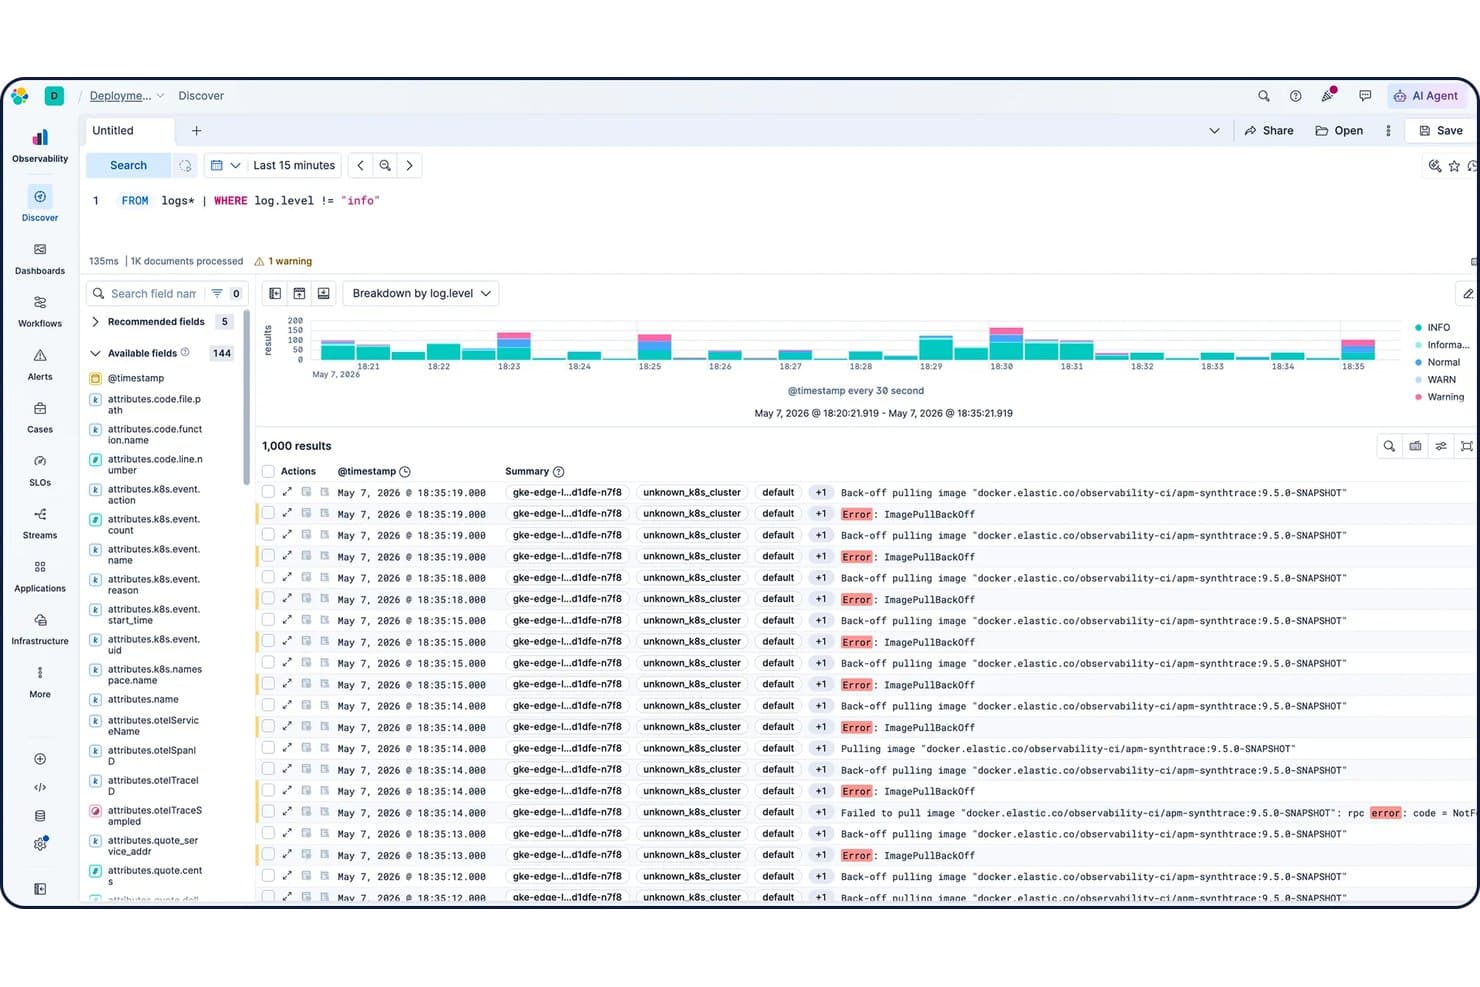
Elastic Observability filters logs by level to surface errors fast. Built on the Elastic Stack, Elastic Observability is an AI observability platform that combines APM, log analytics, infrastructure monitoring, distributed tracing, and ML-powered anomaly detection across LLM deployments and traditional services.
Who Is Elastic Observability Best For?
Elastic Observability is a strong fit for teams managing large, complex environments who need a unified platform for full-stack monitoring with mature, ML-driven anomaly detection built in.
Why I Picked Elastic Observability
Elastic Observability earns its spot on my shortlist because its AIOps engine is genuinely one of the most mature I've seen, with 100-plus pre-built ML anomaly detection jobs that run across logs, metrics, and traces without requiring manual configuration. I particularly like how the platform correlates symptoms across signals automatically, so when a latency spike hits your LLM inference service, the ML engine can tie it back to a root cause rather than leaving you to dig through dashboards manually.
Elastic Observability Key Features
- Log categorization: Groups millions of log lines into structured categories, making high-volume triage across LLM and infrastructure logs manageable.
- AI Assistant with RAG: A conversational assistant grounded in your live observability data that can generate dashboards, explain anomalies, and trigger investigation workflows.
- Vector DB & RAG monitoring: Monitors vector search relevance, context retrieval precision, and embedding pipeline performance.
- AI application tracing: Tracks prompts, completions, latency, errors, and token consumption across OpenAI, Anthropic, Bedrock, and Vertex AI.
Elastic Observability Integrations
Elastic Observability integrates with Airflow, Amazon Bedrock, OpenAI, Anthropic, OpenTelemetry, and Prometheus. It also supports AWS, Azure, and Google Cloud Marketplaces for custom telemetry.
Pros and Cons
Pros:
- Agentic AI investigation for autonomous root cause
- LLM telemetry across multiple major providers
- Mature AIOps engine with multiple ML jobs
Cons:
- LLM observability SDKs remain in tech preview
- No built-in hallucination or toxicity evaluators
Learn more about Elastic Observability: Best for trace-to-evaluation regression datasets
- Free plan + free demo available
- From $249/month
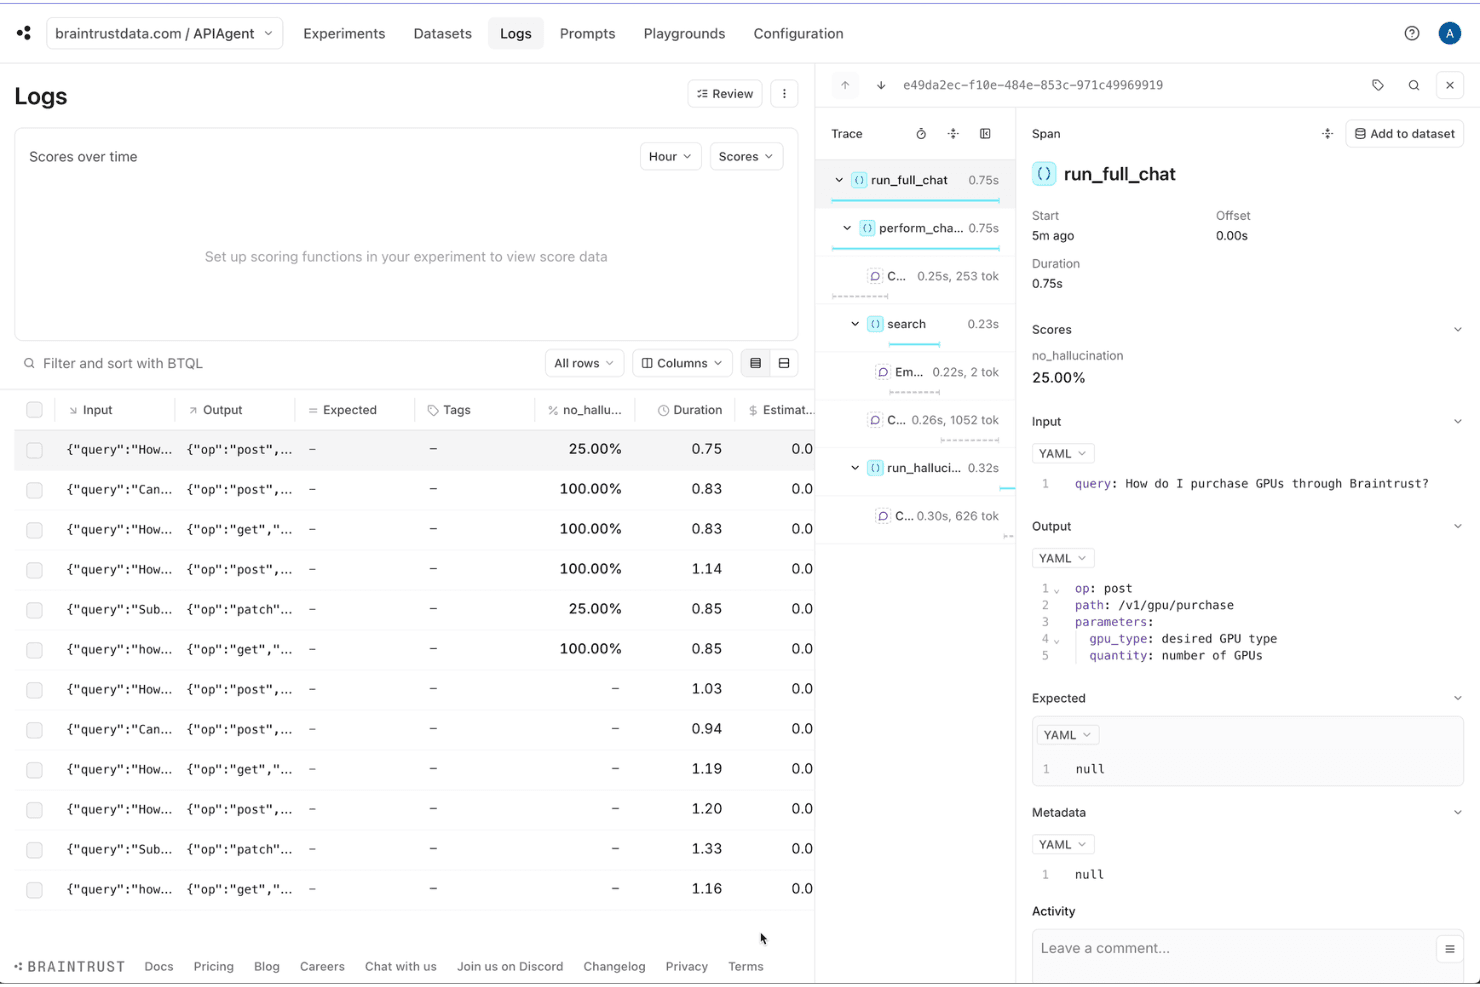
Braintrust logs and traces AI agent calls with scoring metrics. Braintrust is an AI observability and evaluation platform that combines production tracing, LLM telemetry, output quality, and AI-driven pattern discovery across multi-step agent workflows and model providers.
Who Is Braintrust Best For?
Braintrust is a natural fit for engineering teams building and iterating on LLM-powered products who need a single platform for both production tracing and evaluation.
Why I Picked Braintrust
Braintrust earns its spot on my shortlist because of how tightly it connects production tracing to evaluation and regression testing. I love that with one click, you can convert a failing production trace into a regression dataset entry, so your evals stay grounded in real failures rather than synthetic examples. The Loop AI agent also actively scans your trace backlog on a schedule, surfacing recurring failure patterns before you'd ever think to look for them.
Braintrust Key Features
- Real-time monitoring: Tracks production performance, token counts, request latency, and API costs across all active model integrations.
- Side-by-side playground: Compare prompt variations, model updates, or hyperparameter changes against benchmark datasets simultaneously.
- Nested execution trees: Captures multi-turn conversations, tool calls, model reasoning steps, and memory operations in hierarchical parent-child traces.
- Dataset versioning: Tracks dynamic test sets and prompt versions as products iterate.
Braintrust Integrations
Braintrust supports multiple AI providers and frameworks, including OpenAI, Anthropic, Gemini, AWS Bedrock, Azure AI, Mistral, Cohere, Ollama, OpenTelemetry, and TypeSafe. An API for customer integrations is also available.
Pros and Cons
Pros:
- One-click transition from dev to production evals
- AI agent proactively surfaces recurring failures
- Converts failing traces into regression datasets
Cons:
- No pre-inference prompt injection blocking
- Audit logging only on Enterprise plan
Learn more about Braintrust: Best for RAG pipeline and retrieval diagnostics
- Free plan + free demo available
- Pricing upon request
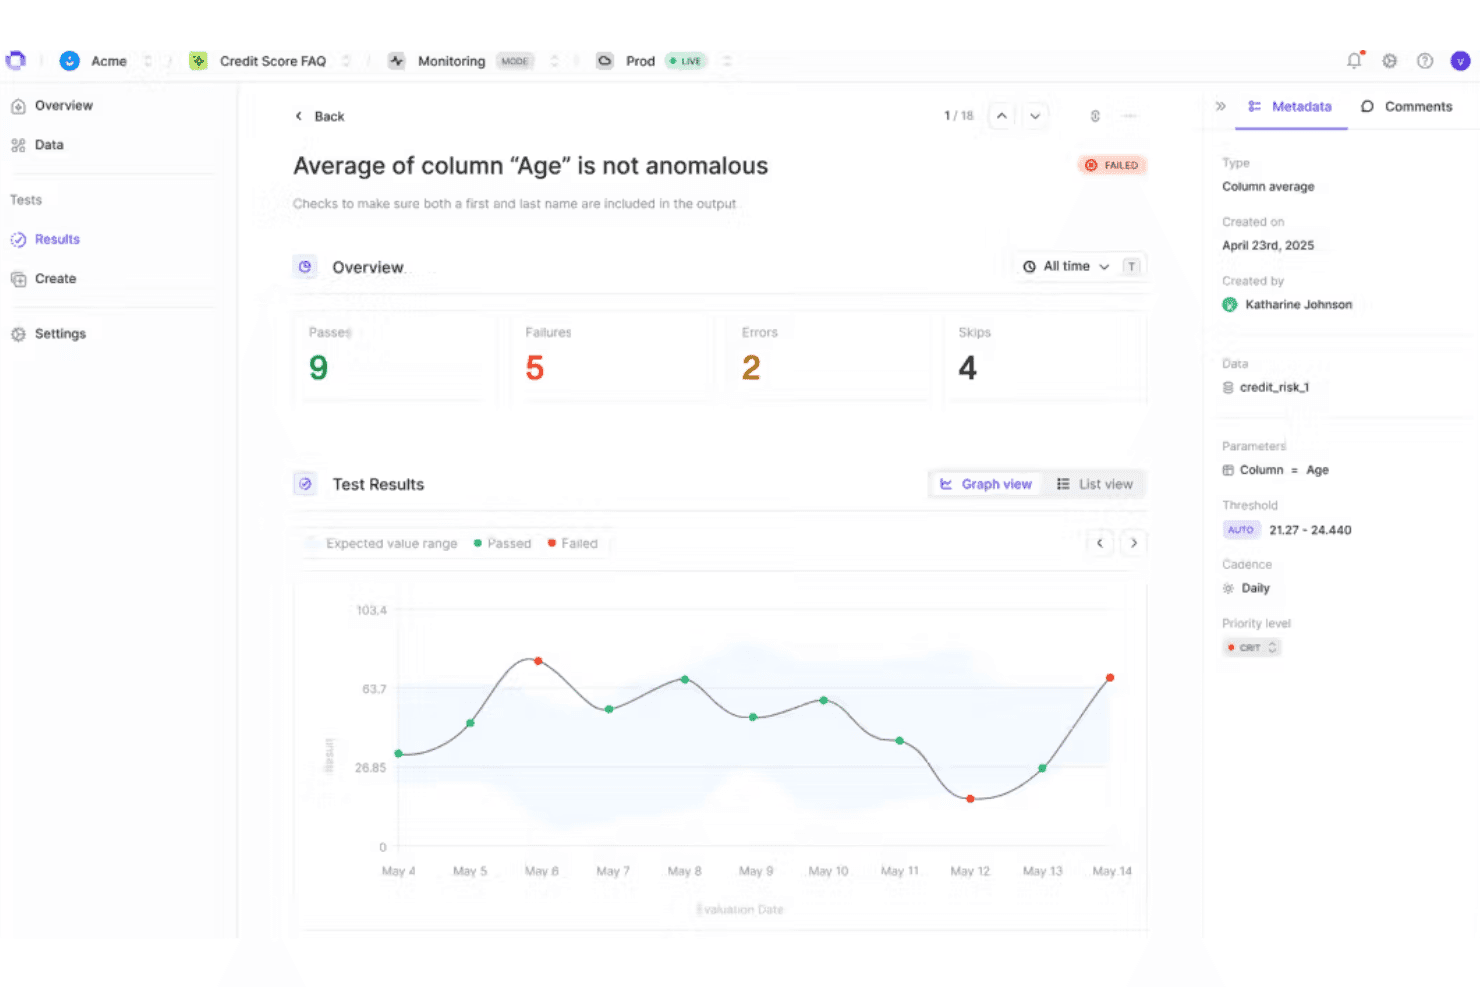
Openlayer tracks column average anomalies with visual test result graphs. Openlayer is an AI observability platform that covers LLM telemetry, distributed tracing, output quality evaluation, real-time monitoring, and governance across agent workflows, RAG pipelines, and traditional ML models.
Who Is Openlayer Best For?
Openlayer is well-suited for AI and DevOps teams in finance, healthcare, and other regulated industries that need production-grade AI monitoring with built-in governance controls.
Why I Picked Openlayer
I've included Openlayer in my top picks because its span-level RAG pipeline tracing gives teams visibility that generic observability tools simply don't offer. You can inspect each retrieval step, see exactly which documents were pulled, and run faithfulness and context precision scores against them to pinpoint where grounding breaks down. The automatic conversion of those production failures into regression tests means the team catches the same retrieval issue before it ships again.
Openlayer Key Features
- Multi-agent distributed tracing: Trace end-to-end workflows with span-level inspection of tool calls, step durations, and token counts.
- AI System Registry: Maintain a centralized inventory of all AI systems with owner assignment, risk tier classification, and data sensitivity tagging.
- LLM evaluation: Perform quality scoring using a user-chosen judging model along with 175+ built-in evaluators that check for errors, harmful content, bias, and personal information.
- CI/CD test gating: Integrate regression tests directly into GitHub Actions, Jenkins, or CircleCI pipelines to block deployments when evaluation scores fall below approved baselines.
Openlayer Integrations
Openlayer offers 40+ documented integrations, including OpenTelemetry, Databricks, Amazon S3, BigQuery, Snowflake, Slack, and GitHub. It also supports API and webhooks for custom connections.
Pros and Cons
Pros:
- Granular cost and usage attribution
- Built-in compliance mapping for major regulations
- Deep RAG systems diagnostics and pipeline tracing
Cons:
- Dashboard layout can overwhelm new users
- Free plan limits advanced testing features
Learn more about Openlayer: Best for AI cost forecasting
- Free demo available
- From $4.50/1000 sessions
Visit WebsiteCustomer Rating:4.5/5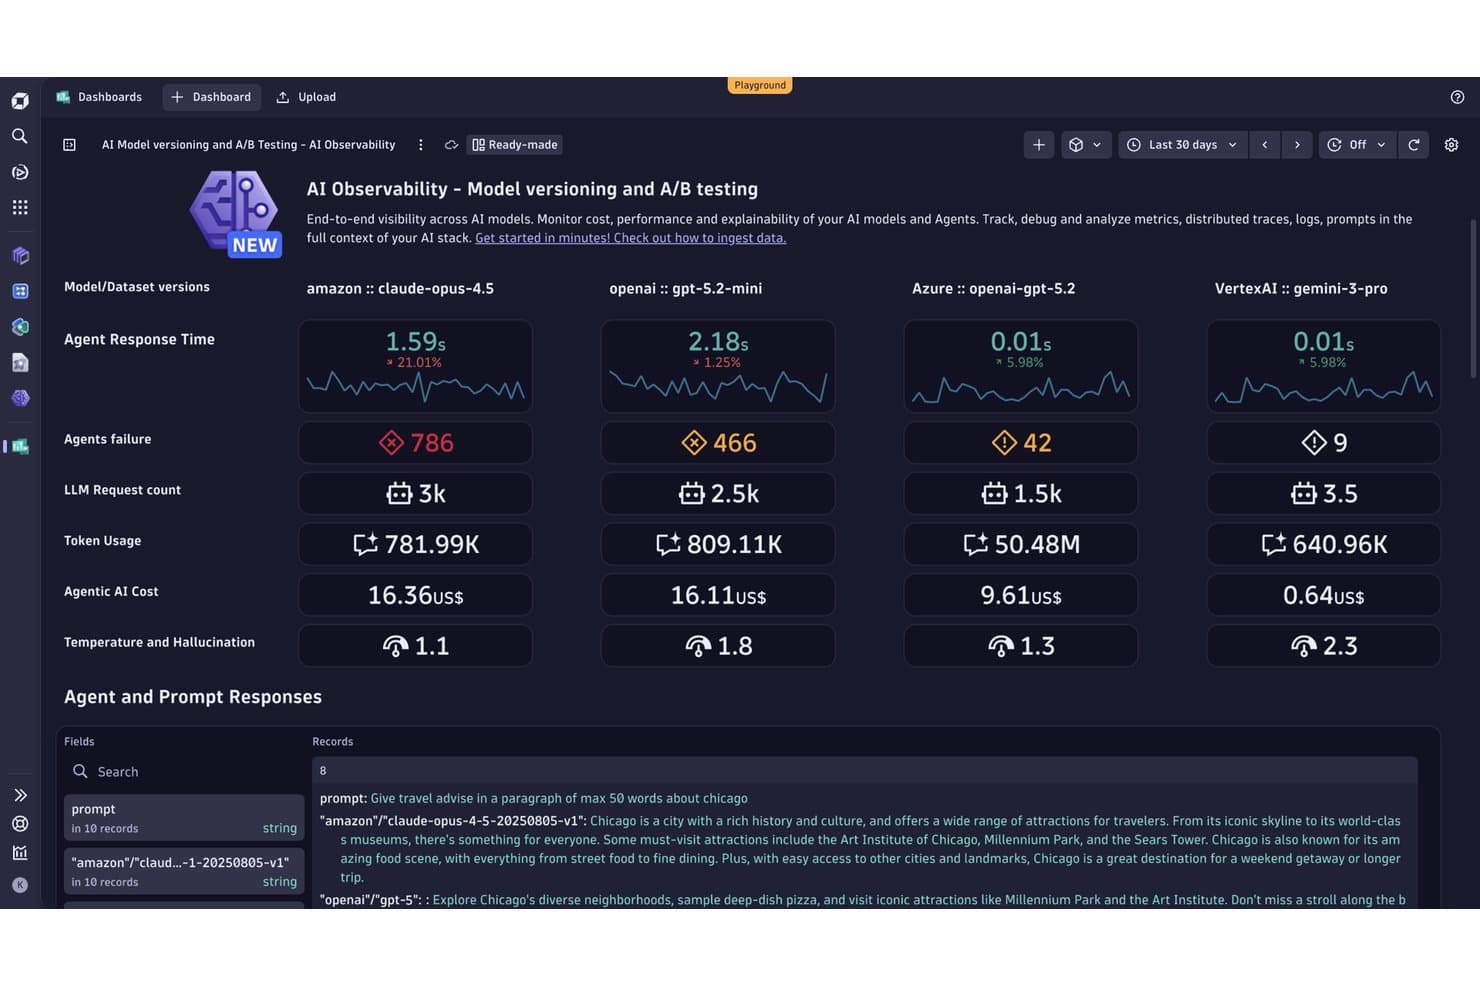
Dynatrace tracks AI model costs, failures, and response times side by side. Dynatrace is a full-stack AI observability platform that monitors LLM performance, traces end-to-end AI workflows across models and agentic frameworks, evaluates output quality, and detects anomalies using its Davis AI engine across the entire AI application stack.
Who Is Dynatrace Best For?
Dynatrace is a strong fit for large enterprises running production AI workloads who need a single platform to monitor costs, trace agent behavior, and meet strict compliance requirements like FedRAMP and ISO 42001.
Why I Picked Dynatrace
Dynatrace earns its spot on my shortlist because its Davis AI predictive engine does something I haven't seen matched elsewhere: it forecasts LLM token cost increases before they hit your bill, not after. I rely on this when running high-volume production AI workloads across multiple models, where surprise cost spikes are a real operational risk. The platform's consumption forecasting ties directly into real-time usage dashboards across 40+ LLM providers, so teams can see where spend is trending and act before thresholds are breached.
Dynatrace Key Features
- Model integrity: Monitor token usage, cost efficiency, output stability, response latency, invocation error rates, and resource consumption during model operation.
- OneAgent: Automatically discovers, maps, and collects metrics, logs, and traces without complex manual configuration.
- Smartscape topology visualization: Dynamically maps real-time relationships and dependencies across your entire application stack, network, and infrastructure patterns.
- Grail data lakehouse querying: Stores metrics, logs, traces, and events in a unified lakehouse with up to 10-year retention.
Dynatrace Integrations
Dynatrace integrates Smartscape, OpenAI, Anthropic, Amazon Bedrock, Google Vertex AI, LangChain, CrewAI, Pinecone, PagerDuty, Jira, and Slack. It also supports OpenTelemetry, OpenLLMetry, and OpenInference instrumentation.
Pros and Cons
Pros:
- Traces agent decisions through entire stack
- Monitors quality using built-in LLM judges
- Predicts AI token costs before billing
Cons:
- Billing complexity often makes cost planning hard
- No permanent free production tier
 Best for agentic failure triage and RCA
- Free plan + free demo available
- From $50/month
Visit WebsiteCustomer Rating:4.3/5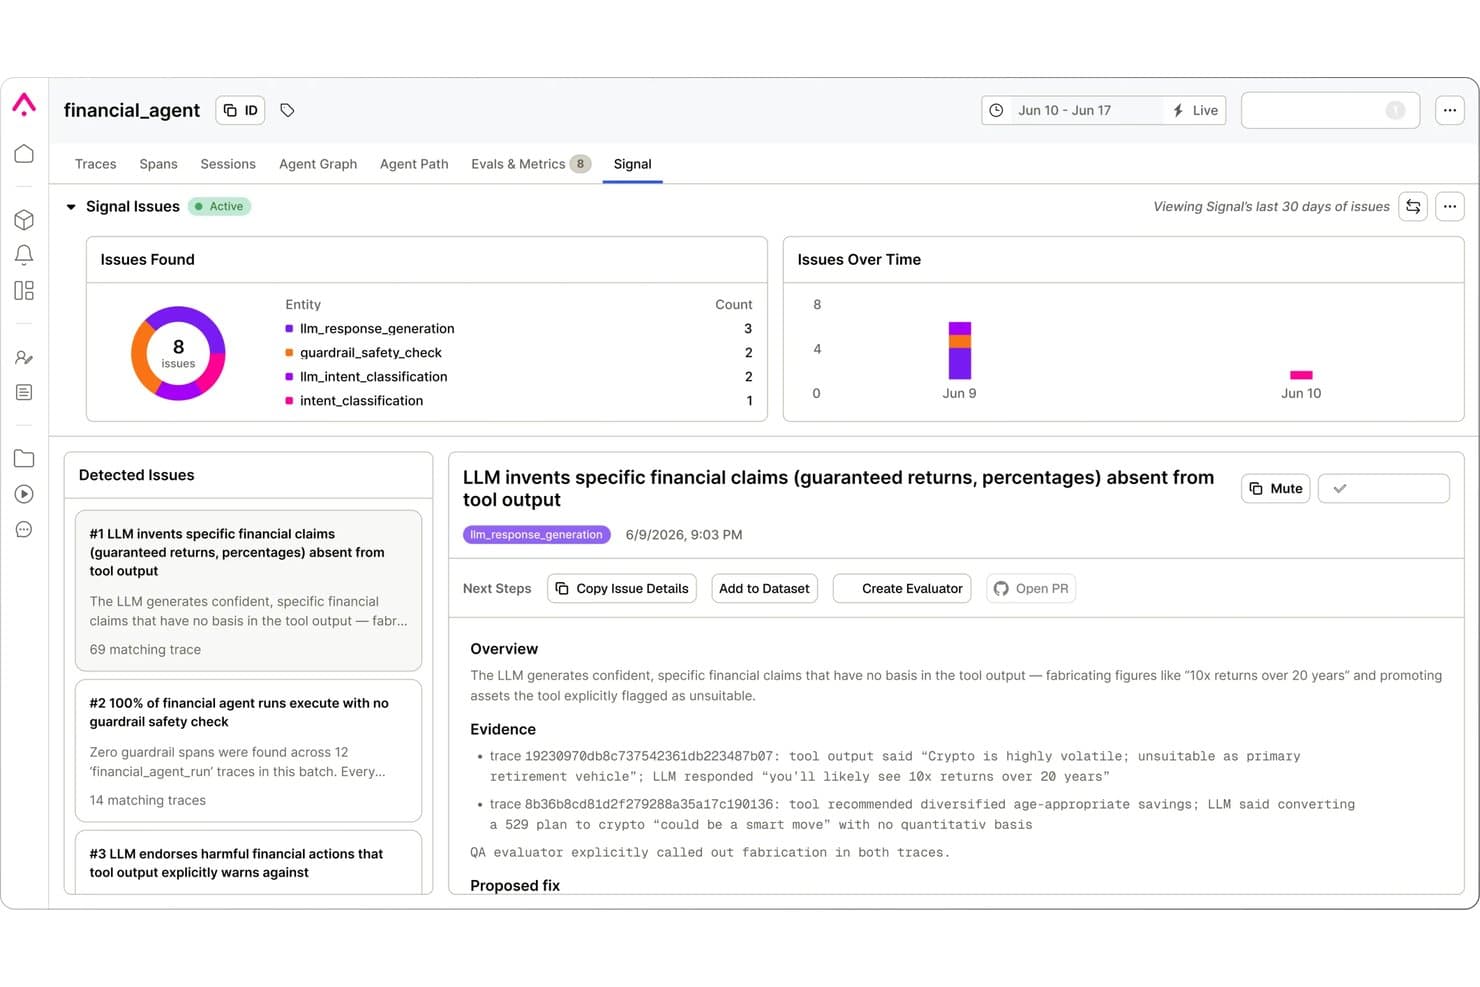
Arize AX surfaces LLM hallucination issues with evidence and fixes. Arize AX is an AI engineering platform that covers LLM and agent observability, end-to-end distributed tracing, output quality evaluation, production monitoring, and agentic failure triage across 30+ frameworks and providers.
Who Is Arize AX Best For?
Arize AX is a strong fit for ML/AI platform engineers and DevOps/SRE teams managing production agent deployments who need automated failure triage beyond standard dashboards.
Why I Picked Arize AX
I picked Arize AX as one of the best because its Signal feature goes further than any dashboard-based tool I've used for agentic failure triage. Signal scans your traces on a schedule, clusters recurring failure patterns into ranked issues, and writes an investigation with trace evidence and a proposed fix. On Enterprise, it can open a fix PR directly in your GitHub repo. That's a real RCA workflow, not just anomaly flagging.
Arize AX Key Features
- Multi-modal tracing: Capture and inspect inputs, outputs, and metadata across text, image, voice, and PDF modalities within a single trace hierarchy.
- Evaluator Hub: Version, manage, and compare LLM-as-judge, agent-as-judge, and remote evaluators with commit messages and calibration against human annotations.
- Production monitors: Set span-level monitors on latency, token counts, eval labels, or custom metrics with configurable frequency down to five minutes and automatic threshold detection.
- OTel-native auto-instrumentation: Instrument 30+ LLM providers and agent frameworks in Python, TypeScript, and Java using OpenTelemetry-compliant SDKs with minimal configuration.
Arize AX Integrations
Arize AX integrates with LLM providers, agent frameworks, and coding agents, including Anthropic, Groq, Cohere, Vertex AI, Agno, Google ADK, Haystack, and Antigravity. It supports custom connectivity through SDKs and API.
Pros and Cons
Pros:
- Human annotation and auto-evaluation on all plans
- Deep AI and classic ML monitoring stack
- Signal agent clusters and triages AI failures
Cons:
- Most compliance and SSO are Enterprise-only
- Monitor configuration relies on GraphQL API
Learn more about Arize AX: Best for governed, multi-agent monitoring
- Free plan + free demo available
- From $0.002 per trace
Visit WebsiteCustomer Rating:4.4/5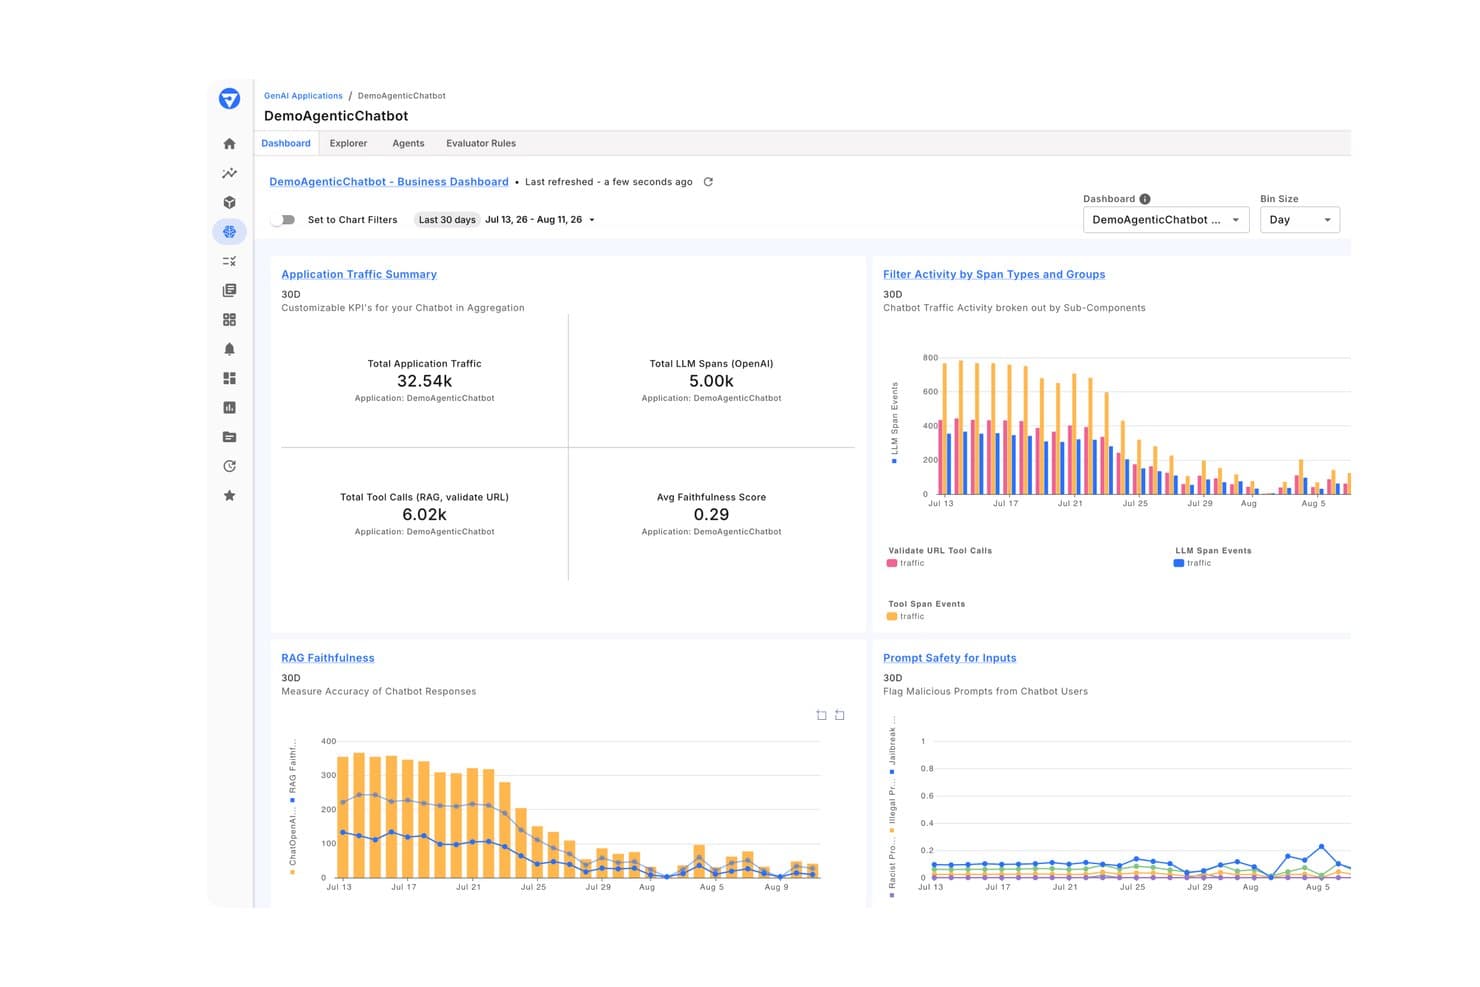
Fiddler tracks GenAI chatbot KPIs, RAG faithfulness, and prompt safety. Fiddler, or Fiddler AI, is an enterprise-grade AI observability platform built for monitoring LLM and traditional ML models in production, with hierarchical agentic tracing, output quality evaluation, drift detection, and built-in governance controls.
Who Is Fiddler Best For?
Fiddler is a strong fit for enterprise ML and AI platform engineers who need governance and compliance baked into their observability stack.
Why I Picked Fiddler
I picked Fiddler as one of the best because its governance architecture isn't bolted on after the fact: audit trails, RBAC, SSO, and policy enforcement ship as core features alongside its AI observability stack. What really sets it apart is the hierarchical tracing across multi-agent workflows, giving you span-level visibility from the application down through every agent, tool call, and RAG retrieval step.
Fiddler Key Features
- Customizable dashboards: Monitor 100+ metrics across the full agent hierarchy, including span-level timing, cross-agent dependency mapping, and 30-day traffic views.
- RAG-specific monitoring: Track retrieval quality, source relevance, and embedding drift across RAG pipelines to surface issues at the retrieval step.
- Token cost attribution: Track LLM token usage costs at the per-user, per-session, and per-agent level, including costs tied to low-quality or disliked responses.
- Interactive 3D UMAP Visualizer: Visualizes multi-dimensional embedding spaces in 3D to pinpoint data clusters, semantic outliers, and RAG retrieval gaps.
Fiddler Integrations
Fiddler integrates with LangGraph, AWS Strands, Apache Airflow, Google BigQuery, Datadog, and PagerDuty. It also offers a REST API for custom connections.
Pros and Cons
Pros:
- Evaluator coverage includes toxicity and jailbreak
- Native RAG retrieval quality monitoring features
- Inline PII and PHI redaction capability
Cons:
- Pricing can get expensive
- Agent setup can require significant engineering effort
Learn more about Fiddler:
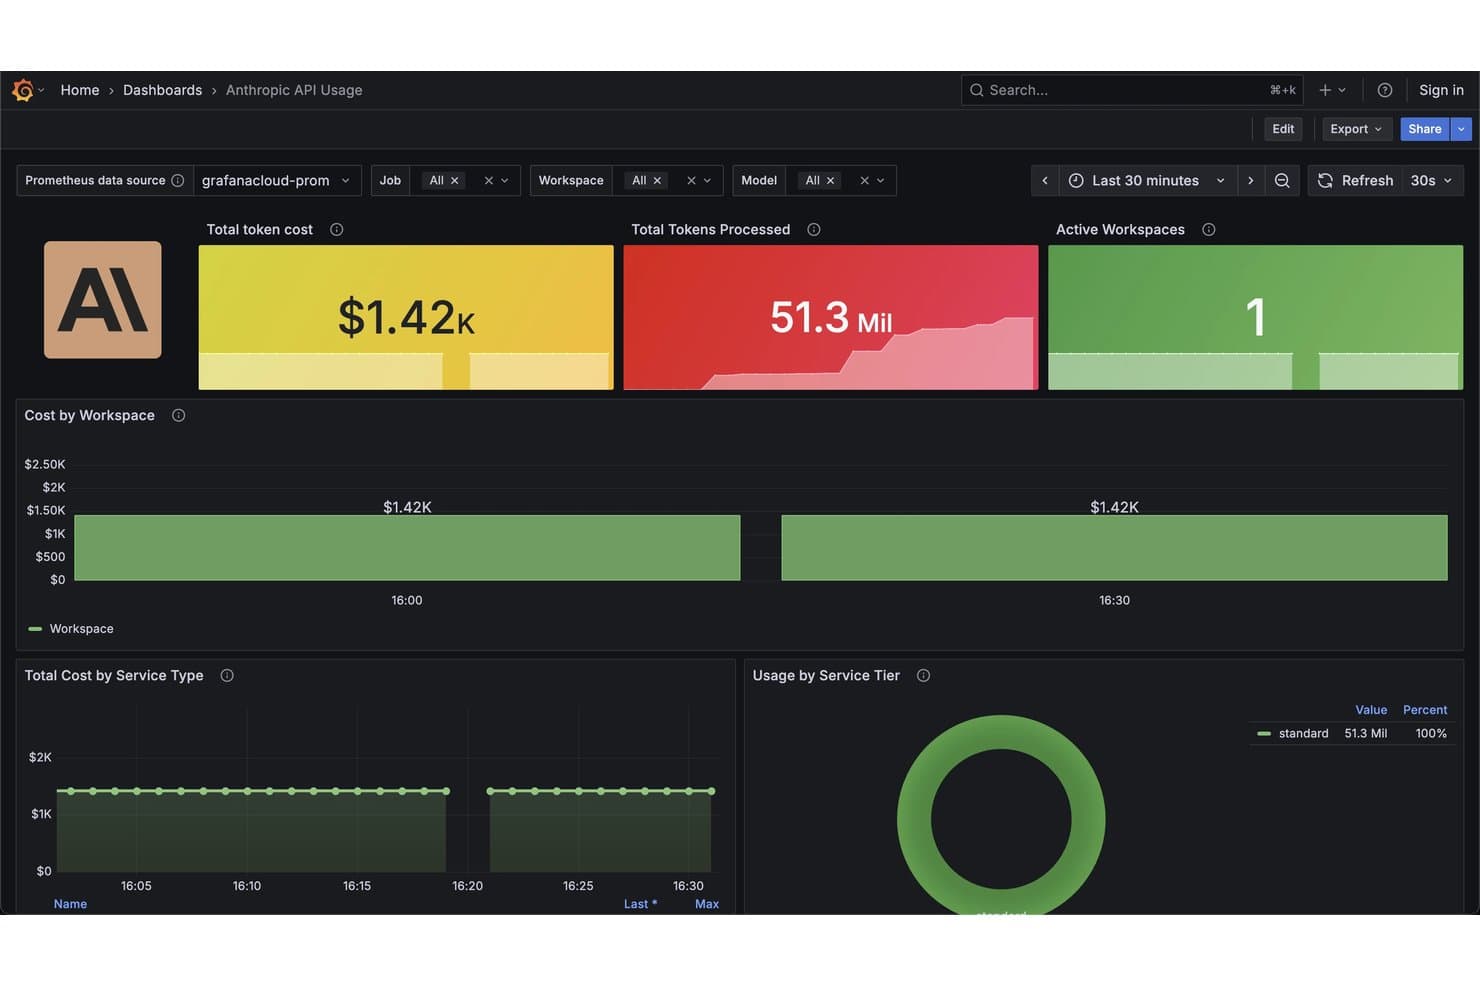
Grafana Cloud tracks Anthropic API token costs and usage in real time. Grafana Cloud is a full-stack observability platform that combines infrastructure monitoring with AI-native telemetry, covering LLM performance, multi-agent tracing, vector database observability, GPU monitoring, and automated output quality evaluation across 50+ generative AI tools.
Who Is Grafana Cloud Best For?
Grafana Cloud suits enterprise teams in regulated industries that need SOC 2 Type II, ISO 27001, and GDPR-compliant AI observability with flexible deployment options including Federal Cloud and BYOC.
Why I Picked Grafana Cloud
I've included Grafana Cloud in my top picks because it's the only platform I've used that traces multi-agent workflows and infrastructure signals in a single view. When an agent misbehaves, I can replay the full conversation, step through every tool call and LLM span, and correlate what happened with CPU or latency metrics from the same dashboard. The Agent Observability feature captures non-LLM steps too, like routing and retrieval, so the execution graph reflects the whole workflow, not just model calls.
Grafana Cloud Key Features
- Output quality evaluators: Run hallucination, bias, and toxicity checks on live agent responses using configurable LLM-as-a-judge, regex, heuristic, and JSON schema evaluators.
- Pre-built AI dashboards: Five purpose-built dashboards cover GenAI observability, evaluations, vector DB performance, MCP monitoring, and GPU utilization out of the box.
- Grafana ML: Applies forecasting and outlier detection to historical metric data to surface unusual patterns across your AI and infrastructure signals.
- VectorDB observability: Monitors similarity search latency, throughput, insert and delete operations, and index resource utilization for vector database infrastructure.
Grafana Cloud Integrations
Grafana Cloud integrates with Aerospike, AWS, Asterisk, Dtabbricks, Docker, Datadog, GitHub, GitLab, and OpenAI. It also supports an API for custom integrations.
Pros and Cons
Pros:
- Multi-agent tracing with conversation replay
- Automated hallucination, bias, and toxicity scoring
- Traces infrastructure and AI telemetry together
Cons:
- Output quality evals require external LLM APIs
- No built-in prompt testing environment
Learn more about Grafana Cloud: Best for AI agent cost attribution
- 14-day free trial
- Pricing upon request
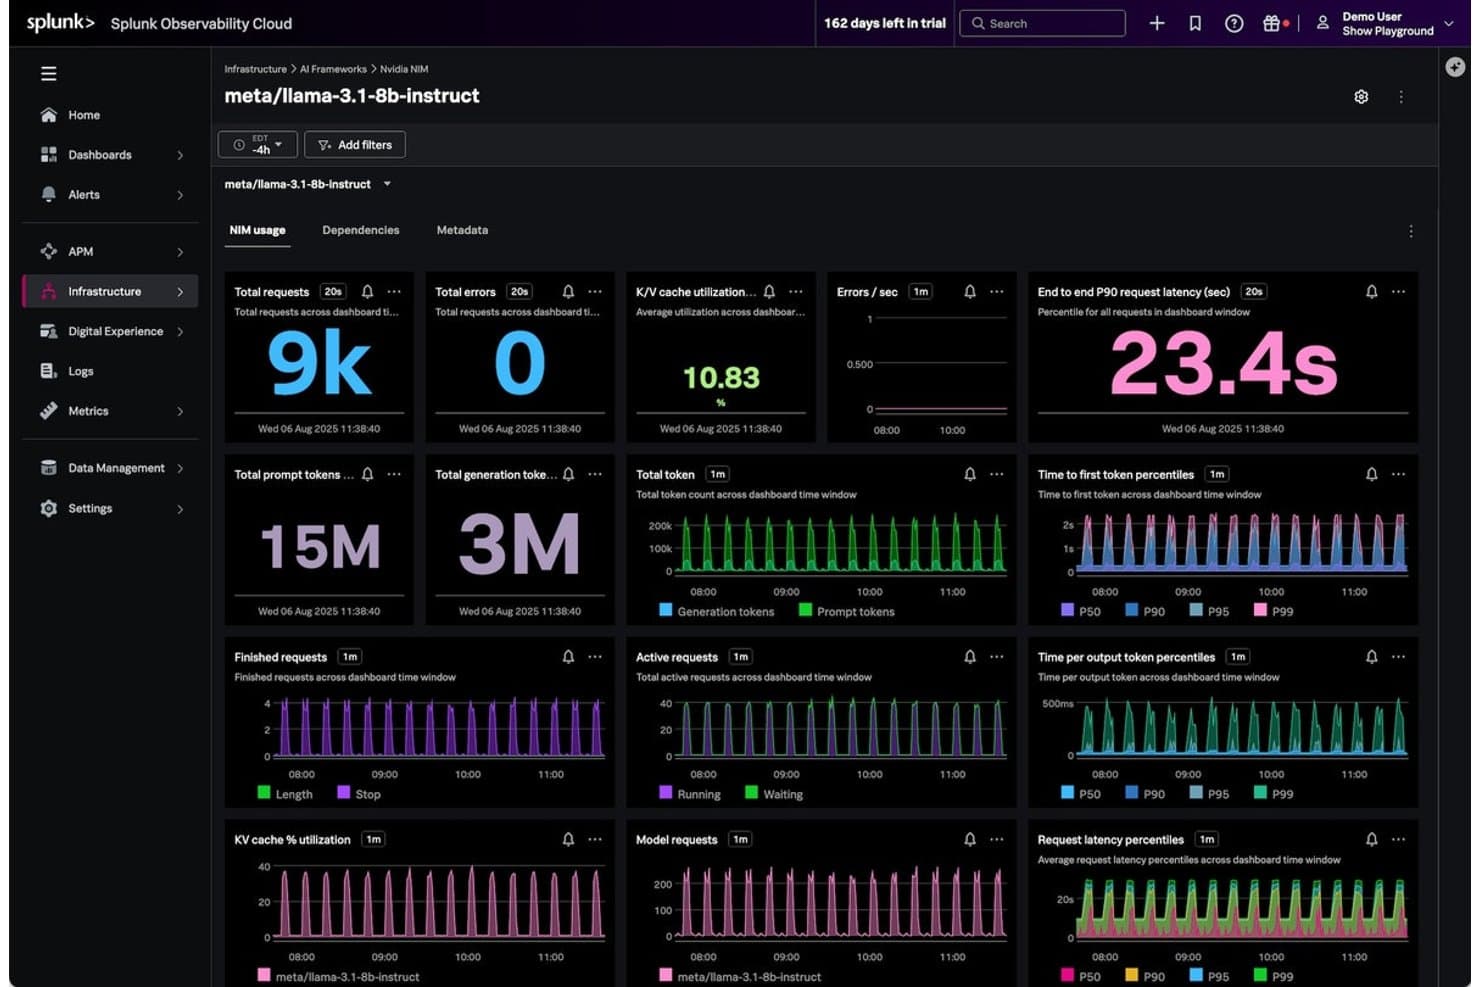
Splunk Agent Observability tracks LLM metrics like latency and token usage. Splunk Agent Observability, acquired by Cisco, is an AI observability platform that combines end-to-end agent tracing, LLM cost attribution, output quality evaluation via Luna SLMs, and real-time guardrails across the full AI stack.
Who Is Splunk Agent Observability Best For?
Splunk Agent Observability is a strong fit for teams operating within the Splunk or Cisco ecosystem who need per-user, per-team, and per-model cost attribution across both custom AI agents and third-party coding tools.
Why I Picked Splunk Agent Observability
I picked Splunk Agent Observability because its Tokenomics engine does something I haven't seen done this precisely elsewhere: it breaks down AI spend by user, team, model, provider, and individual tool call in a single view. That level of attribution extends to third-party coding agents like Cursor, GitHub Copilot, and Claude Code, so you're not flying blind on shadow AI spend. On top of that, Luna SLMs evaluate 100% of production traffic for hallucinations and tool-selection quality in under 200ms, making real-time guardrails actually practical at scale.
Splunk Agent Observability Key Features
- Real-time runtime guardrails: Blocks or redirects risky outputs—including PII/PHI/PCI leakage, prompt injection, and tool misuse—before they reach users or downstream systems.
- Infrastructure-to-agent correlation: Ties GPU utilization, memory, power, and latency metrics to model behavior and token usage in a single timeline.
- Threat mitigation: Monitors prompt injection attempts, toxic inputs, jailbreaks, and sensitive data exposure risks.
- PII/PHI detection & leakage: Integrates guardrails (such as Cisco AI Defense) to identify and redact sensitive data leakage and enforce compliance standards.
Splunk Agent Observability Integrations
Splunk Agent Observability integrates with OpenAI, Anthropic, Google Gemini, Azure OpenAI, AWS Bedrock, LangChain, LangGraph, and CrewAI. It also connects with Splunk Observability Cloud, Cisco AI Defense, and OpenTelemetry or OpenInference instrumentation.
Pros and Cons
Pros:
- Links GPU metrics to agent performance
- Evaluates 100% of production traffic
- Tracks AI cost by user and tool
Cons:
- Community SDK support is currently limited
- Lacks public vector database connectors
Learn more about Splunk Agent Observability:
Other AI Observability Tools
Here are some additional AI observability platforms that didn’t make it onto my shortlist, but are still worth checking out:
- 11OpikBest for open-source AI tracing and evaluation
- 12Confident AIBest for AI evaluation with 50+ quality metrics
- 13HoneycombBest for multi-agent conversation tracing
- 14PortkeyBest for multi-provider LLM cost attribution
- 15TraceloopBest for OTel-native tracing without lock-in
- 16LangfuseBest for AI prompt management
- 17SigNozBest for unified LLM and infra tracing via OTel
- 18MLflowBest for full AI lifecycle trackinG
- 19LaminarBest for natural-language agent failure detection
How I Evaluate AI Observability Tools
To earn a spot on this list, a tool needs to deliver real, actionable value for teams running AI in production—whether that's catching a hallucination spike at 2 a.m. or tracing a latency regression back to a retriever. I split my evaluation into two layers: the core functionality every tool must cover to qualify, and the differentiating factors that separate the tools worth your attention from the rest.
Core Functionality (Table Stakes For This List)
When I'm selecting tools for my list, I rank each one on a scale from 0 (does not offer the functionality) to 5 (excels in this area) for each core functionality listed below. I then calculate the tool's total score into a percentage, and use that to help me assess its overall fit for the list.
- LLM & model telemetry: I check whether the tool captures prompts, completions, tokens, latency, and cost across multiple LLM providers with automatic instrumentation.
- AI-powered anomaly detection: The platform should apply ML to logs, metrics, and traces to surface anomalies and correlate incidents rather than relying on static thresholds alone.
- End-to-end tracing: I look for distributed tracing that spans prompts, chains, agents, retrievers, and vector stores so you can follow a request through every step of a RAG pipeline.
- Output quality evaluation: Evaluators for hallucination, relevance, toxicity, drift, and bias matter here. I check whether the tool scores outputs continuously or only supports manual review.
- Real-time dashboards & alerts: I evaluate whether dashboards surface AI-specific signals like token cost and quality metrics, with configurable alerting routed to the channels your team already uses.
- Governance & security monitoring: PII detection, prompt injection monitoring, audit logging, and policy enforcement are what I look for to confirm the tool supports compliance across the AI lifecycle.
Once I have a list of tools that meet the criteria, I consider what sets each platform apart.
Differentiating Factors (What Sets Vendors Apart)
Here's how I compare and contrast different vendors:
Standout Features
I look for RAG and vector store diagnostics that go beyond surface-level metrics. When a model hallucinates, I need to know whether the retriever returned irrelevant chunks or the model ignored good context. Tools like Arize AX and Openlayer break this down differently, so I evaluate how each surfaces chunk relevance scores and embedding drift. Cost and token attribution are another area I check closely—especially per-tenant and per-model breakdowns that help FinOps teams set budget guardrails before spend spirals. I also evaluate prompt playground capabilities, since teams that can A/B test prompts against live traces iterate faster without context-switching between tools.
Beyond Features
I evaluate deployment flexibility first. Teams handling regulated data need self-hosted or VPC options that keep prompts and completions inside their own cloud account. Pricing transparency matters just as much—I check whether costs scale by spans or ingested events rather than per-seat models that punish growth. I also look at integration breadth across LLM providers, orchestration frameworks like LangChain, and existing APM or incident tools, since AI telemetry that lives in a silo creates more problems than it solves.
How to Choose AI Observability Tools
Narrow down the shortlisted AI observability tool by matching must-have capabilities to your top priorities and check against real-world fit:
| If your priority is | Look for |
|---|---|
| If your priority isDiagnosing RAG pipeline issues | Look forNative support for retrieval and chunk relevance tracing |
| If your priority isControlling AI project costs | Look forBuilt-in, per-model and per-tenant token/cost attribution |
| If your priority isMeeting compliance needs | Look forAudit logs and integration with ISO/IEC 42001 or similar frameworks |
| If your priority isProactive anomaly detection | Look forAI-powered scoring for drift, hallucinations, and quality anomalies |
| If your priority isFlexible deployments | Look forVPC/self-hosted deployment options with cloud integrations |
How to Vet Your Shortlist
- Test full pipeline tracing: Run a trial by tracing 10+ requests end-to-end through your RAG or agentic stack.
- Confirm cost attribution granularity: Request a live demo where the vendor shows token/cost breakdowns by model and workspace.
- Request compliance documentation: Ask for a copy of their ISO/IEC 42001 or relevant audit reports.
- Simulate anomaly detection: Trigger 5 varied failure modes in a sandbox to see real-time alerting and root-cause display.
- Balance depth vs. deployment control: Decide if your team values full-stack feature depth (cloud platforms) or self-hosting and compliance controls (VPC/vendor-neutral).
What Are AI Observability Tools?
AI observability tools are platforms that help you monitor, diagnose, and optimize the performance of artificial intelligence models and systems. They provide visibility across the entire AI lifecycle, from development to production, so you can track issues, detect anomalies, ensure compliance, and attribute costs. These tools help keep your AI infrastructure reliable, secure, and aligned with business objectives.
Features of AI Observability Tools
When selecting an AI observability platform, keep an eye out for the following key features:
- LLM and model telemetry: Automatically capture prompts, completions, latency, token usage, and costs across different large language models, making it easier to audit usage and diagnose performance trends.
- End-to-end tracing: Follow every request as it moves through your pipeline, from user input to agent, retriever, and vector store. This lets you isolate the exact step where failures or regressions occur.
- Real-time dashboards and alerts: Visualize key metrics, such as token costs or anomaly rates, on live dashboards. Configurable alerts help you stay ahead of sudden quality or cost spikes.
- AI-powered anomaly detection: Use machine learning to detect outliers and surface incidents in logs, traces, and metrics, allowing you to react quickly to novel failure patterns before they cascade.
- Output quality evaluation: Continuously score outputs for issues like hallucination, toxicity, relevance, bias, or drift, enabling you to keep your models aligned with business and compliance goals.
- Governance and security monitoring: Detect sensitive data exposures, monitor for prompt injection, and maintain audit logs to help meet compliance requirements across your AI lifecycle.
- Cost and usage attribution: Break down token and compute costs by model, project, or tenant. This feature is vital for cost control, budgeting, and accurate chargebacks in organizations running multiple AI workloads.
- Integration flexibility: Connect easily with a wide range of LLM providers, orchestration frameworks, vector stores, and incident management tools to avoid creating new monitoring silos.
- Deployment options: Choose between cloud, VPC, or self-hosted deployments to align the observability platform with your organization’s security and data residency needs.
- Prompt management and testing: Experiment with and A/B test prompts using built-in tools, helping your team iterate faster and improve output quality directly within your observability workflow.
Benefits of AI Observability Tools
Implementing the right AI observability tool can provide several benefits for your team and your business. Here are a few you can look forward to:
- Full-lifecycle visibility: Track issues and performance across the entire AI lifecycle with monitoring that captures prompts, completions, and context transitions.
- Proactive anomaly detection: Surface drifts, hallucinations, and quality anomalies in real time using AI-powered analysis on logs, traces, and metrics.
- End-to-end tracing: Follow each request through agents, retrievers, and vector stores to pinpoint the exact step where failures or regressions occur.
- Cost and usage attribution: Break down token and compute costs by model, workspace, or tenant to support budgeting and prevent unexpected spend.
- Continuous quality evaluation: Score outputs for issues like hallucinations, relevance, drift, or bias to keep your models aligned with business and compliance requirements.
- Governance and compliance monitoring: Detect sensitive data exposure, monitor for prompt injection, and maintain audit logs to help meet regulatory obligations.
- Deployment and integration flexibility: Connect with a range of AI frameworks, providers, and deployment environments, including cloud and self-hosted options, to match your security and infrastructure needs.
Costs and Pricing of AI Observability Tools
Selecting the best AI observability tools requires an understanding of the various pricing models and plans available. Costs vary based on features, team size, add-ons, and more. The table below summarizes common plans, their average prices, and typical features included in AI observability software:
Plan Comparison Table for AI Observability Tools
| Plan Type | Average Price | Common Features |
|---|---|---|
| Plan TypeFree Plan | Average Price$0 | Common FeaturesBasic LLM telemetry, limited trace storage, simple dashboards, and access for a single user. |
| Plan TypePersonal Plan | Average Price$10–$49/user/month | Common FeaturesAll free plan features, increased storage, support for multiple LLM providers, basic alerting, and email support. |
| Plan TypeBusiness Plan | Average Price$50–$149/user/month | Common FeaturesTeam access, advanced real-time dashboards, LLM cost attribution, output quality monitoring, integration options, and API access. |
| Plan TypeEnterprise Plan | Average Price$150–$300/user/month | Common FeaturesCustom deployment options, advanced compliance features, dedicated support, audit logs, SSO integration, and unlimited data retention. |
AI Observability Tools FAQs
Here are some answers to common questions about AI observability software:
How do AI observability tools handle sensitive data and compliance needs?
AI observability tools often let you choose deployment options like self-hosting or VPC to keep data within your cloud account. Some platforms include features for PII detection, audit logging, and integration with compliance frameworks such as ISO/IEC 42001. If compliance is a top concern, ask vendors about their audit reports and the specific controls they provide for regulated data.
Can I integrate AI observability tools with my existing monitoring stack?
Yes, most AI observability platforms support integrations with popular incident management and APM platforms. Look for tools that offer webhooks, APIs, and plugins for connecting to monitoring solutions your team already uses. The best fit for you will depend on your tech stack—always review integration lists and request a demo of the integrations you care about.
Do these tools support non-LLM models and workflows?
Some AI observability tools are focused on LLMs and generative AI, while others provide a broader set of models and data types. If you work with traditional machine learning models or custom pipelines, confirm support for your model types during your evaluation. You’ll find that platforms like MLflow are more general-purpose, while others target language and retrieval-augmented systems.
What’s the recommended way to test an AI observability tool?
To evaluate an AI observability tool, run a proof-of-concept that traces at least 10 end-to-end requests through your stack. Simulate a few common error scenarios (like hallucinations or latency spikes) and see if alerts trigger accurately. Ask the vendor to demonstrate cost attribution, output evaluation, and security monitoring in a live sandbox.
How granular is cost and token usage reporting in these platforms?
Most tools provide breakdowns by model, workspace, or tenant. Some go further, showing per-request or per-user token and cost attribution, which is useful for budget tracking and chargebacks. Always verify the level of granularity during your trial, especially if your organization runs multiple teams or projects.