

O software de monitorização de infraestruturas ajuda a acompanhar o estado e o desempenho dos seus sistemas, quer esteja a gerir servidores, redes, aplicações ou máquinas virtuais.
Muitas equipas procuram estas ferramentas quando se deparam com pontos cegos na sua infraestrutura, têm dificuldade em detetar problemas atempadamente ou perdem tempo a gerir diferentes painéis. Escolher a ferramenta errada ou depender de uma ferramenta desatualizada pode resultar em alertas falhados, indisponibilidade ou visibilidade limitada.
Ajudei equipas a selecionar e configurar plataformas de monitorização que respondem às suas necessidades e tornam efetivamente a resolução de problemas mais fácil, não mais difícil. Este guia baseia-se nessa experiência prática, para que possa encontrar software que lhe proporcione clareza sem complicações.
Why Trust Our Software Recommendations
6,700+
Reviews
20
Industry experts
16+
Evaluation factors
14
Years
Our team has been testing and reviewing software since 2012. As tech leaders ourselves, we know how difficult—and important—it is to choose the right software.
For this guide, we evaluated tools using hands-on testing and independent research, scoring tools using our selection criteria.
Our reviews reflect our human editorial judgment, not a sales pitch.
Expert reviewers:
- Paulo Gardini MiguelTech Director
 Tim FisherVP of AI
 Gabriel RosasTech Lead & Software Architect
 Christhian GruhnTech Lead & Platform Architect

Tabela de comparação de ferramentas de monitorização
A tabela abaixo compara os detalhes de preços das minhas principais seleções de ferramentas de monitorização.
| Tool | Best For | Trial Info | Price | ||
|---|---|---|---|---|---|
| 1 | Best for monitoring IT, OT, and cloud | Free plan + 30-day free trial available | From $200/month (billed annually) | Website | |
| 2 | Best for real-time network visibility | 14-day free trial | Pricing upon request | Website | |
| 3 | Best for proactive issue detection | Free trial available | From $149/user/month (billed annually) | Website | |
| 4 | Best open-source solution | Free plan + 60-day trial + demo available | From $1,400/year (billed annually) | Website | |
| 5 | Best for real-time performance tracking | Free plan + 30-day trial available | From $395/year (billed annually) | Website | |
| 6 | Best for real-time application error tracking | Free plan + 14-day trial + free demo available | From $26/month (billed annually) | Website | |
| 7 | Best for integrated remote IT management | 30-day free trial available | Pricing upon request | Website | |
| 8 | Best for complete network management | 30-day free trial | From $1,233/year (billed annually) | Website | |
| 9 | Best for proactive monitoring | Free plan + 30-day trial + demo available | From $10/month | Website | |
| 10 | Best for AI-assisted anomaly detection | 15-day free trial | From $7/month | Website |


Análises das melhores ferramentas de monitorização
Apresento abaixo os meus resumos detalhados das melhores ferramentas de monitorização que entraram na minha lista restrita. As minhas análises oferecem uma visão detalhada das principais funcionalidades, vantagens \u0026 desvantagens, integrações e casos de utilização ideais de cada ferramenta, para o ajudar a encontrar a melhor opção para si.
 Best for monitoring IT, OT, and cloud
- Free plan + 30-day free trial available
- From $200/month (billed annually)
Visit WebsiteCustomer Rating:4.6/5
The device tree for network monitoring in PRTG showcases how devices are interconnected and provides detailed information about each device's status. PRTG Network Monitor is a comprehensive tool that helps you keep an eye on your entire IT infrastructure. It monitors systems, devices, traffic, and applications, providing real-time insights into your network's health. With PRTG, you can identify and address issues before they become critical.
Why I Picked PRTG: I chose PRTG for its ability to unify the monitoring of various technologies through integrated protocols like SNMP, WMI, SSH, and more. This means you can oversee a wide range of platforms, devices and systems within your network, ensuring all components are functioning properly. Additionally, PRTG offers customizable reporting, allowing you to generate detailed reports tailored to your needs. Another valuable aspect of PRTG is its real-time alerting system. You receive immediate notifications about potential issues, enabling you to respond promptly and minimize downtime. Most monitoring tools cover IT infrastructure, cloud, or industrial systems — rarely all three. PRTG brings servers, network devices, and cloud services together with modern OT equipment via Modbus and OPC UA, so teams overseeing a mix of standard IT and industrial environments aren't stuck stitching together separate tools.
Standout Features & Integrations:
Other key features include detailed statistics for applications running in your network, helping you manage resources effectively. Additionally, its distributed monitoring feature allows you to monitor multiple networks in different locations, all from a single interface. It also has real-time maps and dashboards that visualize your network's status, making it easier to identify and address issues. Integrations include AWS, Cisco, Dell Technologies, HPE, VMware, ServiceNow, Check Point, Sonicwall, NetApp, Fujitsu, Lansweeper, and Martello.
Pros and Cons
Pros:
- Supports multiple monitoring technologies
- Customizable dashboards and real-time alerts
- Provides a comprehensive overview of network infrastructure
Cons:
- Licensing based on sensors can become expensive for larger networks
- Initial setup can be time-consuming
Learn more about Paessler PRTG: Best for real-time network visibility
- 14-day free trial
- Pricing upon request
Visit WebsiteCustomer Rating:4.7/5
Auvik offers a detailed network monitoring dashboard. Auvik is a network management platform that enhances your network's visibility and performance. It offers monitoring tools to help you keep your network in check and running smoothly.
Why I Picked Auvik: One of the reasons I chose Auvik as a top monitoring tool is its ability to provide real-time device monitoring. This feature lets you keep a constant eye on your network's health, ensuring that you can catch and address issues as they arise. Another compelling feature is automated network mapping, which visually represents your network's layout and connections. This helps you understand how different devices interact, making it easier to manage and troubleshoot. Another feature that stands out is performance metrics tracking. With this, you can gather valuable data about your network's performance, allowing you to make informed decisions to optimize its functionality. The platform also offers customizable alerts that notify you of potential issues, so you can address them before they escalate.
Standout Features & Integrations:
Features include configuration backups that ensure you never lose critical settings, remote device management that allows you to control devices from anywhere, and global alert settings that provide consistent monitoring across your network. These features work together to provide a comprehensive solution for managing and monitoring your network.
Integrations include Cisco, Datto, Microsoft Intune, Slack, ServiceNow, ConnectWise, Dell, Fortinet, Palo Alto Networks, Cisco Meraki, Okta, and Jamf.
Pros and Cons
Pros:
- Configuration backups and comparison automation
- Automated network mapping and discovery
- Real-time visibility into network performance
Cons:
- Limited offline management capability
- Pricing details not publicly available
Learn more about Auvik: Best for proactive issue detection
- Free trial available
- From $149/user/month (billed annually)
Visit WebsiteCustomer Rating:4.6/5
Atera offers real-time monitoring and alerts for efficient system management. Atera is an all-in-one IT management platform designed for Managed Service Providers (MSPs) and IT professionals. It helps you monitor, manage, and automate IT operations across devices and networks, with a strong focus on reducing manual workload through AI and automation. Atera offers real-time visibility into system performance, network health, and device status, making it easier to proactively manage IT environments.
Why I Picked Atera: I chose Atera because it stands out for its remote monitoring and management (RMM) capabilities, which let you keep tabs on performance, uptime, and network health in real time. This makes it easier to catch and resolve issues before they escalate. I also value Atera’s AI-driven automation tools, which help speed up ticket resolution and free up time for more strategic IT work. Its customizable dashboards further enhance usability by giving you full control over how you view your environment.
Standout Features & Integrations:
Atera’s features include patch management to ensure systems stay secure and current, along with network discovery tools that provide a clear picture of all connected devices. Advanced reporting helps you analyze performance trends, while its built-in ticketing system centralizes issue tracking. Integrations include Salesforce, HubSpot, Microsoft Teams, Zendesk, Jira Software Cloud, Acronis Cyber Protect Cloud, Asana, ServiceNow, and WhatsApp Notifications, among others.
Pros and Cons
Pros:
- Effective IT management and issue resolution
- Combines remote monitoring, ticketing, and automation
- Affordable pricing which charges per technician rather than per device
Cons:
- Lacking some advanced customization options
- May require a slight learning curve
 Best open-source solution
- Free plan + 60-day trial + demo available
- From $1,400/year (billed annually)
Visit WebsiteCustomer Rating:4.7/5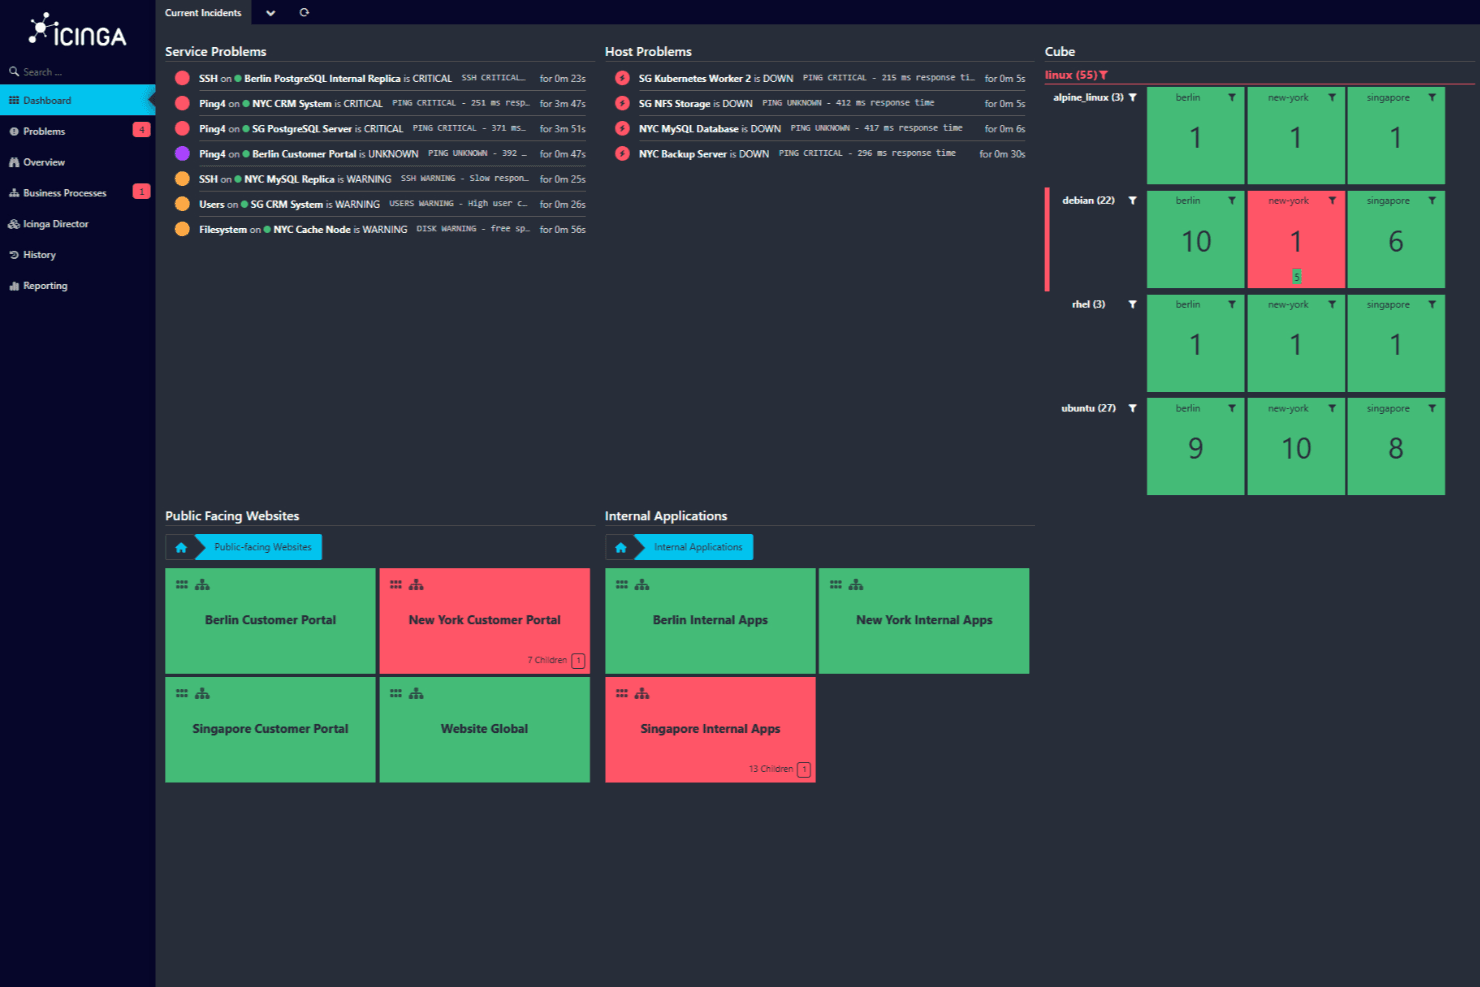
Icinga dashboard displaying current incidents with critical and warning service issues across public-facing websites and internal applications. Icinga is an open-source monitoring solution that helps you keep an eye on your entire IT infrastructure. It's designed to handle complex environments, offering a wide range of features to ensure your systems are running smoothly.
Why I Picked Icinga: It allows you to monitor everything from servers and networks to applications and databases. You can automatically import data from sources like Active Directory or cloud platforms like AWS and Azure, keeping your monitoring setup in sync with your infrastructure. I also like that it provides monitoring automation, allowing you to manage repetitive processes more easily. And, with its metrics and logs, you can gather and analyze data to gain valuable insights into your systems.
Standout Features & Integrations:
Other key features include distributed and agent-based monitoring to support coverage across multiple locations and customizable alerts and notifications to help you resolve issues quickly. Its analytics tools also let you create custom dashboards and reports, helping you identify bottlenecks and track historical uptime.
Some of Icinga's integrations include Grafana, AWS, Azure, Puppet, Ansible, Chef, Terraform, Jira, PagerDuty, ServiceNow, BigPanda, and Stackstorm.
Pros and Cons
Pros:
- Free to use with no setup fees
- Scalable for both small and large environments
- Highly customizable for various IT infrastructure needs
Cons:
- Occasional performance issues reported during high-load scenarios
- Setup and configuration comes with a learning curve
Learn more about Icinga: Best for real-time performance tracking
- Free plan + 30-day trial available
- From $395/year (billed annually)
Visit WebsiteCustomer Rating:4.3/5
ManageEngine Applications Manager provides real-time application monitoring, showing system health, availability, and uptime status in a centralized dashboard. ManageEngine Applications Manager is a tool that helps you monitor the performance of your applications and IT infrastructure. It keeps an eye on various components like servers, databases, and cloud services to ensure they're running smoothly. By doing so, it helps your team identify and fix issues before they affect your users.
Why I Picked ManageEngine Applications Manager: One reason I chose ManageEngine Applications Manager is its ability to monitor a wide range of technologies. It supports over 150 technologies, including application servers, databases, and cloud platforms. This means you can oversee your entire IT environment from a single console, making it easier to spot and address potential problems. Another useful feature is its real-time performance tracking. The tool provides insights into metrics like CPU and memory usage, response times, and transaction details. With this information, your team can quickly identify performance bottlenecks and take corrective actions to maintain optimal application performance.
Standout Features & Integrations:
Features include synthetic transaction monitoring, which allows you to simulate user interactions with your applications to identify potential issues before they impact real users. Additionally, real user monitoring provides insights into the actual experiences of your users, helping you understand how your applications perform under real-world conditions.
Integrations include ManageEngine ServiceDesk Plus, ServiceNow, Site24x7, AlarmsOne, Slack, Prometheus, AWS, Google Cloud, Microsoft Azure, Oracle, and MySQL.
Pros and Cons
Pros:
- Monitors a wide range of applications and infrastructure components
- Real-time alerting system helps teams respond promptly to issues
- Simplifies management of applications and their relationships
Cons:
- Setting up the tool to meet specific needs can be challenging
- The tool can be resource-intensive
Learn more about ManageEngine Applications Manager: Best for real-time application error tracking
- Free plan + 14-day trial + free demo available
- From $26/month (billed annually)
Visit WebsiteCustomer Rating:4.5/5
Sentry provides code-level application monitoring for developers. For developers and businesses seeking a monitoring tool that provides immediate insights into application performance and errors, Sentry stands out as a comprehensive solution. It is particularly appealing to those in web and mobile development, e-commerce, and enterprise sectors, addressing the critical need for real-time error tracking and performance optimization during high-traffic periods.
Why I Picked Sentry
I picked Sentry for its robust error monitoring and performance tracking capabilities. The tool excels at real-time error tracking, immediately alerting your team to issues and enabling swift resolution. Sentry's distributed tracing feature provides a detailed view of transaction performance, helping you identify slow operations and optimize them. Additionally, the session replay functionality offers visual context for debugging, making it easier to understand user interactions and address issues effectively.
Sentry Key Features
In addition to real-time application error tracking, Sentry offers:
- Mobile App Crash Reporting: Provides insights into mobile app crashes with detailed stack traces.
- Gaming Analytics: Provides performance monitoring tailored for gaming applications, highlighting latency and frame-rate issues.
- AI Code Review: Leverages AI to suggest potential fixes for detected issues, streamlining the debugging process.
- Security and Compliance: Ensures user data protection through industry-standard security measures, making it suitable for applications handling sensitive information.
Sentry Integrations
Sentry offers a wide range of native integrations to enhance workflow efficiency, including GitHub, Bitbucket, GitLab, Slack, Microsoft Teams, Jira, Asana, Trello, Datadog, and PagerDuty.
Pros and Cons
Pros:
- Offers real-time error tracking across web, mobile, and backend apps
- Advanced error grouping helps prioritize issues for fast resolution
- Distributed tracing shows transaction-level performance insights
Cons:
- Limited alerts and applications insights in lower-tier plans
- Not all integrations are available natively, relying on third-party APIs for some
Learn more about Sentry: Best for integrated remote IT management
- 30-day free trial available
- Pricing upon request
Visit WebsiteCustomer Rating:5/5
Atera monitoring tools main dashboard Atera provides tools and platforms focused on delivering remote IT management solutions. With a strong emphasis on integration, it ensures IT departments can effectively oversee and maintain diverse technological landscapes from any location, making it a reliable choice for integrated remote IT management.
Why I Picked Atera: While sifting through various remote IT management tools, Atera's offerings resonated with me due to its commitment to providing comprehensive integrated solutions. My determination, after judging and comparing several platforms, is that Atera distinctly excels in its approach to remote IT management through integration.
Standout Features & Integrations:
Key features of Atera include centralized IT asset monitoring, real-time system health tracking, and robust alert mechanisms. Moreover, its integrations span across a multitude of platforms, including major cloud service providers, popular OS systems, and leading IT operations platforms, ensuring cohesive operations regardless of the technology stack.
Pros and Cons
Pros:
- Robust alert mechanisms aid in proactive issue resolution.
- Compatibility with an expansive range of platforms and systems.
- Centralized monitoring of IT assets enhances oversight.
Cons:
- The absence of transparent pricing could deter potential users.
- The broad range of features might feel overwhelming without proper training.
- Might have a learning curve for those new to integrated management tools.
Learn more about Atera: Best for complete network management
- 30-day free trial
- From $1,233/year (billed annually)
Visit WebsiteCustomer Rating:4.3/5
ManageEngine OpManager network management dashboard ManageEngine OpManager is a robust tool that specializes in providing an integrated approach to network management. It offers functionalities that span from monitoring network performance to automating network configurations, aligning it perfectly as a solution for comprehensive network management.
Why I Picked ManageEngine OpManager: When it came to choosing a tool for all-encompassing network management, ManageEngine OpManager emerged at the forefront of my evaluations. Its distinct suite of features caters specifically to those who seek a holistic perspective on their network's operations and health.
Based on these assessments, I formed the opinion that ManageEngine OpManager is best positioned for complete network management tasks.
Standout Features & Integrations:
OpManager is distinguished by its physical and virtual server monitoring capabilities. Its network configuration management allows administrators to backup, restore, and automate tasks, providing peace of mind against configuration errors.
On the integration front, ManageEngine OpManager supports integration with popular ITOM solutions and third-party IT management apps, enriching its functionality.
Pros and Cons
Pros:
- Extensive integration capabilities with other IT management solutions.
- Features a comprehensive suite for network configuration management.
- Offers both physical and virtual server monitoring.
Cons:
- Licensing model may not be favorable for all types of businesses.
- Its wide array of features might be overwhelming for small-scale operations.
- Might have a steep learning curve for beginners.
Learn more about ManageEngine OpManager: Best for proactive monitoring
- Free plan + 30-day trial + demo available
- From $10/month
Visit WebsiteCustomer Rating:4.7/5
Site24x7 provides real-time dashboards, displaying key performance metrics such as response time, availability, packet loss, active sessions, and network traffic. Site24x7 is a cloud-based monitoring solution designed for DevOps and IT operations teams. It offers comprehensive monitoring capabilities for websites, servers, applications, and network devices, providing real-time insights into performance and availability.
Why I Picked Site24x7: I like Site24x7 for its robust application performance monitoring (APM). It supports various programming languages, including Java, .NET, Ruby, PHP, and Node.js. Another notable aspect is Site24x7's real user monitoring (RUM). This feature enables you to analyze the actual experience of users interacting with your website or web applications. By segmenting performance data by browser, platform, geography, and more, you can gain valuable insights into how different factors affect user experience and make informed decisions to improve it. Overall, these features help you proactively monitor various components of your IT infrastructure.
Standout Features & Integrations:
Other features include synthetic web transaction monitoring, which lets you record and simulate multi-step user interactions in a real browser, helping you optimize critical user journeys like login forms and shopping carts. Additionally, Site24x7's log management consolidates and indexes logs from various sources, aiding in efficient troubleshooting and issue resolution.
Integrations include ServiceNow, PagerDuty, Opsgenie, Jira, ManageEngine AlarmsOne, ManageEngine ServiceDesk Plus, Slack, Microsoft Teams, Zoho Cliq, Amazon EventBridge, Zapier, and Webhooks.
Pros and Cons
Pros:
- Comprehensive monitoring capabilities across various IT infrastructure components
- Reliable real-time alerts that enable prompt issue resolution
- Flexible customization options for dashboards and reports
Cons:
- Configuration complexity can be challenging for new users
- Limited integration options with certain third-party tools
Learn more about Site24x7: Best for AI-assisted anomaly detection
- 15-day free trial
- From $7/month
Visit WebsiteCustomer Rating:4.5/5
Dynatrace monitoring tool central dashboard Dynatrace is a performance monitoring tool designed to oversee the entirety of a digital ecosystem. Its sophisticated AI capabilities enable it to not only monitor but also proactively identify anomalies within a system.
This particular focus on AI-driven insights makes it especially suited for those in search of a solution for anomaly detection.
Why I Picked Dynatrace: In my search for monitoring solutions, Dynatrace captured my attention because of its pronounced emphasis on AI. The decision to select it was influenced by how its unique AI capabilities facilitate rapid anomaly detection, often preempting issues before they escalate.
My judgment, after comparing various tools, led me to believe that Dynatrace is unparalleled in its offering of AI-assisted anomaly detection.
Standout Features & Integrations:
Dynatrace offers real-time anomaly detection and root cause determination, attributes that are vital for quick issue resolution. It is full-stack monitoring, from applications to infrastructure, ensures comprehensive coverage.
When it comes to integrations, Dynatrace ties in with cloud platforms, CI/CD tools, and major IT operations platforms, making it adaptable to varied IT environments.
Pros and Cons
Pros:
- Rich integration environment with popular cloud and IT operation platforms.
- Comprehensive full-stack monitoring.
- Advanced AI capabilities for real-time anomaly detection.
Cons:
- The lack of transparent pricing can be a deterrent for some potential users.
- The vast array of features might require dedicated training sessions.
- Can be complex for users unfamiliar with AI-driven tools.
Outras ferramentas de monitorização
Segue-se uma lista de ferramentas de monitorização adicionais que incluí na minha lista restrita, mas que não chegaram às 10 melhores. Vale definitivamente a pena analisá-las.
- 11DatadogBest for cloud-scale monitoring
- 12New RelicBest for application performance insights
- 13Nagios XIBest for comprehensive infrastructure monitoring
- 14PrometheusBest for real-time alerting and multi-dimensional data collection
- 15SolarWinds Observability SaaSGood for real-time database health monitoring
- 16Micro Focus SiteScopeBest for agentless application monitoring
- 17SensuBest for flexible monitoring workflows
- 18ObserviumBest for network and server hardware health checks
- 19CheckmkBest for unified monitoring solutions
- 20Dotcom MonitorBest for building multi-step scripts
- 21Splunk EnterpriseGood for large-scale infrastructure data analytics
- 22AppDynamicsGood for deep application performance insights
- 23LogicMonitorGood for cloud-based infrastructure monitoring
- 24NetdataGood for real-time system performance troubleshooting
- 25CentreonGood for IT operation analytics in complex networks
How I Evaluate Monitoring Tools
I split my evaluation into two layers: the baseline features a tool needs to handle 3am alerts and trace failures across distributed services, and the differentiators that separate good from great.
Core Functionality (Table Stakes For This List)
When I'm selecting tools for my list, I rank each one on a scale from 0 (does not offer the functionality) to 5 (excels in this area) for each core functionality listed below. Then, I calculate the tool's total score into a percentage. Each tool needs to achieve a minimum total score of 75% to be considered for inclusion.
- Real-Time Monitoring: I check how quickly each tool surfaces live metrics—whether it's CPU spikes on a host or latency shifts across a Kubernetes cluster during a deployment.
- Alerting & Notifications: Each tool's alert system should support configurable thresholds, anomaly-based triggers, and routing to channels like Slack, PagerDuty, or email.
- Multi-Source Data Collection: I evaluate whether the tool ingests metrics, logs, and traces from servers, containers, cloud services, and applications rather than covering just one telemetry type.
- Dashboards & Visualization: The ability to build custom dashboards matters—think a single pane showing API error rates alongside database query times during an incident.
- Historical Data & Reporting: Trend analysis over weeks or months is essential for capacity planning, so I look at retention windows and the depth of reporting options.
- Integrations & Extensibility: A tool should connect to the broader stack—CI/CD pipelines, ITSM platforms, cloud providers—via native integrations, APIs, or open standards like OpenTelemetry.
Once I have a list of tools that meet this criteria, I consider what sets each platform apart.
Differentiating Factors (What Sets Vendors Apart)
Here's how I compare and contrast different vendors:
Standout Features
Distributed tracing is a major differentiator—when a checkout flow spans five microservices, I want to see exactly where latency builds up. Auto-discovery and topology mapping also matters for teams managing dynamic environments where containers spin up constantly. I look at synthetic monitoring too, which lets you simulate user transactions and API calls to catch failures before real users are impacted.
Beyond Features
Pricing predictability is something I evaluate closely—monitoring costs can spiral when data ingestion spikes during incidents, so I check whether a vendor's model stays manageable as your environment grows. Security and compliance certifications like SOC 2 and ISO 27001 also factor in, especially for teams in regulated industries. I consider time-to-value too: pre-built dashboards, auto-instrumentation, and lightweight agents make a real difference when you need visibility on day one.
Como escolher ferramentas de monitorização
É fácil ficar preso a longas listas de funcionalidades e estruturas de preços complexas. Para o ajudar a manter o foco enquanto analisa o seu processo específico de seleção de software, segue-se uma lista de verificação de fatores a ter em conta:
| Fator | O que considerar |
|---|---|
| FatorEscalabilidade | O que considerarA ferramenta consegue acompanhar o crescimento da sua empresa? Considere as necessidades futuras e se a ferramenta consegue lidar com um aumento de dados e utilizadores sem problemas de desempenho. Procure opções de escalabilidade flexíveis. |
| FatorIntegrações | O que considerarConsegue ligar-se aos seus sistemas existentes? Garanta a compatibilidade com a sua atual stack tecnológica, como CRM, ERP ou serviços na cloud, para evitar soluções alternativas dispendiosas. |
| FatorPersonalização | O que considerarPode adaptar a ferramenta aos seus fluxos de trabalho? Verifique se pode modificar painéis, alertas e relatórios para se adequarem aos processos e necessidades específicos da sua equipa. |
| FatorFacilidade de utilização | O que considerarA ferramenta é intuitiva para a sua equipa? Avalie a curva de aprendizagem e se a sua equipa consegue adotar rapidamente a ferramenta sem formação extensa. Procure interfaces fáceis de utilizar. |
| FatorImplementação e integração inicial | O que considerarQuão simples é o processo de configuração? Considere o tempo e os recursos necessários para pôr a ferramenta a funcionar. Procure fornecedores que ofereçam suporte e recursos abrangentes para a integração inicial. |
| FatorCusto | O que considerarO preço enquadra-se no seu orçamento? Compare o custo da ferramenta com as suas funcionalidades e benefícios. Esteja atento a taxas ocultas ou custos relativos a utilizadores ou funcionalidades adicionais. |
| FatorMedidas de segurança | O que considerarProtege os seus dados? Avalie as medidas de segurança implementadas, como a encriptação e a conformidade com as normas do setor, para garantir que os seus dados permanecem seguros. |
| FatorDisponibilidade do suporte | O que considerarÉ possível obter ajuda quando necessário? Verifique as opções de suporte disponíveis, como assistência 24 horas por dia, 7 dias por semana, chat em direto ou gestores de conta dedicados, para garantir que existe assistência quando dela precisar. |
O que são ferramentas de monitorização?
As ferramentas de monitorização são softwares que acompanham o desempenho e o estado dos sistemas, redes e aplicações. São utilizadas por equipas de TI, engenheiros de DevOps e administradores de sistemas para encontrar problemas atempadamente, reduzir o tempo de inatividade e manter os sistemas a funcionar sem problemas. O acompanhamento de métricas, os alertas e os painéis ajudam a identificar tendências, resolver problemas e manter as equipas informadas. O software de monitorização de hardware proporciona às equipas a visibilidade de que necessitam para gerir sistemas sem surpresas.
Funcionalidades
Ao selecionar ferramentas de monitorização, procure as seguintes funcionalidades essenciais:
- Alertas em tempo real: Notificam imediatamente os utilizadores quando surgem problemas, permitindo uma resposta e resolução rápidas.
- Painéis personalizáveis: Adapte a interface para apresentar as métricas e os dados mais relevantes para a sua equipa.
- Capacidades de integração: Ligue-se perfeitamente aos sistemas e softwares existentes para proporcionar uma visão unificada das operações.
- Análise automatizada da causa-raiz: Identifique a causa subjacente dos problemas sem intervenção manual, poupando tempo e esforço.
- Análise preditiva: Antecipe potenciais problemas antes de estes ocorrerem, ajudando a manter a estabilidade do sistema.
- Escalabilidade: Adapte-se ao aumento das exigências de dados e utilizadores, garantindo que a ferramenta continua eficaz à medida que a sua empresa cresce.
- Medidas de segurança: Proteja os dados sensíveis através de encriptação e conformidade com as normas do setor.
- Relatórios abrangentes: Gere relatórios detalhados para analisar tendências de desempenho e apoiar a tomada de decisões.
- Suporte multicloud: Monitorize aplicações em diferentes ambientes de cloud, proporcionando uma visão abrangente das operações.
- Interface fácil de utilizar: Garanta a facilidade de utilização, permitindo que os membros da equipa naveguem e utilizem a ferramenta de forma eficiente.
Benefícios
A implementação de ferramentas de monitorização em conjunto com ferramentas de mapeamento de redes proporciona vários benefícios à sua equipa e à sua empresa. Eis alguns dos benefícios que pode esperar:
- Melhoria do desempenho do sistema: Os alertas em tempo real e a análise automatizada da causa-raiz ajudam a resolver rapidamente os problemas, mantendo os sistemas a funcionar sem problemas.
- Melhoria da tomada de decisões: Os relatórios abrangentes e a análise preditiva fornecem informações que apoiam decisões empresariais fundamentadas.
- Aumento da eficiência: Os painéis personalizáveis e as capacidades de integração poupam tempo ao disponibilizarem dados relevantes num formato acessível.
- Escalabilidade: À medida que a sua empresa cresce, a escalabilidade garante que a ferramenta se adapta ao aumento das exigências sem problemas de desempenho.
- Segurança dos dados: As medidas de segurança protegem as suas informações sensíveis, garantindo a conformidade com as normas do setor.
- Poupança de custos: A deteção e resolução atempadas de problemas reduzem o tempo de inatividade e os custos associados, beneficiando os resultados da empresa.
- Visibilidade multiplataforma: O suporte multicloud proporciona uma visão unificada das operações em diferentes ambientes, aumentando a transparência geral.
Custos e preços
A seleção de ferramentas de monitorização exige uma compreensão dos vários modelos de preços e planos disponíveis. Os custos variam consoante as funcionalidades, o tamanho da equipa, os complementos, entre outros fatores. A tabela abaixo resume os planos comuns, os respetivos preços médios e as funcionalidades normalmente incluídas nas soluções de ferramentas de monitorização:
Tabela de comparação de planos para ferramentas de monitorização
| Tipo de plano | Preço médio | Funcionalidades comuns |
|---|---|---|
| Tipo de planoPlano gratuito | Preço médio$0/utilizador/mês | Funcionalidades comunsMonitorização básica, alertas limitados e apoio da comunidade. |
| Tipo de planoPlano pessoal | Preço médio$5-$25/utilizador/mês | Funcionalidades comunsAlertas em tempo real, painéis personalizáveis e análise básica. |
| Tipo de planoPlano empresarial | Preço médio$30-$75/utilizador/mês | Funcionalidades comunsRelatórios avançados, capacidades de integração e acesso multiutilizador. |
| Tipo de planoPlano empresarial de grande escala | Preço médio$100-$300/utilizador/mês | Funcionalidades comunsAnálise preditiva, apoio 24 horas por dia, 7 dias por semana, e opções de personalização completas. |
Perguntas frequentes sobre ferramentas de monitorização
Eis algumas respostas a perguntas comuns sobre ferramentas de monitorização:
Como funciona uma ferramenta de monitorização?
Uma ferramenta de monitorização acompanha várias métricas, como a carga da CPU, a largura de banda da rede e o espaço em disco. Ajuda a detetar problemas e alerta os administradores antes de os utilizadores serem afetados. Estas ferramentas garantem o bom funcionamento dos sistemas ao fornecer informações sobre o desempenho e potenciais problemas.
Que competências são necessárias para utilizar ferramentas de monitorização?
Precisará de competências estatísticas e analíticas para recolher e analisar dados. Estas competências ajudam-no a compreender o impacto da monitorização e a tomar decisões fundamentadas. Também será útil sentir-se à vontade com a interpretação de dados e ter uma compreensão básica dos sistemas informáticos.
Como selecionar ferramentas de monitorização de aplicações?
Tenha em consideração o tipo e a complexidade da sua aplicação. Avalie a facilidade de implementação e gestão da ferramenta e certifique-se de que esta cumpre as suas normas de segurança. Procure funcionalidades que correspondam às suas necessidades específicas e proporcionem o maior valor à sua equipa.
Como funcionam as ferramentas de monitorização de redes?
As ferramentas de monitorização de redes acompanham aspetos como o tráfego, a utilização da largura de banda e o tempo de atividade. Detetam dispositivos na rede e fornecem atualizações do estado. Isto ajuda a gerir o desempenho da rede e a identificar potenciais problemas antes de afetarem os utilizadores.
Quais são os desafios comuns ao utilizar ferramentas de monitorização?
Os utilizadores enfrentam frequentemente desafios como o excesso de dados, que pode dificultar a identificação dos problemas principais. A integração com os sistemas existentes também pode ser complexa. É importante configurar corretamente os alertas para evitar notificações desnecessárias que podem provocar fadiga de alertas.
Como podem as ferramentas de monitorização melhorar o desempenho do sistema?
As ferramentas de monitorização fornecem informações em tempo real sobre o desempenho do sistema, ajudando-o a identificar e resolver rapidamente os problemas. Ao analisar tendências e alertá-lo para potenciais problemas, estas ferramentas ajudam a manter o estado ideal do sistema e a reduzir o tempo de inatividade.