

Encontrar a ferramenta de monitorização certa pode ser uma dor de cabeça. Procura algo que se adapte às necessidades da sua equipa sem acrescentar complexidade. É por isso que muitas organizações estão à procura de alternativas ao LogicMonitor.
Na minha experiência, as empresas procuram frequentemente outras soluções que ofereçam melhor escalabilidade, funcionalidades específicas ou uma relação custo-benefício mais favorável. Podem concluir que o LogicMonitor não está alinhado com os seus objetivos ou orçamento atuais.
Testei e analisei várias opções de forma independente para lhe apresentar uma perspetiva imparcial sobre o que está disponível. Vou orientá-lo pelas melhores ferramentas para responder aos seus desafios específicos.
Quer esteja à procura de uma integração melhorada com a nuvem ou da flexibilidade do código aberto, este artigo de lista ajudá-lo-á a encontrar a solução certa. Vamos explorar as principais opções que podem tornar as suas tarefas de monitorização mais fáceis de gerir.
O que é o LogicMonitor?
O LogicMonitor é um software de produtividade concebido para profissionais de TI e empresas que necessitam de soluções de monitorização eficientes. É utilizado pelas equipas de TI para monitorizar infraestruturas, aplicações e o desempenho das redes, fornecendo informações valiosas sobre o funcionamento dos sistemas.
A monitorização automatizada, os painéis personalizáveis e os alertas em tempo real ajudam a identificar problemas e a otimizar o desempenho. No geral, o LogicMonitor oferece uma plataforma centralizada para manter os seus sistemas a funcionar sem problemas.
Tabela comparativa das alternativas ao LogicMonitor
Esta tabela comparativa resume os detalhes de preços das minhas principais alternativas ao LogicMonitor:
Score legend (out of 5)
- Excellent4.5–5
- Good4–4.4
- Average3–3.9
- Below average2–2.9
- Poor1–1.9
Sorted by: Default
| Tool | Starting Price | Website | |||||||
|---|---|---|---|---|---|---|---|---|---|
Best for AI-powered observability | 3.8 out of 5 | 4 | 4 | 3 | 4 | 4 | 4 | $7/month 15-day free trial + demo available | Website |
Best for cost-effective monitoring | 4.0 out of 5 | 4 | 3 | 4 | 4 | 4 | 5 | $325/month Free plan + 5-day free trial + free demo available | Website |
Best for cloud monitoring services | 4.3 out of 5 | 4 | 4 | 4 | 4 | 5 | 5 | $18/host/month Free plan + free trial available | Website |
Best for AI-powered data analysis | 3.8 out of 5 | 4 | 4 | 3 | 4 | 4 | 4 | $15/host/month Free plan available | Website |
Best for automated real-time data access | 3.8 out of 5 | 4 | 4 | 3 | 4 | 4 | 4 | $0.04/month 14-day free trial + free demo available | Website |
Best for unified, flexible observability | 3.8 out of 5 | 4 | 4 | 4 | 3 | 4 | 4 | $19/month Free plan available | Website |
Best for integrated IT solutions | 3.7 out of 5 | 3 | 3 | 4 | 3 | 5 | 4 | Pricing upon request 30-day free trial available | Website |
Best for customizable dashboard | 3.3 out of 5 | 4 | 2 | 4 | 3 | 4 | 3 | $200/month Free plan + 30-day trial + demo available | Website |
Best for open-source observability | 3.8 out of 5 | 4 | 4 | 4 | 3 | 4 | 4 | $49/month 30-day free trial + free demo available | Website |
Best for AI-native insights | 3.2 out of 5 | 3 | 4 | 3 | 2 | 3 | 4 | Pricing upon request Free plan + free demo available | Website |


Why Trust Our Software Recommendations
6,700+
Reviews
20
Industry experts
16+
Evaluation factors
14
Years
Our team has been testing and reviewing software since 2012. As tech leaders ourselves, we know how difficult—and important—it is to choose the right software.
For this guide, we evaluated tools using hands-on testing and independent research, scoring tools using our selection criteria.
Our reviews reflect our human editorial judgment, not a sales pitch.
Expert reviewers:
- Paulo Gardini MiguelTech Director
 Tim FisherVP of AI
 Gabriel RosasTech Lead & Software Architect
 Christhian GruhnTech Lead & Platform Architect

Análises das melhores alternativas ao LogicMonitor
Apresentamos abaixo os meus resumos detalhados das melhores alternativas ao LogicMonitor que entraram na minha lista. As minhas análises oferecem uma visão detalhada das principais funcionalidades, vantagens e desvantagens, integrações e casos de utilização ideais de cada ferramenta, para o ajudar a encontrar a melhor opção para si.
 Best for AI-powered observability
- 15-day free trial + demo available
- From $7/month (billed annually)
Visit WebsiteCustomer Rating:4.5/5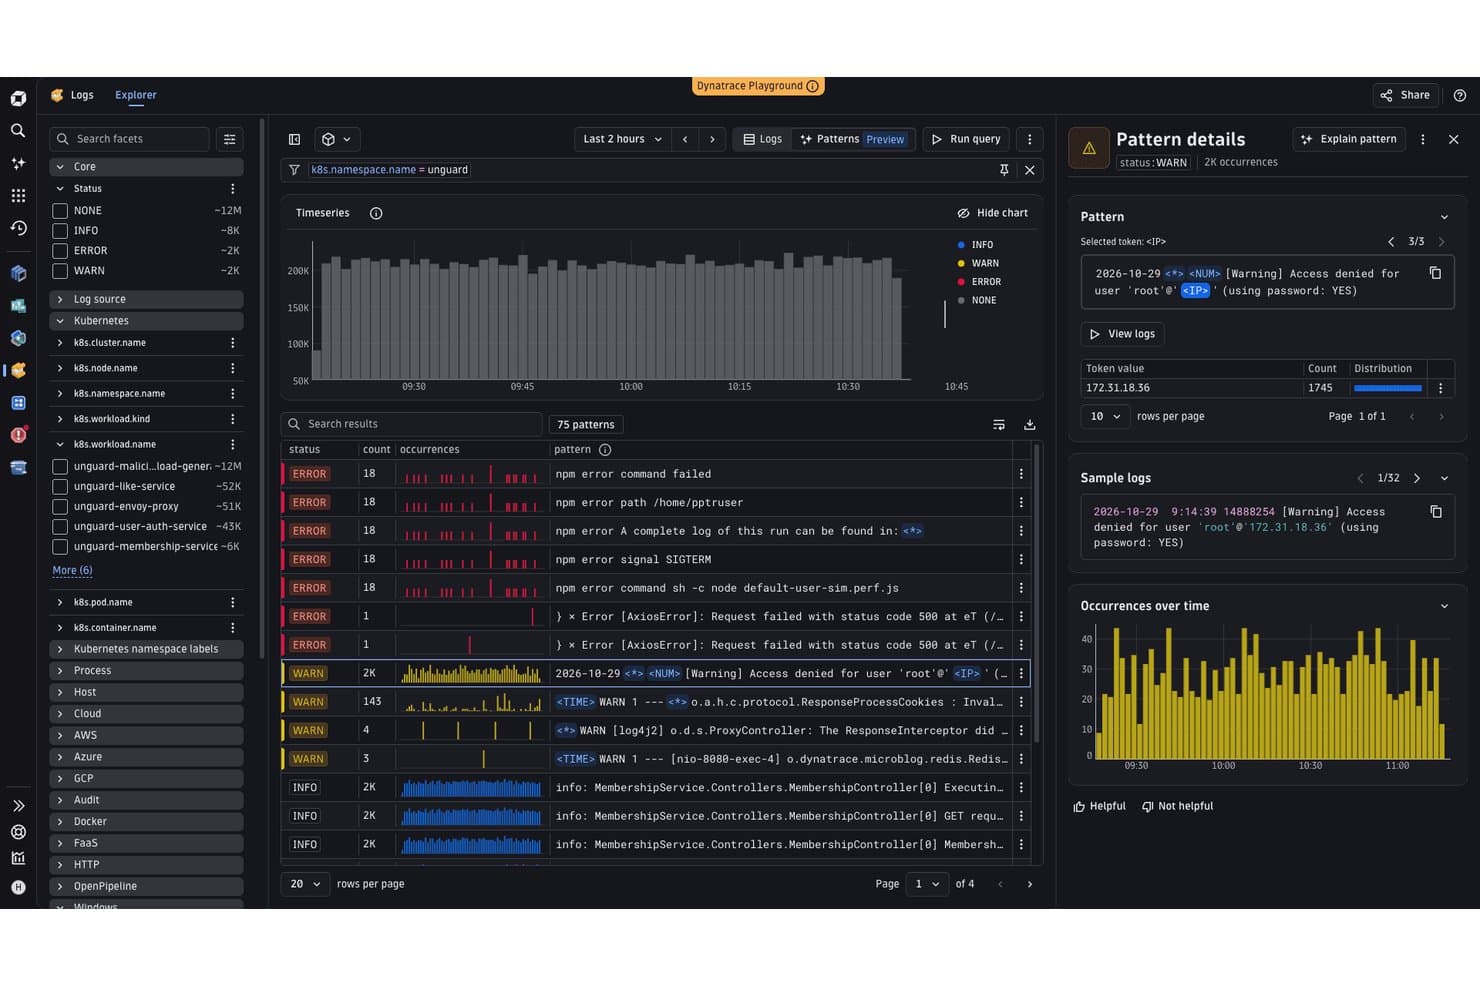
Dynatrace Logs app grouping log entries into patterns by status, with occurrence charts and details. Dynatrace is a full-stack observability platform that uses AI to automatically discover, map, and monitor your applications, infrastructure, and cloud environments—making it a strong fit for IT operations and DevOps teams dealing with complex, fast-moving systems where manual root cause analysis isn't realistic.
Who Is Dynatrace Best For?
Dynatrace is a strong fit for DevOps and IT operations teams managing complex, distributed environments where full-stack visibility and AI-driven root cause analysis matter more than dedicated network monitoring.
Why I Picked Dynatrace
I picked Dynatrace as one of the best LogicMonitor alternatives because its AI-powered observability goes well beyond threshold-based alerting. Davis AI uses Smartscape topology to automatically correlate events across hosts, containers, and services, so instead of triaging dozens of alerts, I get a single root cause. PurePath traces every transaction end-to-end at the code level, which means I can pinpoint exactly where a slowdown originates without manual log digging.
Dynatrace Key Features
- OneAgent automatic discovery: Installs per host and automatically discovers processes, services, and dependencies without manual configuration.
- Log Analytics with DQL: Ingests, enriches, and queries log data using Dynatrace Query Language, with configurable retention from 10 days to 10 years.
- Synthetic monitoring: Simulates user journeys via Browser Monitor and checks API and service availability via HTTP Monitor from public and private locations.
- Workflow automation: Triggers automated workflows from events, schedules, or API calls, with support for conditions, loops, and retries.
Dynatrace Integrations
Dynatrace has marketplace integrations with Jira, Slack, Cursor, GitHub Copilot Coding Agent, JetBrains, and Windsurf. It also provides Environment, Configuration, and Account Management APIs for custom integrations and workflow connectivity.
Pros and Cons
Pros:
- PurePath traces transactions to code-level causes
- OneAgent discovers application and infrastructure dependencies
- Correlates alerts through Smartscape topology
Cons:
- Custom dashboards take effort to configure
- Network monitoring trails specialist platforms
 Best for cost-effective monitoring
- Free plan + 5-day free trial + free demo available
- From $325/month (billed annually)
Visit WebsiteCustomer Rating:4.5/5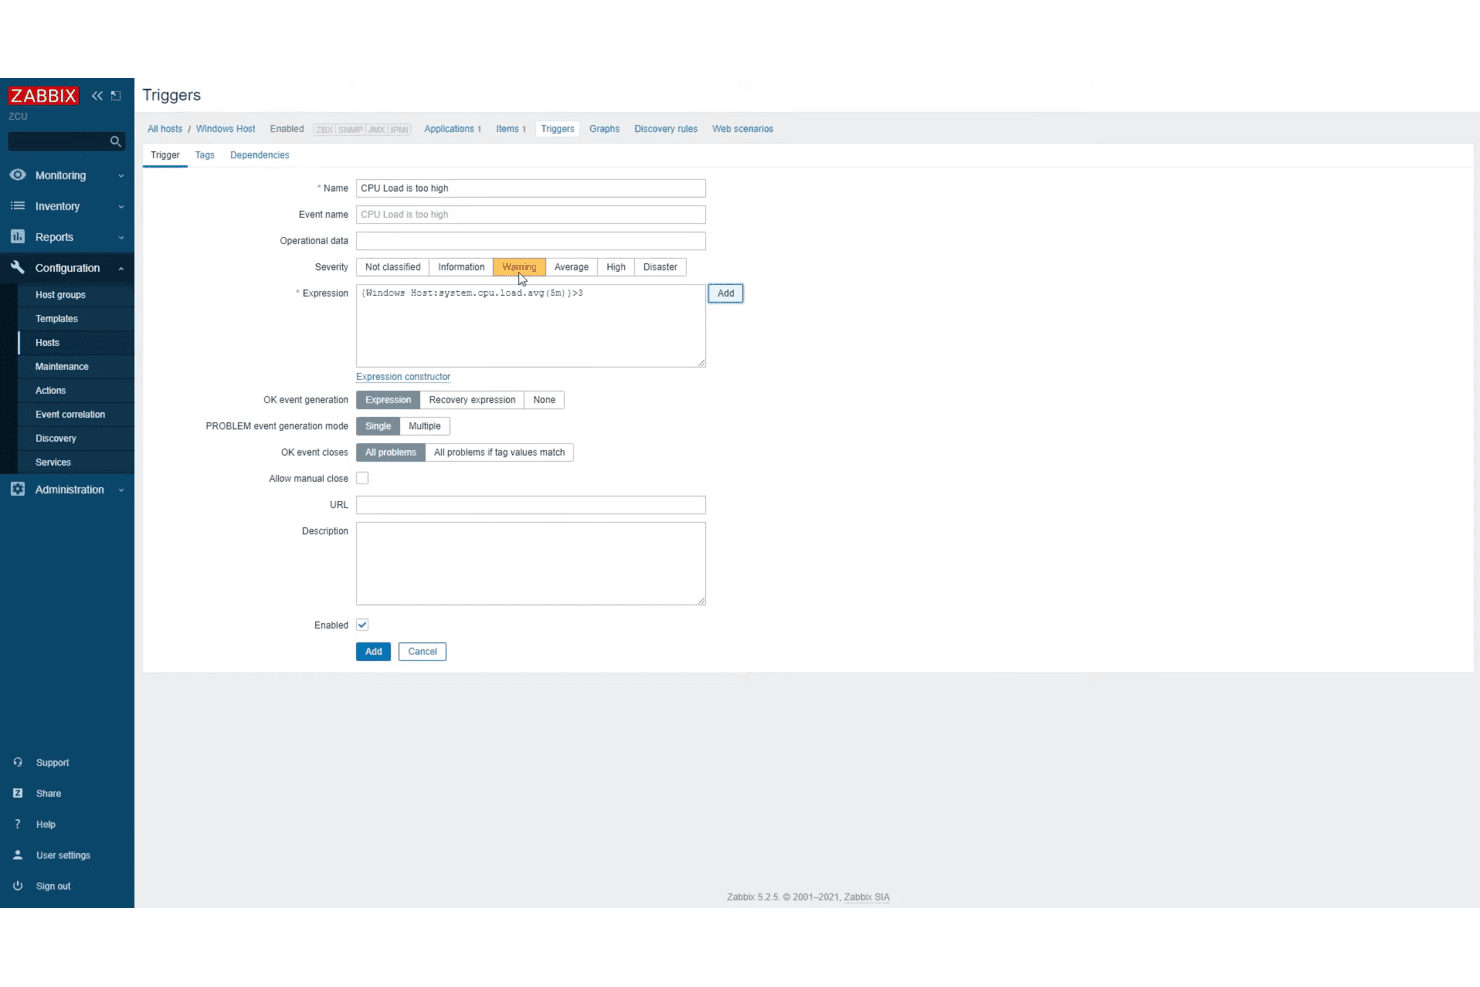
Configuring a Zabbix trigger that alerts when Windows host CPU load exceeds a threshold. Zabbix is an open-source monitoring platform that appeals to IT teams who need broad infrastructure visibility—across servers, networks, cloud, containers, and applications—without paying per-device or per-metric licensing fees.
Who Is Zabbix Best For?
Zabbix is a strong fit for IT teams that need enterprise-grade infrastructure monitoring but can't justify per-device licensing costs.
Why I Picked Zabbix
I picked Zabbix as one of the best because no other tool on this list lets you drop per-device licensing entirely and still get enterprise-grade monitoring across servers, networks, cloud, and containers. The open-source core has no host limits, no metric caps, and no feature gates, so a team managing thousands of endpoints pays the same zero in licensing as one managing ten. I also appreciate the predictive trigger functions, which use historical data to estimate when a threshold will be breached before it actually happens.
Zabbix Key Features
- Event correlation rules: Configure rules to group related events, deduplicate flapping alerts, and automatically close stale problems across different triggers and polling methods.
- Multi-cloud cost dashboards: View and compare infrastructure spending across AWS, Azure, Google Cloud, and Oracle Cloud from a single dashboard.
- OpenTelemetry APM support: Receive distributed traces, metrics, and logs from applications or OpenTelemetry Collectors via a Zabbix proxy, with ClickHouse as the telemetry data source.
- Automated remediation actions: Run configured scripts or commands in response to detected problems, including restarting services or rescaling cloud resources.
Zabbix Integrations
Zabbix lists 204 official templates and 570 brands across 2,010 solutions, including AWS, Azure, Google Cloud Platform, ServiceNow, Slack, PagerDuty, Kafka, and RabbitMQ. Its JSON-RPC API, REST streaming API, webhooks, and Python library support custom integrations.
Pros and Cons
Pros:
- Forecasting flags approaching metric thresholds
- Flexible alerts and event correlation
- Broad visibility across servers and networks
Cons:
- Self-hosted deployments add database upkeep
- Alert thresholds need hands-on tuning
 Best for cloud monitoring services
- Free plan + free trial available
- From $18/host/month
Visit WebsiteCustomer Rating:4.5/5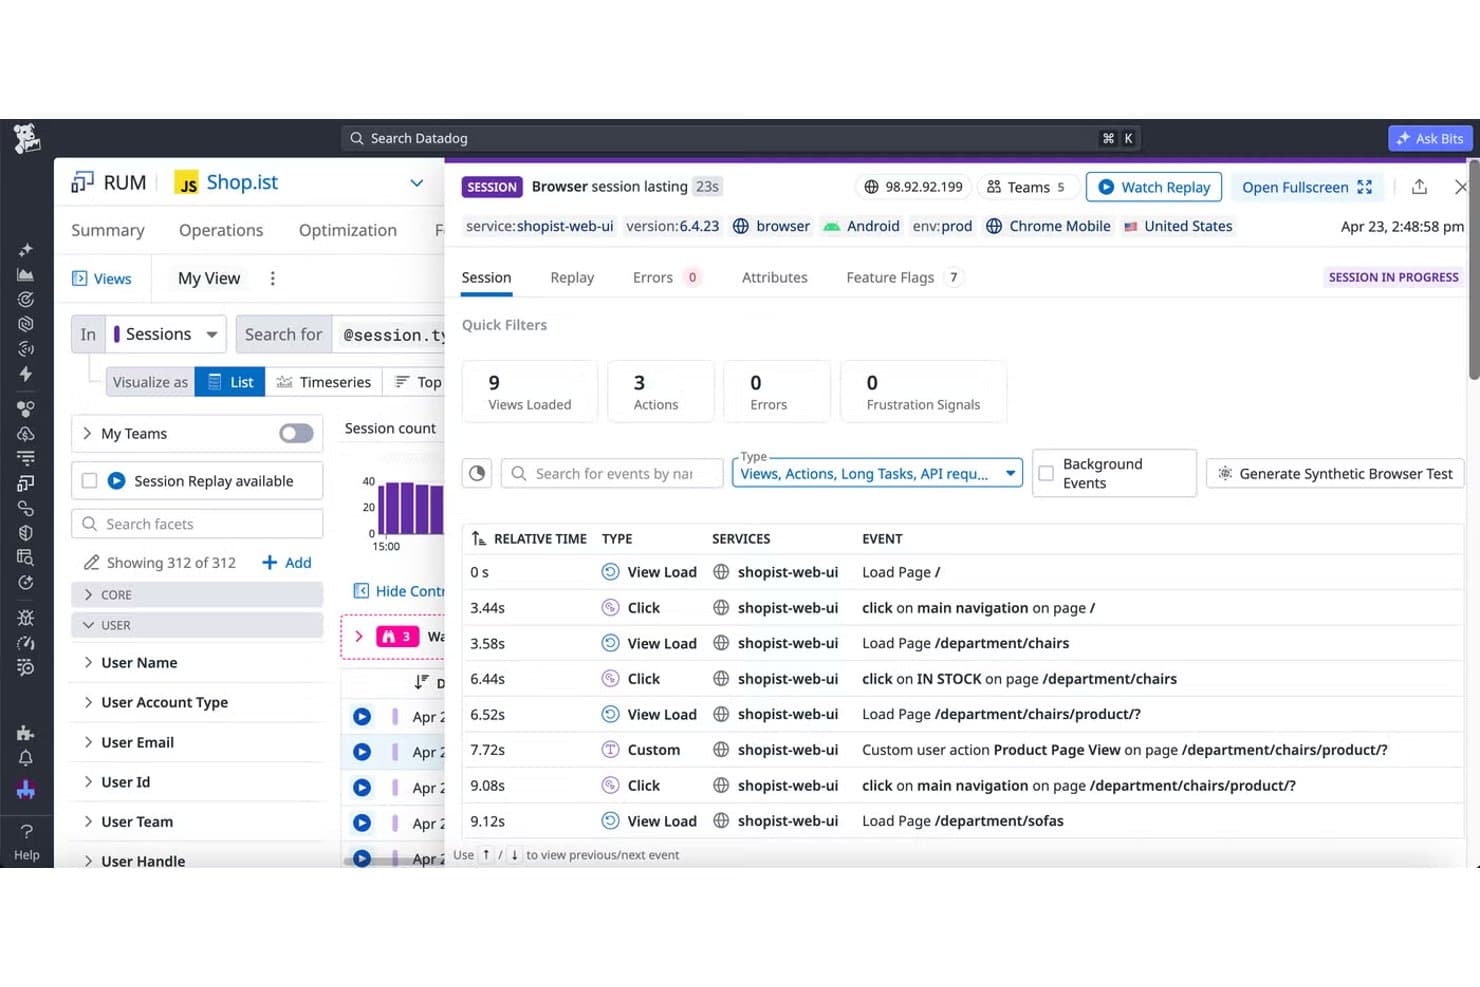
Datadog RUM session view showing a user's page loads, clicks, and custom actions in sequence. Datadog is a SaaS-based observability platform that gives IT and DevOps teams unified visibility across cloud, hybrid, and on-premises infrastructure—combining metrics, logs, traces, and security signals in one place to cut down on context-switching during incident response.
Who Is Datadog Best For?
Datadog is a strong fit for DevOps engineers and IT operations teams managing cloud-native or hybrid environments who need unified visibility across infrastructure, logs, traces, and security signals in one platform.
Why I Picked Datadog
I picked Datadog as one of the best LogicMonitor alternatives because it's purpose-built for cloud monitoring, tracking tens of thousands of metrics across AWS, Azure, and GCP while correlating them with logs, traces, and security signals in one view. I particularly like Watchdog, its AI engine that surfaces anomalies automatically, so my team isn't manually sifting through noise during an incident. The forecast monitors are also genuinely useful: I can model CPU or memory trends using seasonal or linear algorithms and set alert thresholds up to three months out.
Datadog Key Features
- Tag-based infrastructure search: Filter and analyze metrics across your entire infrastructure using custom tags to group hosts, containers, and cloud resources by any dimension.
- Cross-signal correlation: Link infrastructure metrics with logs, traces, and security signals in a single view to investigate incidents without switching tools.
- Device topology mapping: Visualize network devices, interfaces, and physical connections, with the ability to inspect traffic, SNMP traps, Syslog messages, and neighboring devices.
- Live Processes monitoring: View real-time process-level activity across your hosts and containers, including resource consumption and running commands, from a centralized interface.
Datadog Integrations
Datadog offers 1,000+ integrations, including Amazon Web Services, Microsoft Azure, Google Cloud Platform, Kubernetes, Docker, Jira, PagerDuty, OpenTelemetry, PostgreSQL, and Redis. Its REST API and client libraries support custom integrations.
Pros and Cons
Pros:
- Forecast monitors help anticipate capacity trends
- Custom dashboards clarify live system health
- Correlates infrastructure, logs, and traces
Cons:
- Alert tuning can create notification fatigue
- Usage-based bills can be hard to predict
 Best for AI-powered data analysis
- Free plan available
- From $15/host/month (billed annually)
Visit WebsiteCustomer Rating:4.3/5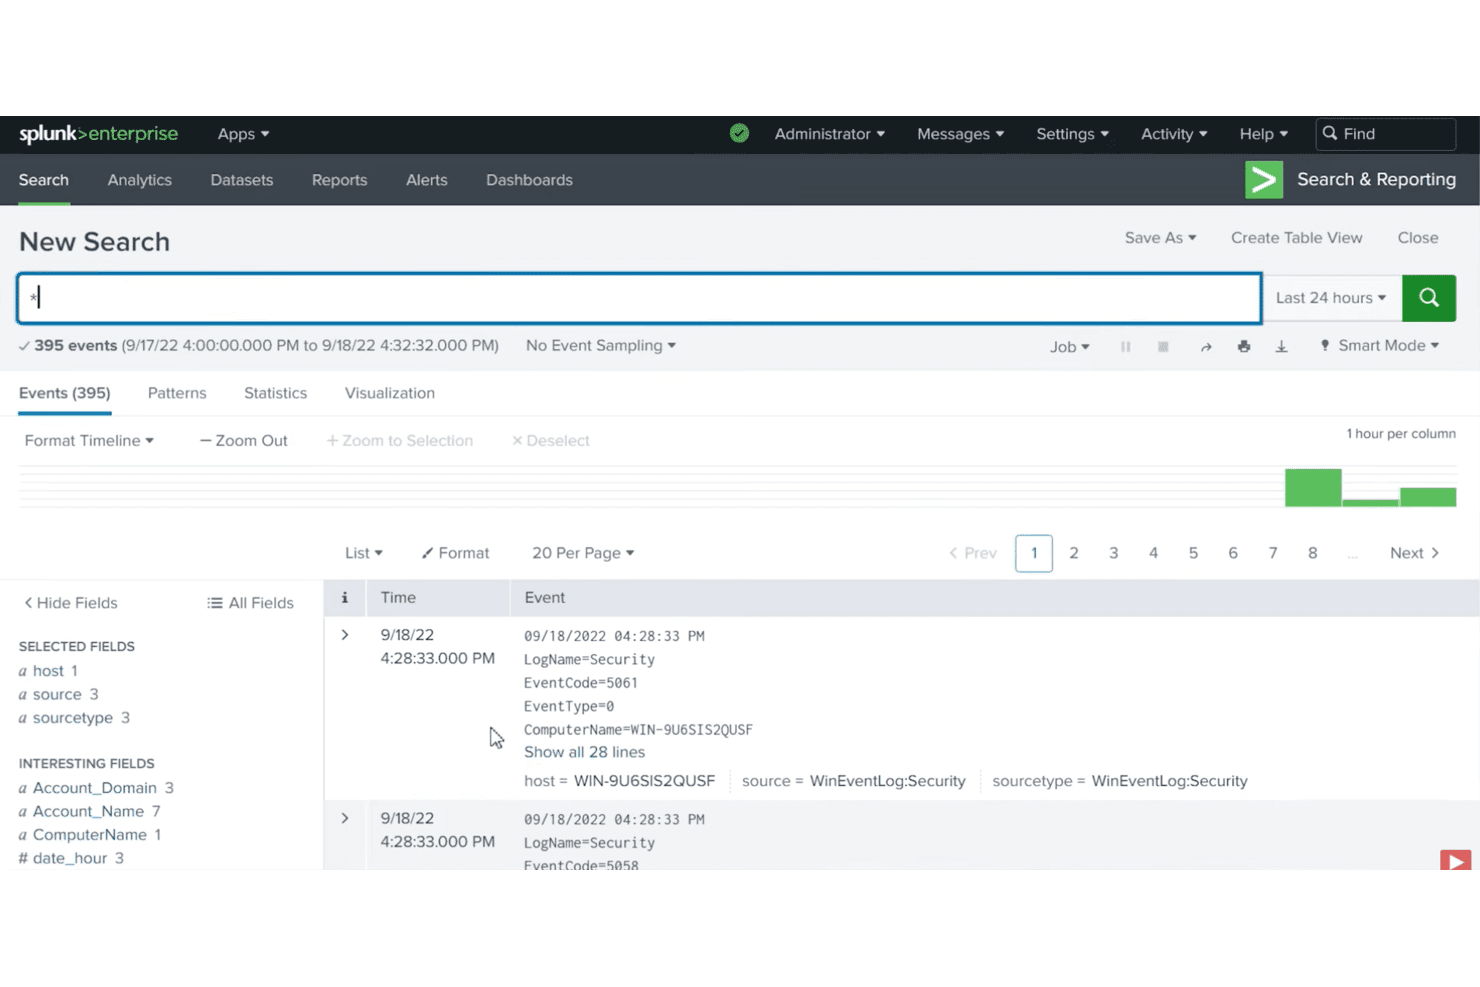
Splunk Enterprise search view showing Windows Security events with selectable fields and a timeline. Splunk Observability Cloud is a SaaS monitoring platform that unifies infrastructure, application performance, and digital experience data, making it a strong fit for IT and DevOps teams who need AI-assisted root cause analysis across hybrid and cloud environments.
Who Is Splunk Best For?
Splunk Observability Cloud is a strong fit for DevOps and IT operations teams in mid-to-large organizations that need AI-assisted root cause analysis across hybrid and cloud environments.
Why I Picked Splunk
I picked Splunk as one of the best LogicMonitor alternatives because of how well its AI SRE layer handles the investigation work that usually falls on your team. The AI troubleshooting agent pulls together metrics, traces, and logs to surface likely root causes in plain language, while the AI Assistant lets you query across APM, infrastructure, and Kubernetes data without writing a single query. I especially like that NoSample tracing captures 100% of trace data, so nothing gets dropped before analysis.
Splunk Key Features
- Infrastructure dashboards: Prebuilt dashboards and visualizations for cloud services, systems, and Kubernetes environments give your team real-time visibility into hybrid infrastructure health.
- Dynamic alerting with detectors: Detectors monitor metric signals and trigger alerts based on multi-condition rules, sending notifications to tools like PagerDuty, Slack, ServiceNow, and Microsoft Teams.
- OpenTelemetry-native ingestion: Collects metrics, traces, and logs using open-standard instrumentation, with support for Prometheus, Telegraf, and collectd alongside 200+ integrations.
- Log Observer Connect: Links logs already stored in Splunk Cloud Platform or Splunk Enterprise directly into Observability Cloud troubleshooting workflows at no additional cost.
Splunk Integrations
Splunk Observability Cloud documents 200+ supported open-standards-based integrations, including AWS, Microsoft Azure, Google Cloud Platform, Jira, Microsoft Teams, PagerDuty, ServiceNow, Slack, and Amazon EventBridge. It also supports OpenTelemetry, Prometheus, Telegraf, collectd, and REST API connections.
Pros and Cons
Pros:
- Captures every trace for investigations
- AI summarizes likely causes in plain language
- Unifies telemetry for faster troubleshooting
Cons:
- SignalFlow requires hands-on detector tuning
- Costs rise as telemetry sources multiply
Learn more about Splunk: Best for automated real-time data access
- 14-day free trial + free demo available
- From $0.04/month
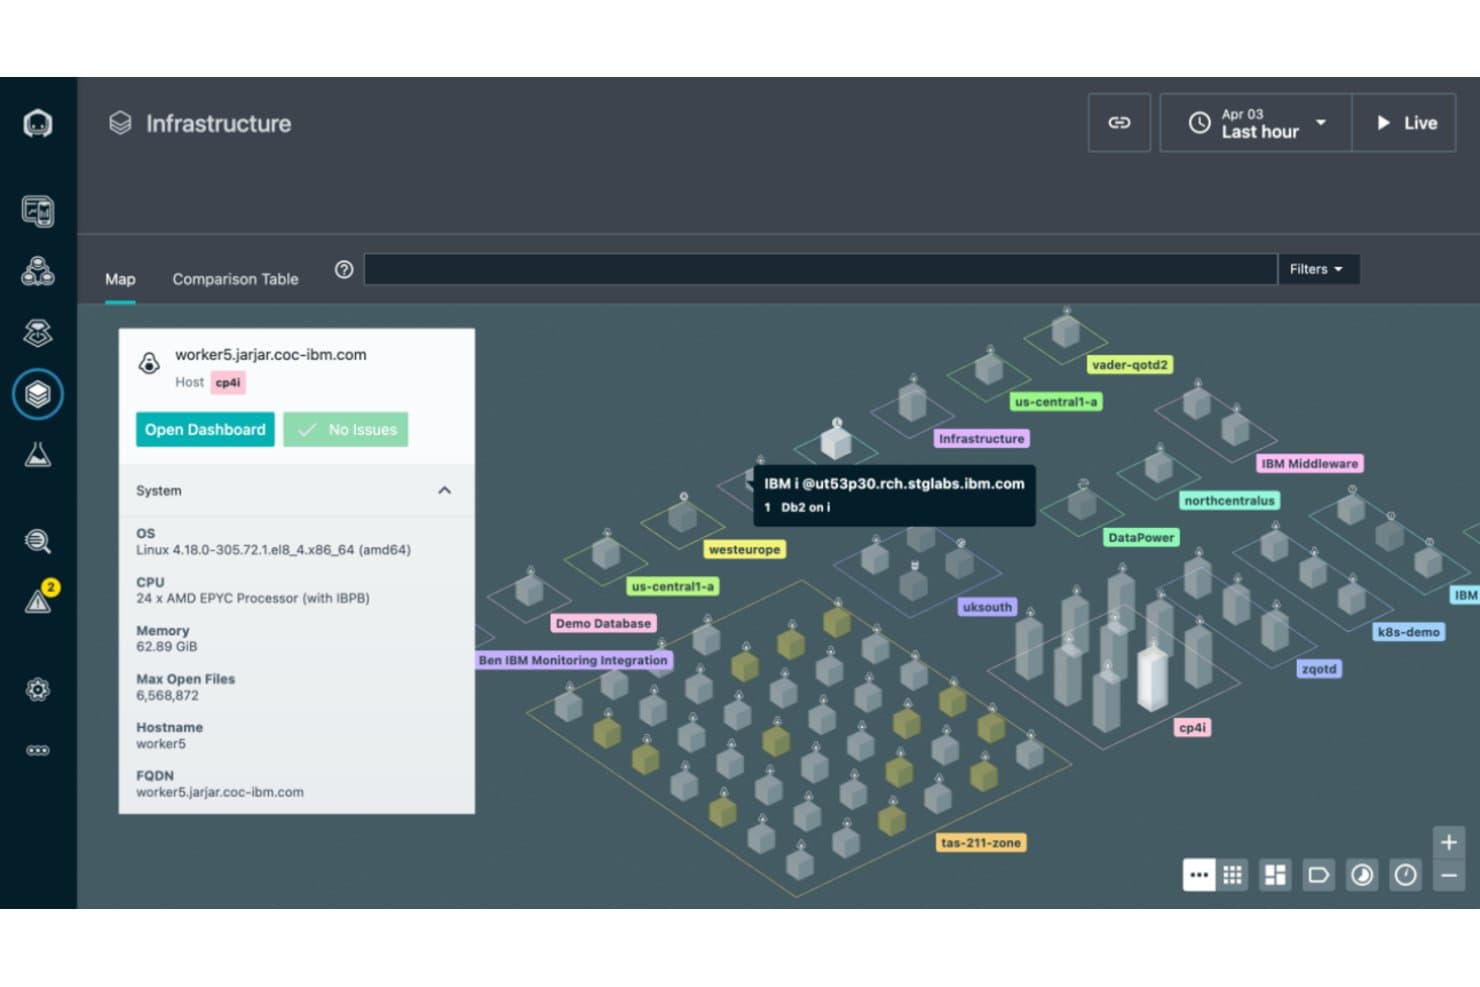
IBM Instana's Infrastructure map shows hosts grouped by zone, with host details and live status. IBM Instana is an AI-powered observability platform built for DevOps teams who need automatic discovery, real-time dependency mapping, and deep application performance visibility across cloud, hybrid, and containerized environments.
Who Is IBM Instana Best For?
IBM Instana is a strong fit for DevOps engineers managing complex, cloud-native environments who need real-time, automatic discovery and dependency mapping without manual instrumentation work.
Why I Picked IBM Instana
I've included IBM Instana in my top picks because its automated real-time data access is genuinely differentiated: the Dynamic Graph discovers and maps every host, service, and dependency continuously, updating every second without manual instrumentation. I appreciate how this pairs with agentic AI root cause analysis, which correlates trace statistics, topology, and anomaly signals to surface probable causes fast. In a live incident, that means my team isn't hunting through dashboards manually.
IBM Instana Key Features
- Smart Alerts with adaptive thresholds: Instana's alerting engine uses statistical baselines and prebuilt blueprints to detect incidents, with grouped alerts and routing to Slack, PagerDuty, email, and webhooks.
- Distributed transaction tracing: Instana traces requests across application components with zero sampling, capturing code-level detail across databases, browser, and mobile layers.
- OpenTelemetry Collector integration: Instana ingests telemetry from the OpenTelemetry Collector to monitor microservices and cloud-native applications alongside natively instrumented components.
- Kubernetes cost insights: Instana provides out-of-the-box dashboards and historical spend analysis for monitoring resource costs across Kubernetes clusters.
IBM Instana Integrations
IBM Instana supports 300+ technologies, including Slack, PagerDuty, OpenTelemetry Collector, Splunk, Amazon EC2, AWS RDS, Google Cloud, Kubernetes, and VMware Tanzu. REST and GraphQL APIs plus SDKs support custom integrations.
Pros and Cons
Pros:
- Fast telemetry helps pinpoint service issues
- Automatic discovery reduces manual instrumentation
- Real-time dependency maps aid incident triage
Cons:
- Alert volumes often need manual filtering
- Network-device gaps can require separate monitoring
Learn more about IBM Instana: Best for unified, flexible observability
- Free plan available
- From $19/month
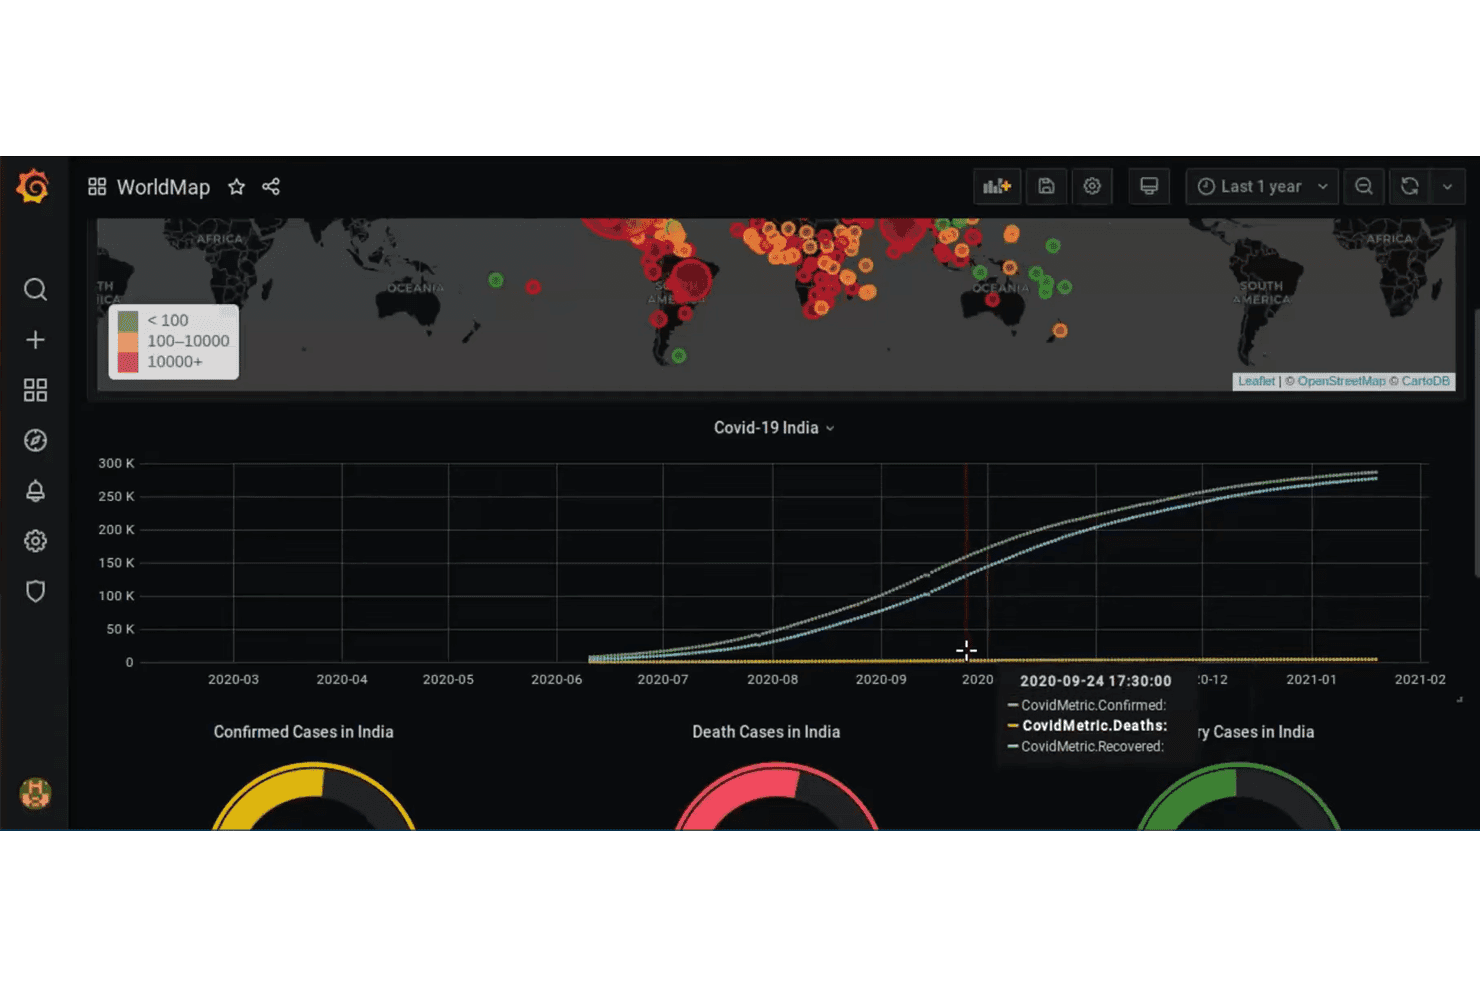
Grafana dashboard visualizing global and India COVID-19 case data over time as maps and time-series charts. Grafana Cloud is a managed observability platform that unifies metrics, logs, traces, and profiles in one place, making it a strong fit for DevOps engineers and IT operations teams who need flexible, open-standards monitoring across cloud, hybrid, and containerized environments.
Who Is Grafana Cloud Best For?
Grafana Cloud is a strong fit for DevOps engineers and IT operations teams who want to unify metrics, logs, traces, and profiles across cloud-native and hybrid environments using open standards like OpenTelemetry and Prometheus.
Why I Picked Grafana Cloud
I've included Grafana Cloud in my top picks because it brings metrics, logs, traces, and profiles together in one managed platform, which is exactly what you need when LogicMonitor's siloed approach starts to feel limiting. I particularly like the Knowledge Graph, which maps relationships across services, Kubernetes workloads, databases, and infrastructure so you can trace a latency spike through distributed traces down to a database bottleneck without jumping between tools. The AI-powered Investigations feature can automatically analyze that telemetry, form hypotheses, and return a structured report when an alert fires.
Grafana Cloud Key Features
- Adaptive Telemetry: Automatically aggregates, samples, or drops lower-value telemetry across metrics, logs, traces, and profiles to control data volume and costs.
- Synthetic monitoring: Checks API endpoints and web applications from probes worldwide, supporting HTTP/HTTPS, DNS, TCP, and ICMP Ping checks for availability and performance.
- Grafana Alloy collector: An open-source OpenTelemetry collector with Prometheus pipeline support that handles metrics, logs, traces, and profiles from your existing infrastructure.
- RBAC with custom roles: Lets you assign granular permissions to users, teams, and service accounts, with custom roles scoped to specific actions across dashboards and data sources.
Grafana Cloud Integrations
Grafana Cloud offers 150+ data source integrations, including AWS, Microsoft Azure, Google Cloud, SNMP, VMware vSphere, and LogicMonitor Devices. REST, HTTP, Grafana Cloud, tracing, and Synthetic Monitoring APIs, plus webhooks, support custom integrations.
Pros and Cons
Pros:
- Knowledge Graph links anomalies to causes
- Cross-signal views support incident investigation
- Flexible dashboards bring telemetry together
Cons:
- Advanced alert rules take configuration effort
- SNMP setup needs manual device configuration
Learn more about Grafana Cloud: Best for integrated IT solutions
- 30-day free trial available
- Pricing upon request
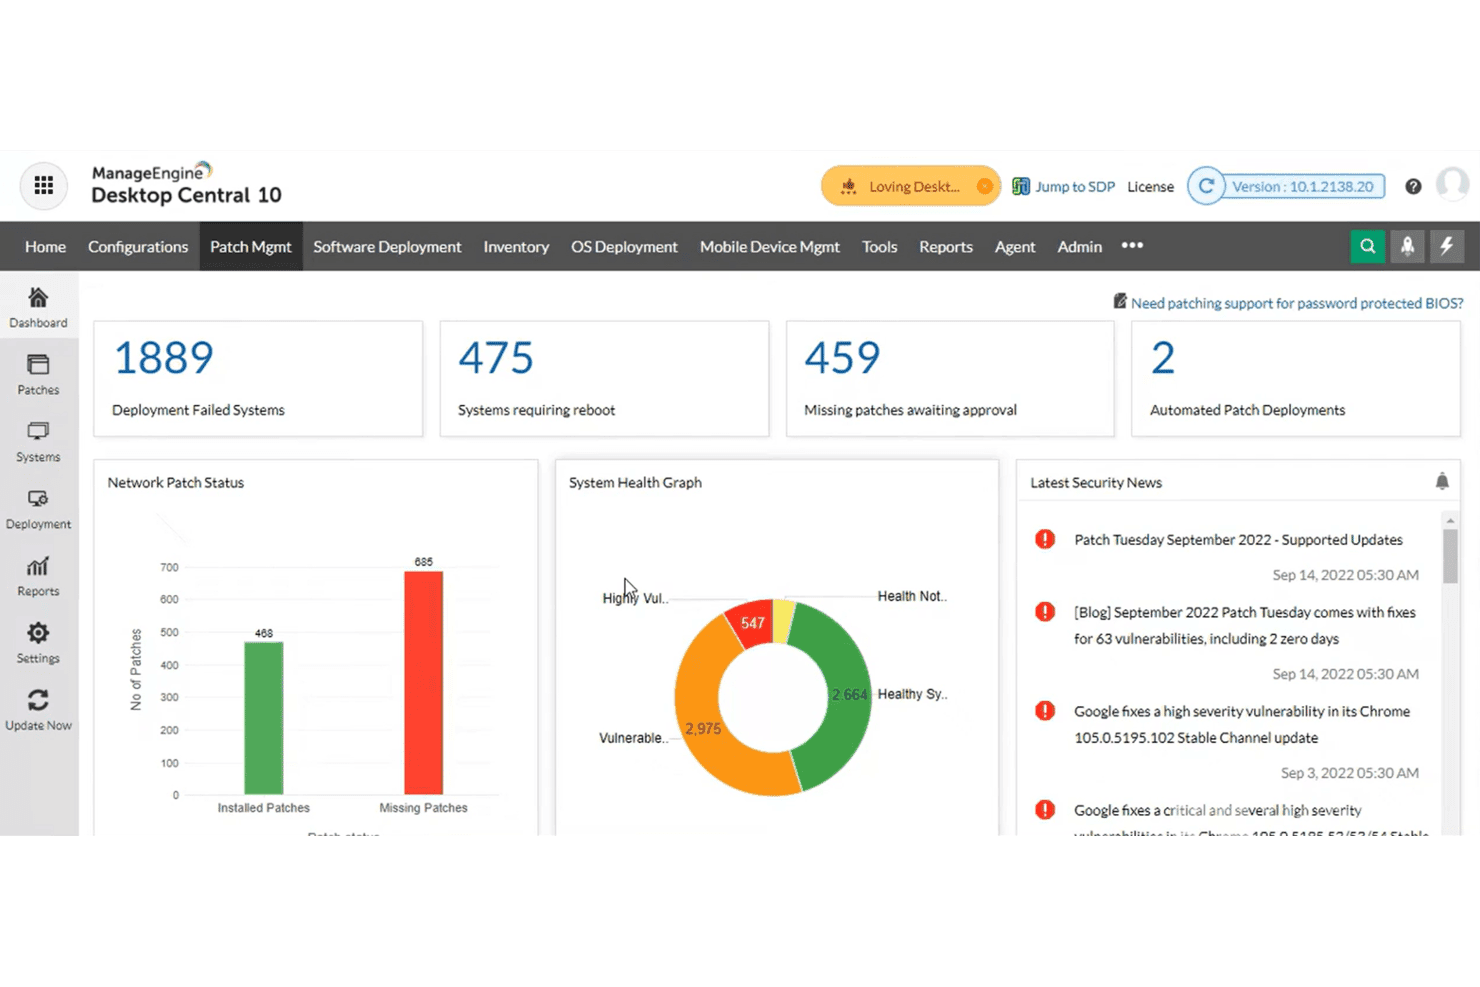
ManageEngine Desktop Central 10 patch management dashboard showing network patch status and system health. ManageEngine OpManager is a network and infrastructure monitoring platform that appeals to IT operations teams managing complex on-premises environments, offering deep visibility across devices, servers, storage, and virtual infrastructure with AI-driven forecasting and code-free workflow automation.
Who Is ManageEngine Best For?
ManageEngine OpManager is a strong fit for IT operations teams managing large on-premises environments who need deep infrastructure visibility without paying SolarWinds-level prices.
Why I Picked ManageEngine
I picked ManageEngine OpManager because it covers the full infrastructure stack in one place, which is exactly what you need when replacing LogicMonitor. I particularly like its topology mapping, which automatically builds Layer 2 network maps so you can trace a fault from an alert directly to the affected segment without digging through separate tools. Its AI-driven capacity planning forecasts when devices will hit memory thresholds, letting you act before an outage happens.
ManageEngine OpManager Key Features
- Code-free workflow automation: A drag-and-drop builder lets you create workflows that trigger on network faults or on a schedule to manage services, processes, files, and folders automatically.
- 3D data center floor view: Renders a real-time 3D replica of your data center and its racks, showing live device status directly within the physical layout.
- Problem and Event Correlation: Groups related alerts into a single Problem record with severity, correlation method, and a noise-reduction percentage to cut alert fatigue.
- MCP Server integration: Lets AI clients like Claude Desktop or Cursor query OpManager monitoring data, including device health, alarms, and performance trends, through natural-language prompts.
ManageEngine Integrations
ManageEngine OpManager offers native integrations with ServiceNow, Jira Service Management, Microsoft Teams, Slack, Grafana, Microsoft Sentinel, and ManageEngine ServiceDesk Plus. Its REST API uses OpenAPI documentation, and webhooks support custom integrations.
Pros and Cons
Pros:
- Capacity forecasts flag resource shortages early
- Topology maps help trace faults to affected segments
- Unified visibility across networks, servers, and storage
Cons:
- Custom reports can take time to configure
- Default alert profiles can generate excessive notifications
Learn more about ManageEngine: Best for customizable dashboard
- Free plan + 30-day trial + demo available
- From $200/month (billed annually)
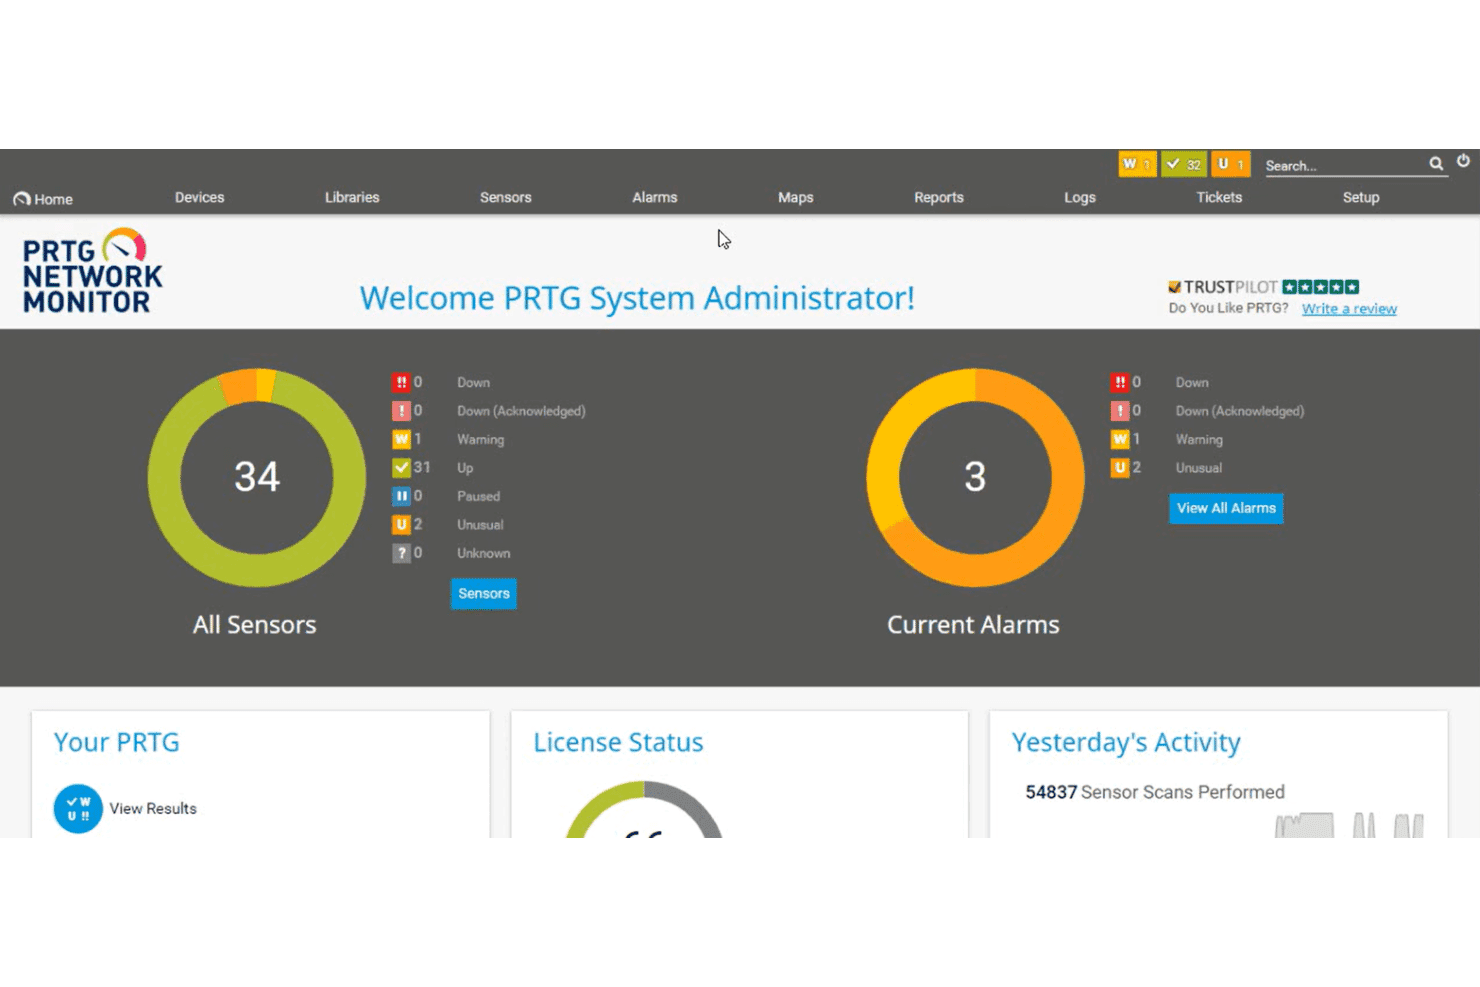
The PRTG Network Monitor dashboard summarizing sensor status and current alarms at a glance. Paessler PRTG is an on-premises network monitoring tool that appeals to network administrators and IT teams who need broad visibility across IT, OT, and IoT infrastructure—covering devices, traffic, servers, and applications from a single platform.
Who Is Paessler PRTG Best For?
PRTG is a strong fit for network administrators and IT teams managing on-premises or hybrid environments who need a highly visual, sensor-based monitoring setup they can tailor to their infrastructure.
Why I Picked Paessler PRTG
I picked Paessler PRTG as one of the best LogicMonitor alternatives because its dashboard and map customization goes deeper than most tools I've tested. I can build infrastructure views with a drag-and-drop editor, layer in device status icons, geographical maps, and custom HTML backgrounds, then share them publicly or embed them via iFrame. With over 300 available widgets, I'm able to create NOC-style displays that make site-wide issues visible at a glance without digging through menus.
Paessler PRTG Key Features
- Sensor-based auto-discovery: Scans network segments using ping, SNMP, and WMI, then automatically applies device and sensor templates to begin monitoring.
- Multi-channel alerting with escalation: Sends notifications via email, SMS, push, Teams, or Slack, with configurable escalation levels and scheduled alert windows.
- AI-driven anomaly detection: Analyzes historical sensor data to establish baselines and alerts when monitored values deviate from expected patterns.
- Scheduled and on-demand reporting: Generates reports in HTML, PDF, CSV, or XML for individual sensors or groups, on a set schedule or triggered manually.
Paessler PRTG Integrations
Paessler PRTG offers native integrations with Microsoft Teams, Slack, and PagerDuty. It also provides REST APIs for custom integrations and monitoring XML or JSON data.
Pros and Cons
Pros:
- Escalation alerts help catch service problems early
- Auto-discovery covers varied infrastructure sensors
- Custom maps make site issues visible
Cons:
- Cloud monitoring depth trails provider-focused platforms
- Root-cause topology requires separate paid extension
Learn more about Paessler PRTG: Best for open-source observability
- 30-day free trial + free demo available
- From $49/month
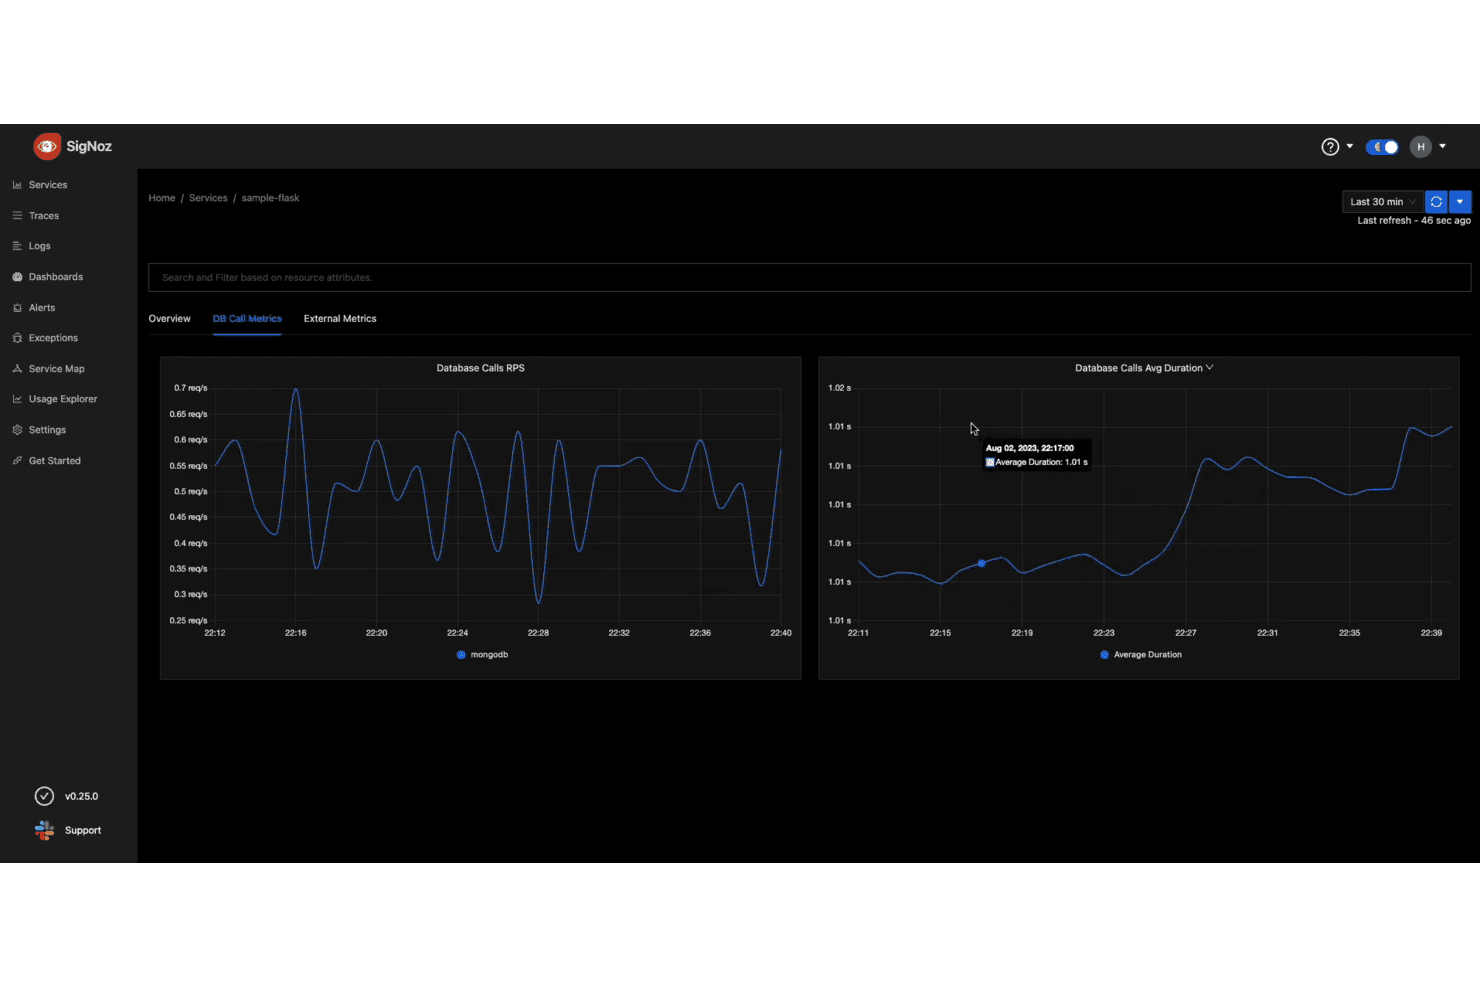
SigNoz service view showing MongoDB database call rate and average duration over time. SigNoz is an OpenTelemetry-native observability platform that appeals to DevOps engineers and infrastructure teams who want unified logs, metrics, and traces without the opaque per-host billing that comes with tools like Datadog or New Relic.
Who Is SigNoz Best For?
SigNoz is a strong fit for DevOps engineers and platform teams who want full control over their observability stack without paying per-host fees.
Why I Picked SigNoz
I picked SigNoz as one of the best because it's the only OpenTelemetry-native platform on this list that lets you self-host your entire observability stack without per-host fees or vendor lock-in. I love that it unifies logs, metrics, and traces in one place, so when an alert fires, I can jump straight from a Service Map edge showing elevated P99 latency into the correlated trace and log without switching tools. The AI-assisted alert correlation via the MCP server is a genuinely useful layer on top of that, letting me quantify which upstream service is responsible for a spike before I even open a terminal.
SigNoz Key Features
- Multi-signal alerting: Create alerts on metrics, logs, traces, exceptions, and anomalies, with routing policies that direct notifications to Slack, PagerDuty, Opsgenie, Microsoft Teams, email, or webhooks.
- OpenTelemetry-native instrumentation: Collect and forward telemetry from applications, hosts, Kubernetes, and cloud services using the OpenTelemetry Collector without proprietary agents.
- Query Builder: Filter, aggregate, and apply mathematical functions across logs, metrics, and traces from a single interface, with PromQL and ClickHouse SQL also supported.
- SOC 2 Type II and HIPAA compliance: SigNoz Cloud meets SOC 2 Type II and HIPAA standards, with data centers available in the US, EU, and India.
SigNoz Integrations
SigNoz documents 112 integrations, including AWS, Azure, Google Cloud Platform, PostgreSQL, MySQL, Redis, MongoDB, NGINX, and RabbitMQ. It also provides an API for custom integrations and supports OpenTelemetry Collector connections for SNMP-enabled firewalls, routers, and switches.
Pros and Cons
Pros:
- AI-assisted alert correlation speeds fault triage
- Logs, metrics, and traces share investigations
- Self-hosting keeps telemetry under your control
Cons:
- Self-hosted ClickHouse needs ongoing tuning
- SNMP polling requires manual OID mapping
Learn more about SigNoz:
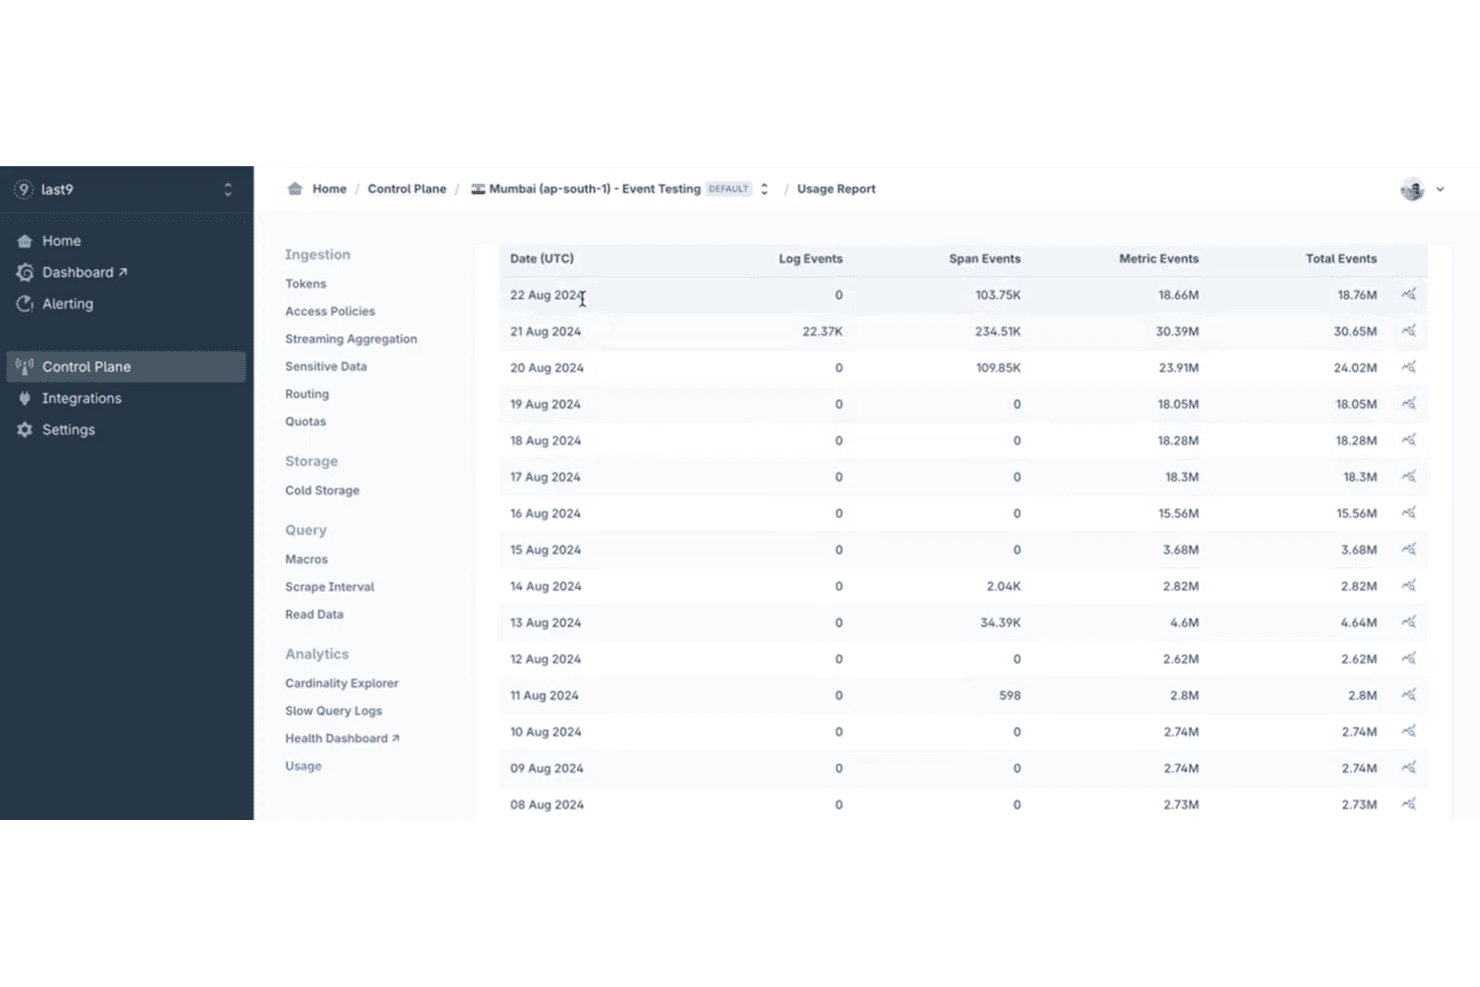
Last9 Control Plane usage report showing daily log, span, and metric event volumes by date. Last9 is an OpenTelemetry-native observability platform built for DevOps and engineering teams who need to unify metrics, logs, and traces—with AI-driven investigation and high-cardinality support that makes it a strong fit for teams outgrowing cost-heavy monitoring tools.
Who Is Last9 Best For?
Last9 is a strong fit for DevOps and site reliability engineering teams that need OpenTelemetry-native observability with AI-driven investigation built in.
Why I Picked Last9
I picked Last9 as one of the best because its AI-native investigation goes deeper than a typical alert dashboard. Last9 AI can query your live metrics, logs, and traces together, then surface correlated evidence and propose alert rules or dashboards for your approval. Its Discover Map visualizes real-time service-to-service dependencies with error rates and P95 latency, so when an incident fires, I can trace the blast radius across microservices without manually stitching signals together.
Last9 Key Features
- OpenTelemetry-native ingestion: Last9 natively collects metrics, logs, and traces via OpenTelemetry, with no vendor-specific agents required.
- PromQL and LogQL alerting rules: Alert rules can be written directly in PromQL or LogQL, or built using a guided UI rule builder.
- Tiered metrics retention: Data is stored across Blaze, Hot, and Cold tiers, retaining up to one year by default without downsampling or rollups.
- SNMP-based network device monitoring: Last9 collects telemetry from switches, routers, firewalls, and UPS units using the OpenTelemetry Collector SNMP receiver or Prometheus SNMP Exporter.
Last9 Integrations
Last9 lists 100+ integrations, including AWS, Azure, Google Cloud, Kubernetes, Prometheus, Grafana, Slack, Datadog, and New Relic. It also offers a REST API and MCP server for custom integrations and AI-agent workflows.
Pros and Cons
Pros:
- Users praise focused, actionable alerts
- Reviewers report faster cross-service debugging
- Correlates logs, metrics, and traces with AI
Cons:
- Some reviewers report dashboard refresh delays
- On-premises platform hosting isn’t documented
Learn more about Last9:
Outras alternativas ao LogicMonitor
Eis algumas alternativas adicionais ao LogicMonitor que não entraram na minha lista, mas que ainda vale a pena conhecer:
- 11NinjaOneBest for endpoint management
- 12AppDynamicsBest for application performance tracking
- 13New RelicBest for full-stack observability
- 14AuvikBest for cloud-based network monitoring
- 15ManageEngine OpManagerBest for network performance insights
- 16NagiosBest for open-source monitoring
- 17NetdataBest for real-time health monitoring
- 18Better StackBest for real-time incident response
- 19eG InnovationsBest for end-user experience tracking
- 20Amazon CloudWatchBest for AWS resource monitoring
- 21ScienceLogicBest for hybrid IT environments
- 22ObkioBest for network performance optimization
- 23Azure MonitorBest for Azure service insights
How I Evaluate LogicMonitor Alternatives
I evaluate every option through two layers: the baseline a tool must hit—hybrid monitoring, flexible collection, intelligent alerting—and what sets the best apart.
Core Functionality (Table Stakes For This List)
When I'm selecting tools for my list, I rank each one on a scale from 0 (does not offer the functionality) to 5 (excels in this area) for each core functionality listed below. Then, I calculate the tool's total score into a percentage. Each tool needs to achieve a minimum total score of 75% to be considered for inclusion.
- Hybrid Infrastructure Monitoring: I check whether each tool can pull metrics from on-prem servers, cloud workloads, containers, and network gear in a single view.
- Flexible Data Collection Methods: Each tool should support agent-based and agentless collection via protocols like SNMP, WMI, and REST APIs to cover diverse environments.
- Intelligent Alerting & AIOps: I look for dynamic thresholds and alert correlation that cut through noise, not just static rules that flood your inbox during a routine spike.
- Dashboards & Reporting: Good dashboards let you build SLA-focused views for leadership and deep-dive panels for engineers without needing a separate BI tool.
- Integration Ecosystem: I evaluate how well each tool connects to ITSM platforms, chat tools, and automation systems your team already relies on day-to-day.
- Scalable Multi-Tenant Architecture: For MSPs and distributed teams, I look at RBAC granularity, tenant isolation, and whether you can scope views per client or business unit.
Once I have a list of tools that meet this criteria, I consider what sets each platform apart.
Differentiating Factors (What Sets Vendors Apart)
Here's how I compare and contrast different vendors:
Standout Features
Auto-discovery with topology mapping is a big differentiator. When a tool maps service dependencies on its own, your team spends less time documenting infrastructure and more time acting on real issues. I also look for built-in log analytics and APM alongside infrastructure metrics—tools like Datadog and Dynatrace bundle these, which means fewer context switches. Event-triggered automation matters too, especially when your team needs to kick off remediation runbooks or track config drift directly from the monitoring platform.
Beyond Features
Pricing transparency matters when you're moving away from LogicMonitor. I evaluate whether a vendor charges per device, per host, or by data ingestion—and how predictable costs stay as your environment scales. Deployment flexibility is another key factor. Some teams need SaaS, while others in regulated sectors require self-hosted or air-gapped options; tools like Zabbix and PRTG offer on-prem models, while Datadog is SaaS-only. I also consider time-to-value: how quickly can you go from initial setup to meaningful dashboards and actionable alerts?
Por que procurar uma alternativa ao LogicMonitor?
Embora o LogicMonitor seja uma boa opção de software de produtividade, existem vários motivos pelos quais alguns utilizadores procuram soluções alternativas. Pode estar à procura de outra opção porque:
- Precisa de mais opções de personalização
- A sua equipa necessita de uma melhor escalabilidade
- Pretende reduzir custos
- A sua empresa necessita de integrações específicas
- Procura interfaces de utilizador mais simples
- Precisa de um melhor apoio regional
Se alguma destas situações lhe é familiar, veio ao lugar certo. A minha lista inclui várias opções de software de produtividade mais adequadas para equipas que enfrentam estes desafios com o LogicMonitor e procuram soluções alternativas.
Funcionalidades
Eis algumas das principais funcionalidades do LogicMonitor para ajudar a contrastar e comparar o que as soluções alternativas oferecem:
- Monitorização unificada: Disponibiliza uma monitorização abrangente da infraestrutura, da nuvem e da gestão de registos, com suporte para os principais fornecedores de serviços na nuvem.
- Integração de AIOps: Utiliza ferramentas baseadas em IA para inteligência de eventos e automatização, melhorando a eficiência operacional.
- Análise preditiva: Disponibiliza análise da causa raiz e informações sobre os serviços para melhorar a resolução de incidentes.
- Integrações abrangentes: Oferece mais de 3 000 integrações tecnológicas para um dimensionamento dinâmico e resiliência.
- Painéis personalizáveis: Permitem criar e partilhar painéis em tempo real adaptados às suas necessidades específicas.
- Deteção de anomalias: Identifica proativamente comportamentos invulgares para evitar um impacto nos utilizadores.
- Limiares dinâmicos: Define automaticamente limiares inteligentes com base em dados históricos.
- API e integrações: Expande a funcionalidade através de APIs e integrações em várias tecnologias.
- Suporte para a nuvem e para várias nuvens: Monitoriza contentores e os principais fornecedores de serviços na nuvem, como AWS, Google Cloud, Microsoft Azure e Oracle Cloud.
- Gestão de registos: Disponibiliza funcionalidades de gestão e análise de registos.