A Complete Guide to Infrastructure Monitoring


IT systems are more complex than ever, and the amount of money businesses invest in them hits record highs yearly, so businesses can’t afford to overlook the importance of staying on top of their infrastructure. Infrastructure monitoring is your secret weapon to avoid unexpected downtime, performance hiccups, or security vulnerabilities.
Are you in charge of managing on-premises servers, cloud environments, or a hybrid setup? You need a process for tracking and analyzing your systems, networks, and services in real time to ensure everything is operating efficiently.
In this complete guide to infrastructure monitoring, you’ll learn how to keep a close eye on your entire IT ecosystem, from hardware to software, and detect potential issues before they impact your business. I'll cover the key tools and best practices for setting up a robust monitoring system and dive into some of the challenges IT leaders face, like managing the insane volume of data or integrating monitoring across multiple platforms. I’ve got tips to help you navigate those rough patches.
Let's make sure you’re set up for success!
What is Infrastructure Monitoring?
Infrastructure monitoring keeps tabs on and collects metrics around digital systems such as servers, virtual machines, containers, and databases. It tracks statistics like uptime, performance, and resource usage to produce insights that drive operations decisions on the back end.
Most of the infrastructure monitoring tools I’ve used over the years visualize the metrics they track with features like graphs and charts, making it easier to interpret activity over time and identify trends.
How Does Infrastructure Monitoring Work?
You’ll need to start by integrating your chosen infrastructure monitoring tool into your system before getting started. They have different procedures based on what kind of monitoring you want to implement, as you’ll see later in this article. Check with your vendor for a starter guide.
After it’s up and running, you can use it to keep track of the three main layers of your IT infrastructure:
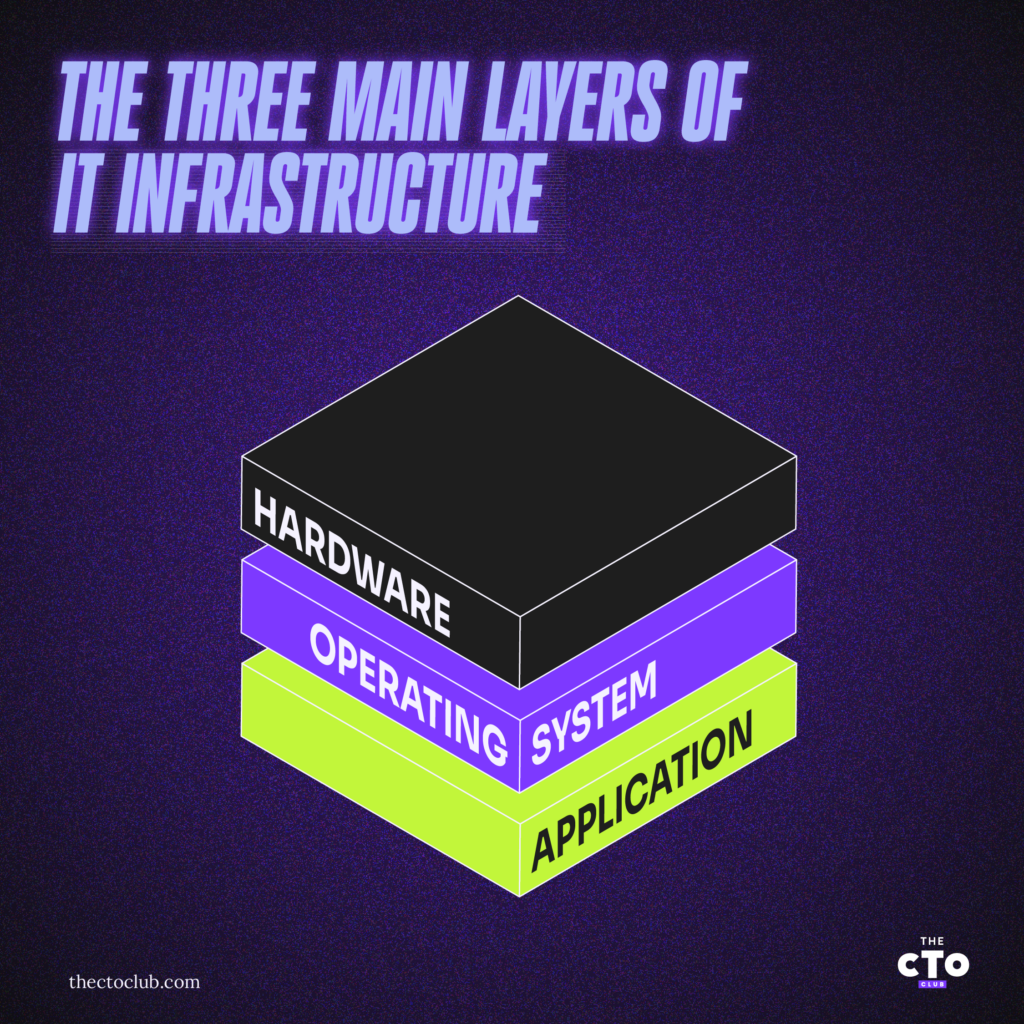
- Hardware: This layer comprises the physical infrastructure components, including processors, memory, and storage devices
- Operating system: The OS is the intermediary between the hardware and application layers of a tech stack
- Application: This layer includes software that handles business flows
The general process under which an IT infrastructure monitor works involves the following steps:
- Discovery: The monitor scans your infrastructure to locate all components it will be in charge of across all three layers of the tech stack.
- Mapping: It then identifies and marks all the dependencies and locations of the components.
- Collection: Monitors usually spend the most time collecting data from the components they discover, including application logs and metrics like performance. Depending on the kind of monitor you have, this process might also involve errors and vulnerabilities.
- Analytics: The monitor uses the data it collects to derive insights, either automatically or by providing the user with tools to do so, with visualizations provided as a default.
- Visibility: The ultimate goal of any monitor is to introduce observability to IT infrastructure, and it’s what you’ll be working towards with all the other steps in the process.
All these steps are continuous, even those I’ve described as happening during setup. They often happen concurrently because, as your infrastructure grows, the monitor should be able to adapt to provide you with maximum observability.
What Features Does Infrastructure Monitoring Include?
Some of the main features of infrastructure monitoring tools include:
- Log management and telemetry: IT infrastructure monitoring tools should allow you to collect various metrics and statistics from different sources and then aggregate them in one place where you can access them.
- Visualization: You’ll almost certainly get large amounts of data even from a small IT system, and the ability to visualize it into objects such as graphs, charts, and heatmaps makes it easier to extract information from everything.
- Analytics: This complements visualization by having the software run tests at scale to derive insight from your data that you can use to drive business decisions. The tests could be anything from comparing multiple datasets to revealing trends from just one.
- Reporting: This allows you to get more information on the status of your infrastructure, and you’ll usually have the option to configure whether you want detailed or brief reports. I’ve also found that most major monitoring tools allow you to schedule when to get the reports and sometimes even where you want them sent.
- Error, request, and incident management: These features allow you to flag issues and track them all the way to resolution. In this category, you’ll find things like tickets, error groups, alerts, and notifications to help you and your team manage issues more effectively.
- Automation: These allow you to reduce time spent on repetitive tasks such as setting up and controlling workflows, testing, dependency mapping, and release validation.
- Cost optimization: Many of the tools in this field are usage-based, and it’s not unheard of for the spend to get out of hand as operations grow. For this reason, a valuable feature is the option to configure them so they don’t cross a certain threshold or alert you when they’re close so you can rein things in.
- Full-stack observability: A good monitoring solution should give you visibility into your entire tech stack, including endpoints and dependencies. A unified platform that you can use to manage your entire system goes a long way toward sprawl control and cost optimization.
- Cloud agnostic architecture: Infrastructure monitoring tools shouldn’t lock you into one cloud platform, even if a cloud provider offers them. They might have additional perks for using them on one platform over another, but generally, it’s common practice to allow you to choose where to use them.
-

Atera
Visit WebsiteThis is an aggregated rating for this tool including ratings from Crozdesk users and ratings from other sites.5 -
Dynatrace
Visit WebsiteThis is an aggregated rating for this tool including ratings from Crozdesk users and ratings from other sites.4.5 -
Datadog
Visit WebsiteThis is an aggregated rating for this tool including ratings from Crozdesk users and ratings from other sites.4.3


Types of Infrastructure Monitoring
There are two types of infrastructure monitoring: agent-based and agentless. The difference is in how you set them up to interact with your IT infrastructure.
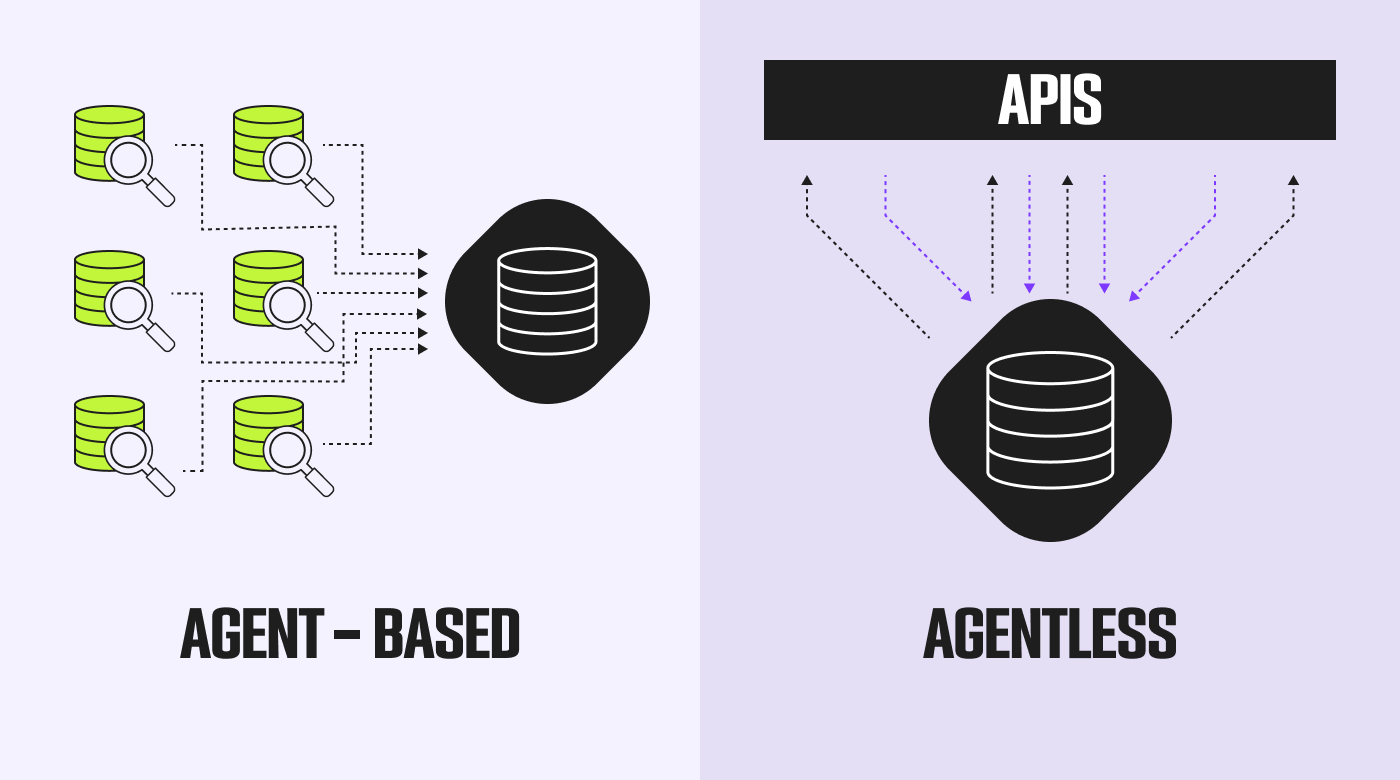
Agent-based monitoring requires you to install a tool so it can collect data directly from what you’re monitoring. Say you want to observe bare metal servers with an agent-based approach, then you’d need to install a monitor onto each one.
As such, agents can collect a lot more data from the infrastructure on a granular level and provide more reliable rates of availability, but they often require more technical expertise and time to set up and maintain.
Agentless monitoring, on the other hand, works by using APIs and protocols to collect data, usually from packets as they move between components.
For this reason, agentless monitors are often cheaper and easier to set up, but you’d get fewer metrics and have functionality rest on the network remaining healthy.
Ultimately, the right solution depends on what you want to get out of your monitoring strategy, and luckily, you can use both simultaneously. I’ve used agents on critical components and agentless on everything else, all for the same infrastructure.
What IT Infrastructure Should You Monitor?
You should use your infrastructure monitoring solution to keep an eye on the following:
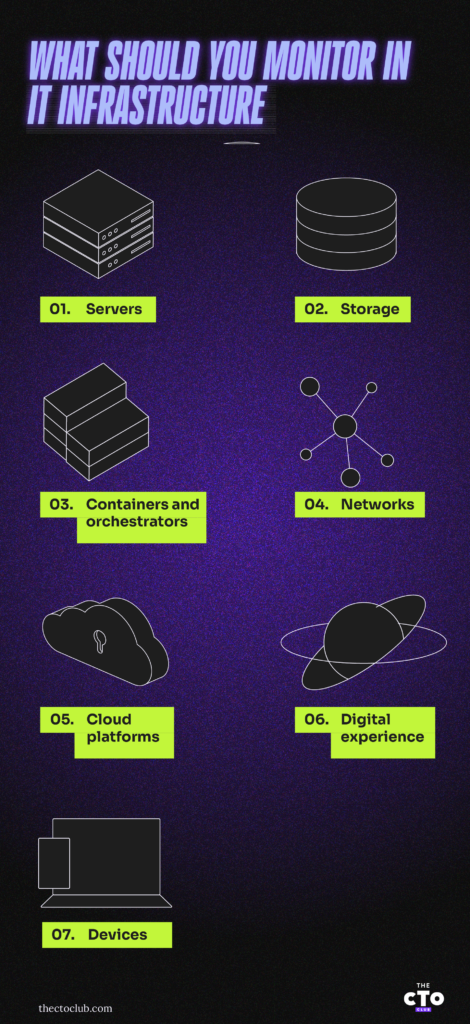
- Servers: By monitoring these, you can maintain the overall system security and availability.
- Storage: Manage these to keep your data and other assets from being compromised via breaches and leaks.
- Containers and orchestrators: If these are healthy, your containerized applications run better.
- Networks: Knowing about incoming and outgoing traffic helps you provide a better experience, implement load balancing, and respond effectively to DDoS attacks.
- Cloud platforms: You can monitor things like capacity and resource utilization for availability and cost control.
- Digital experience: By monitoring how various factors tied to your infrastructure affect the user experience across your touchpoints, you can increase retention.
- Devices: If your IT infrastructure consists of several endpoints, monitoring them helps ensure they’re secure and well-functioning.

Why Do You Need Infrastructure Monitoring?
Throughout my career in software development, I’ve seen first-hand the benefits that infrastructure monitoring tools provide to various teams, including DevOps and ITOps.
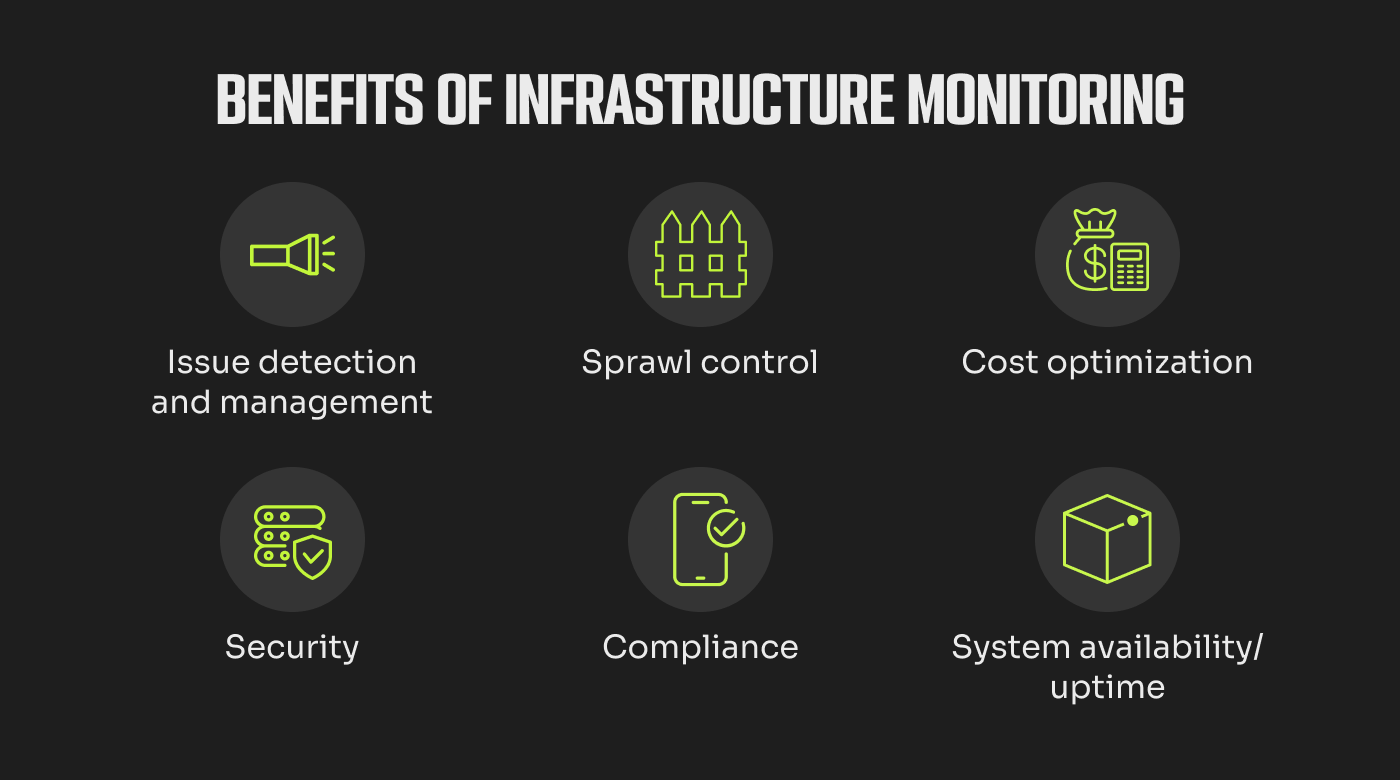
The benefits of infrastructure monitoring include:
1. Issue Detection and Management
Most infrastructure monitoring solutions continuously scan your environments for any issues or anomalies. Whenever they detect anything unusual, they’ll send a notification with remediation guidelines to address them as soon as possible.
A recent study revealed that 32% of enterprise infrastructure contains critical vulnerabilities that hackers target, so it’s crucial that you set up a system to deal with these issues before they have a chance to impact your business.
2. Sprawl Control
IT sprawl is one of the biggest problems that growing companies face. It refers to the uncontrolled growth of IT systems and applications, which can introduce security vulnerabilities into your infrastructure and reduce productivity. With a good IT monitoring solution, you can take advantage of a unified observability platform and keep IT sprawl under control.
3. Cost Management
With an IT monitoring solution, you can keep a closer eye on your spending across different systems so it doesn’t balloon out of control. This benefit is most apparent when dealing with anything on a usage-based pricing model like cloud computing platforms where the actual usage isn’t easy to determine ahead of time.
Infrastructure monitors give you tools to either keep your spending from going above a hard limit or alert you when costs are close to growing beyond a predetermined level.
4. Security
With most leading infrastructure monitoring tools on the market today, you’ll get automated continuous system scans that can detect anomalies and act on them to prevent both known and emerging security threats.
You can also expect the tool to assist you with remediation and mitigation so you understand the problem and know how to address similar events in the future.
If you’re working with on-premise infrastructure, you can offload some security functions to one of these tools so you can focus on other areas of growth. Personally, I’ve found the fact that they automatically encrypt data in transit to be good for peace of mind when I’m self-hosting.
5. Compliance
For anyone whose company is in a highly regulated industry, such as finance, healthcare, or education, the right IT infrastructure tools could make compliance as easy as a single click. They scan your infrastructure and generate reports that help you demonstrate compliance with data standards like HIPAA, ISO, and more.
As for audits, these tools can also run checks and generate logs and reports that you can submit to the relevant oversight bodies, and they can also go the extra mile and provide systems that let you grant auditors temporary access to your IT infrastructure.
6. System Availability/Uptime
Infrastructure monitoring tools can be a big help to DevOps and ITOps teams because they provide functions that help you keep systems up and running.
The main ones have to do with performance monitoring for statistics such as regression, but the advantages are also present with features that let you resolve issues in less time, ship products quicker, and generally be more proactive.
If you’re still on the fence about all this, you should know that the results are tangible. The Bank of New Zealand switched to a cloud-first system. Five years after implementing the proper infrastructure monitoring solution, the institution reported that major service incidents were down 94%, and high-quality software releases were up 58%.
How to Choose an Infrastructure Monitoring Solution
There’s no shortage of infrastructure monitoring tools on the market.

When shopping around for an infrastructure monitoring solution, some of the criteria you should keep in mind include the following:
- Industry-specific features: If you’re in a niche industry or one that’s more regulated than most, look for options that cater to your specific use cases, with features like compliance management.
- Scope: Your IT infrastructure could easily comprise several different systems, including things like servers, cloud platforms, and endpoints, and you should find a monitoring tool that covers all of them to avoid sprawl.
- Scalability: Your chosen IT monitor should be able to grow along with your operations, so you’re not scrambling to find a replacement when it stretches further than it was designed to.
- Customer support: This is mainly for teams with limited technical expertise and/or ones going with fully managed options. If you’ve assessed your situation and determined you’re likely not going to be able to resolve a potentially serious issue internally, you should prioritize solutions whose customers have explicitly pointed out the quality of support.
- Security: Start with encryption and user access control as the bare minimum, then look for features like patch management, anomaly and threat detection, and vulnerability management to lead you from there.
- Cost: While some infrastructure monitors provide flat rates, many pricing models are usage-based, and I recommend contacting the vendor directly to calculate what figures you can expect based on your current and future needs.
- Integrations: You might need to connect to other tools to get the most out of your monitoring platform, including tools for collaboration like Jira and Google Workspace, source control like GitLab and GitHub, and orchestration like Kubernetes and OpenShift.
Best Infrastructure Monitoring Tools
Some of the best infrastructure monitoring tools I’ve used and really liked over the past couple of years in DevOps roles include the following:
1. Grafana - Best open-source option
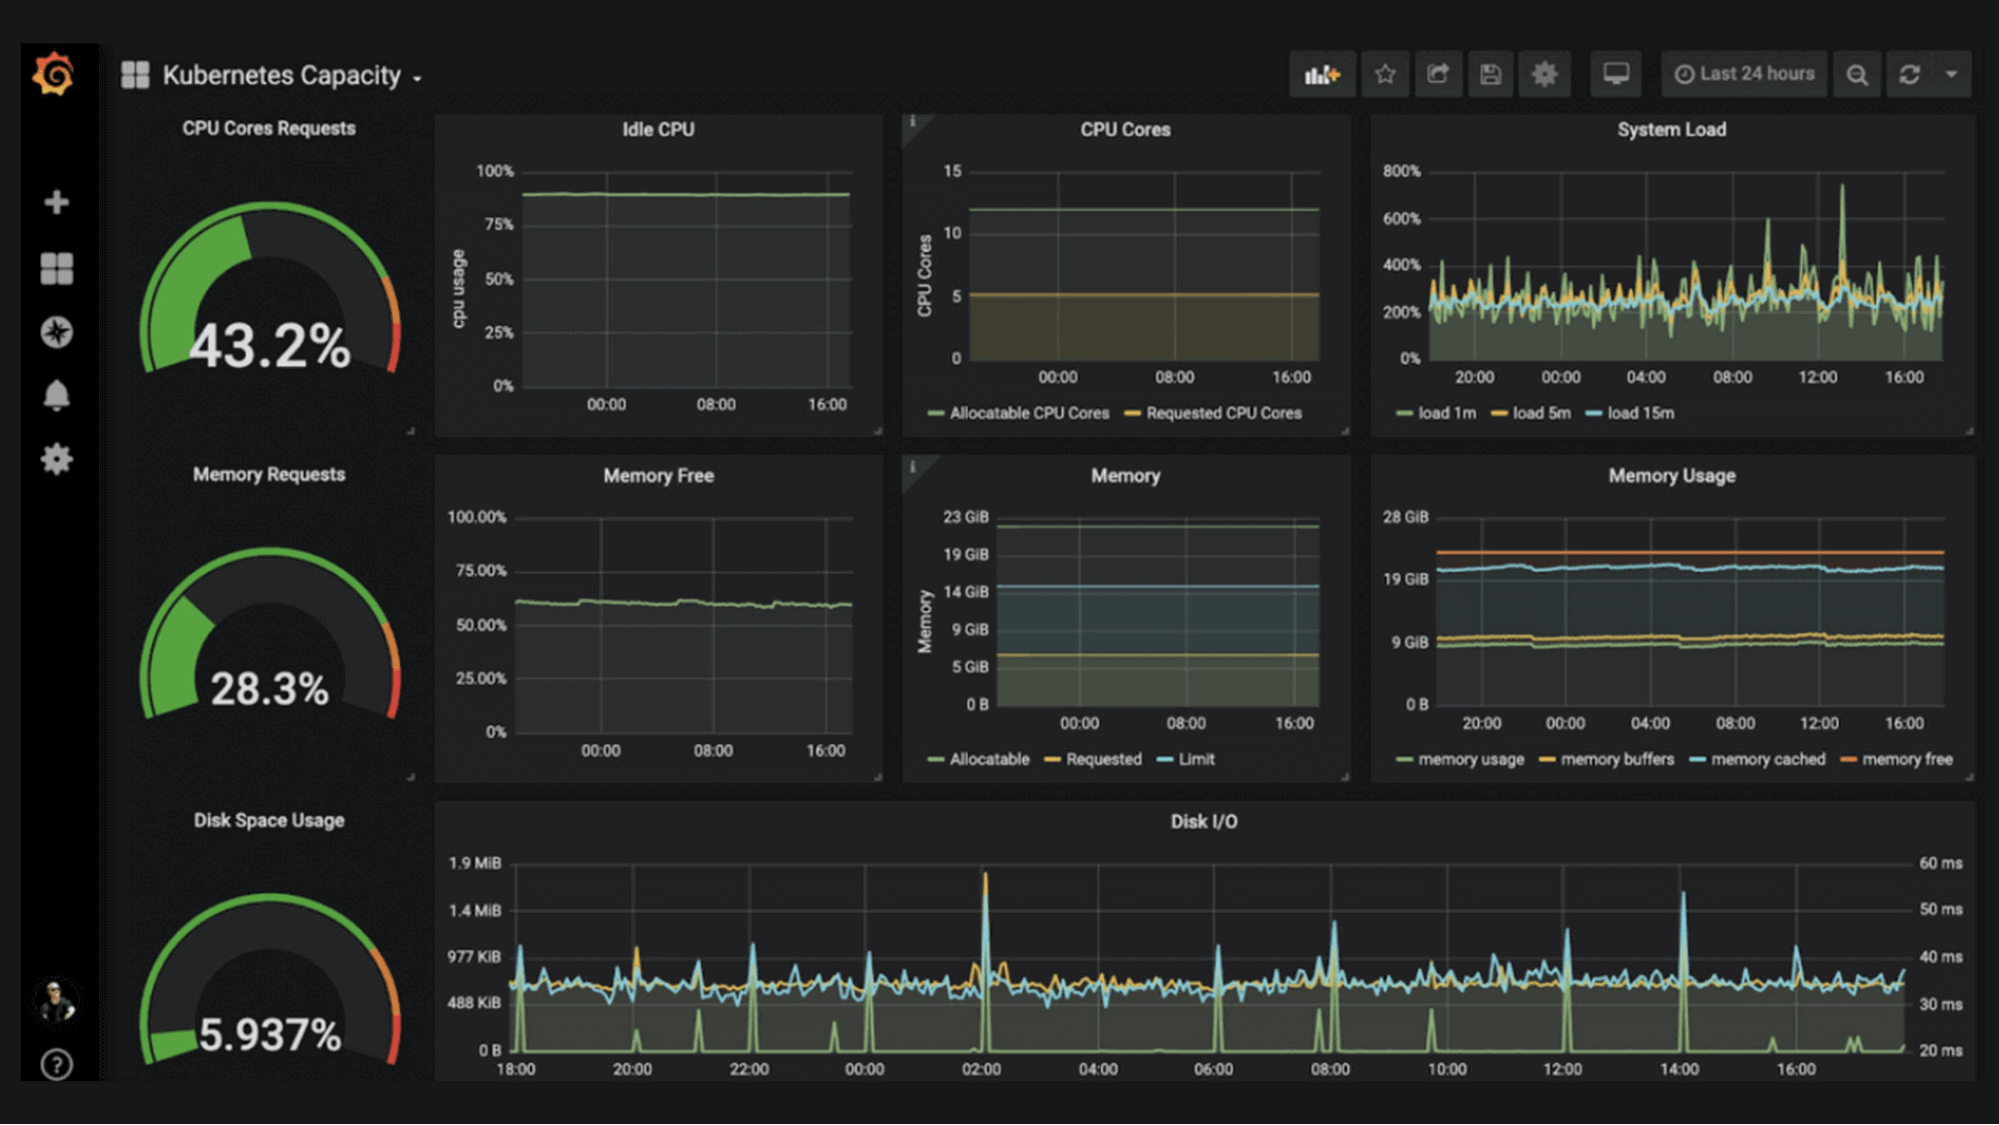
Grafana is an open-source observability platform from Grafana Labs that you can use on-premise with the OSS version or in the cloud.
If you’ve never used any monitoring tool before, I recommend checking out their online demo to get an idea of what the platform is like. It’s accessible from their website’s homepage, free, and you don’t need to sign up for or install anything.
One of Grafanna’s biggest strengths is in the visualizations it gives you and how much you can configure what you want to see. For infrastructure monitoring, it provides you with the ability to achieve full-stack visibility with its LGTM stack:
- Loki for logs
- Grafana for visualizations
- Tempo for traces
- Mimir for metrics
2. Amazon CloudWatch - Best logging features
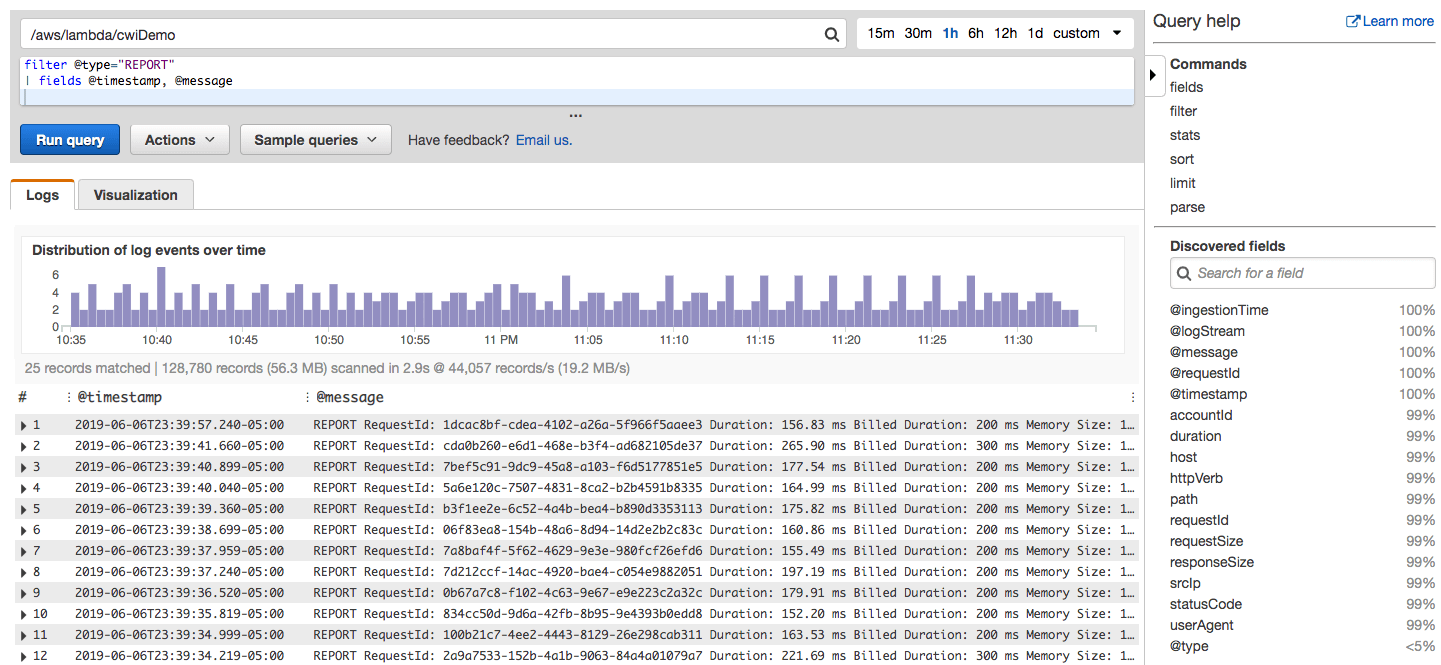
Amazon CloudWatch is an application and infrastructure monitoring tool that works on all major clouds and on-premises, but I recommend using it on AWS because you’d stand to get more out of it.
For starters, it leverages Amazon Route 53 and VPC Flow Logs natively to collect and publish logs for you. You can also use it to gather logs from other AWS products and services that comprise your IT infrastructure, including CloudTrail, Lambda, and API Gateway.
Beyond its logging features, I also like its approach to security by using tools like Identity and Access Management (IAM) to control user permissions and Key Management Service (KMS) for encryption.
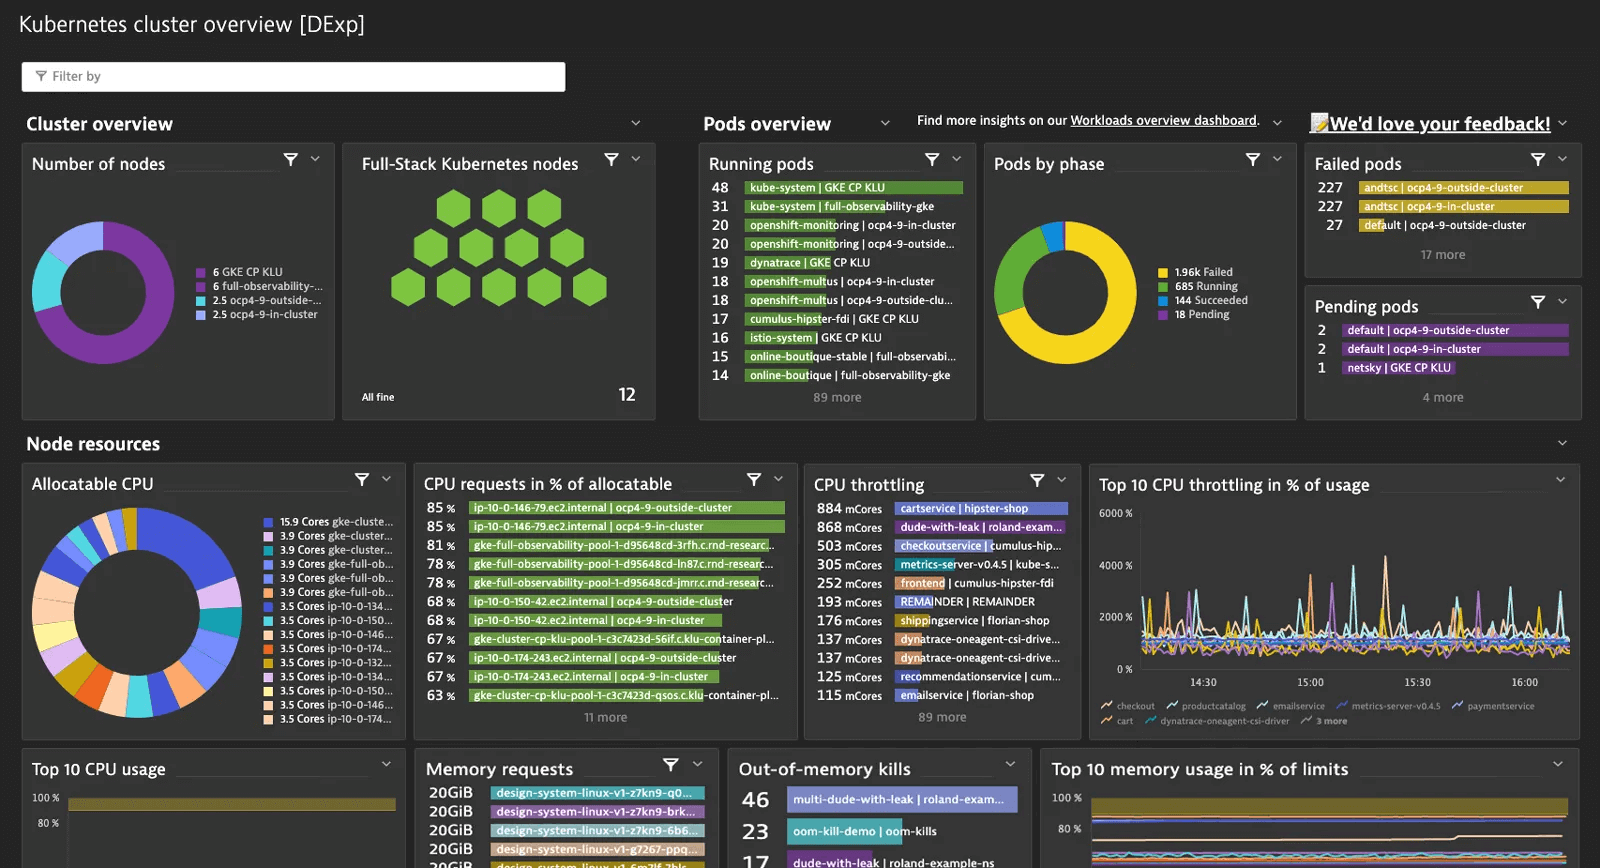
3. New Relic - Best error management features
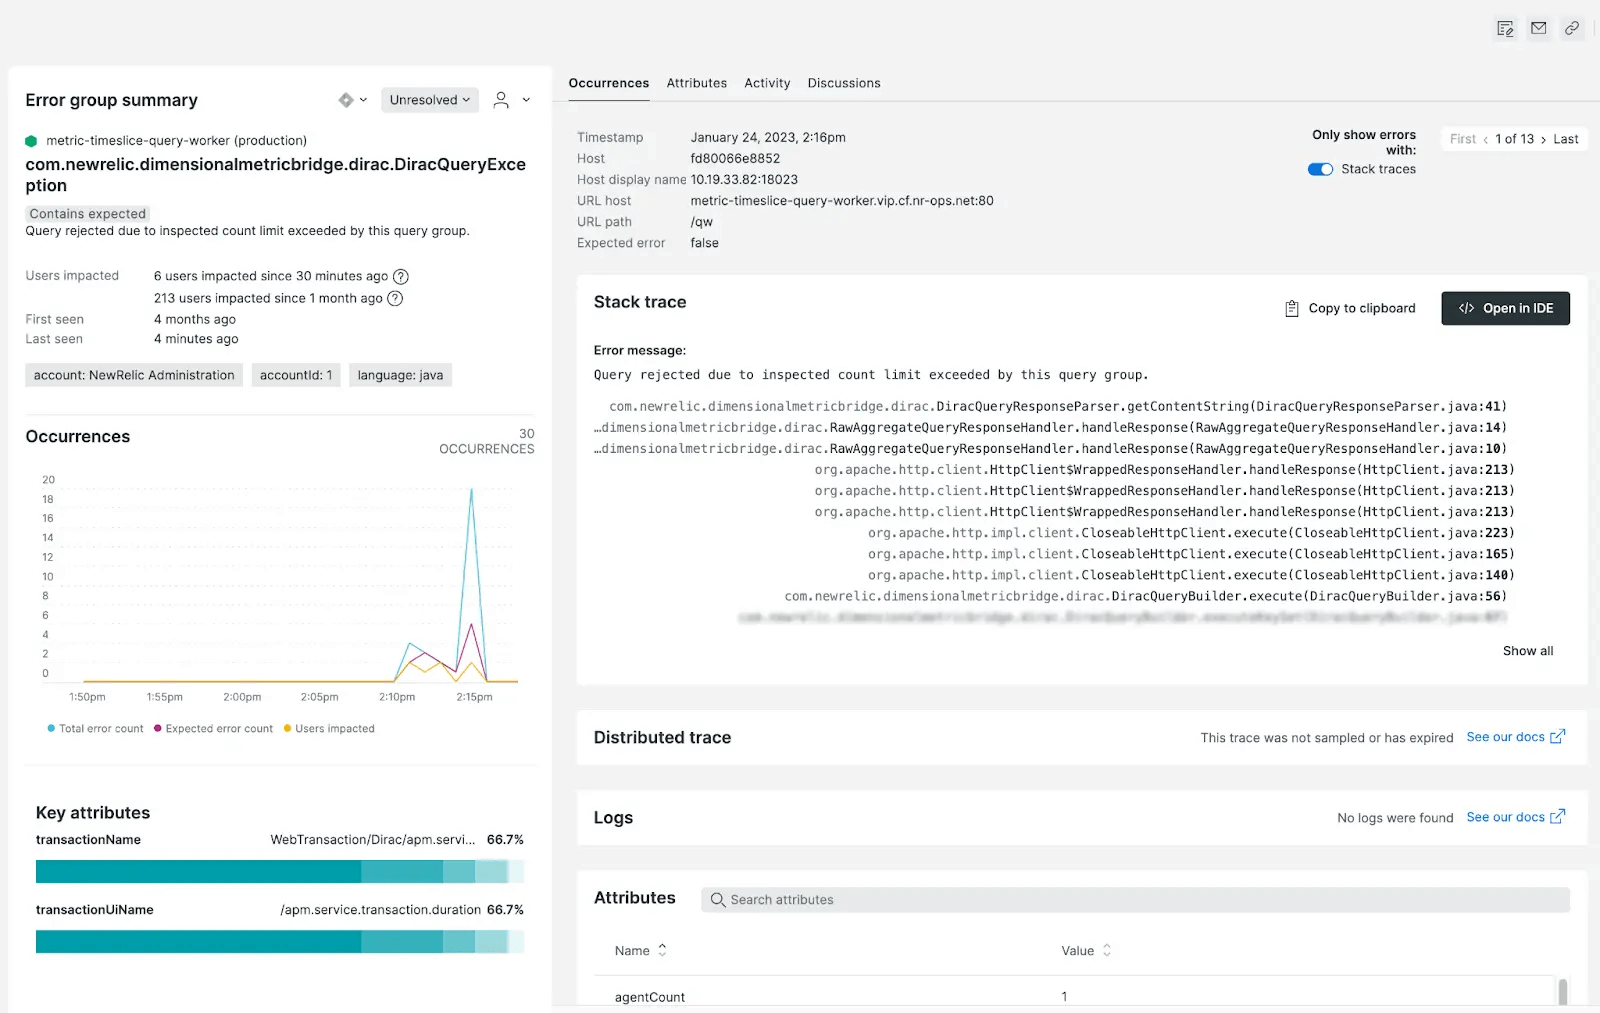
New Relic was one of the very first infrastructure monitoring tools I ever used, and I still find myself going back to and recommending it to others years later for how well it does error management.
It provides a feature called Error Inbox, which allows you to:
- Access errors in one place and review them with full contextual data
- Create error groups where they’re combined based on severity, with the option to set custom notification rules so you only receive alerts for high-priority groups
- Proactively flag, triage, and resolve errors before they’re raised in a ticket
- Integrate Slack to keep teams in the loop
- Access historical error data, complete with details like comments and links, even after they’ve been resolved
4. Honeycomb - Best for distributed services
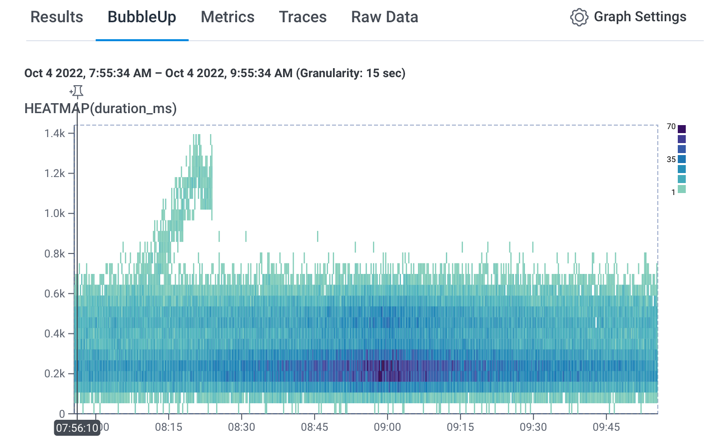
I encountered Honeycomb for the first time only a couple of months back, but it won me over almost immediately with its BubbleUp feature.
I’ve used BubbleUp to compare massive collections of metrics and other figures collected from across my systems, and it’s always been instrumental in revealing trends and other analytical insights that I missed, even when I had visualizations.
If your infrastructure consists of distributed systems, Honeycomb’s telemetry features can help you rein things in and sort through the data you collect.
5. eG Enterprise - Best dependency mapping features
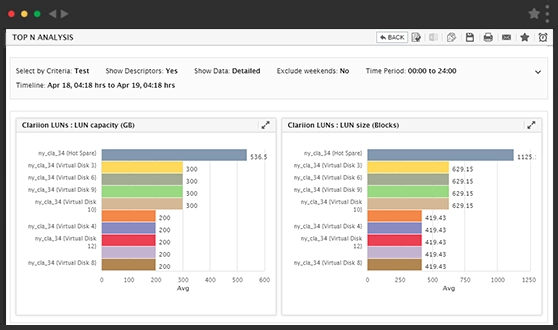
eG Enterprise is an infrastructure and application performance monitor (APM) solution from eG Innovations that works on legacy and modern applications, as well as cloud-based and on-premise infrastructure.
Personally, I’ve used it on a self-hosted platform and found its dependency mapping and infrastructure topology features solid as far as revealing the makeup of my IT infrastructure. I tested the auto-discovery feature for various forms of dependencies involving VMs, physical machines, and applications.
It presents them visually, so it’s easy to determine how changes in one area would affect the rest of the system, which was information I used to beef up security and improve performance.

Need expert help selecting the right tool?
With one-on-one help, we guide you to your top software options. Narrow down your software search & make a confident choice.
Infrastructure Monitoring Best Practices
When developing your infrastructure monitoring strategy, a few best practices I think you should keep in mind, based on the recommendations of some system admins and tech leads I consulted for this piece, include:
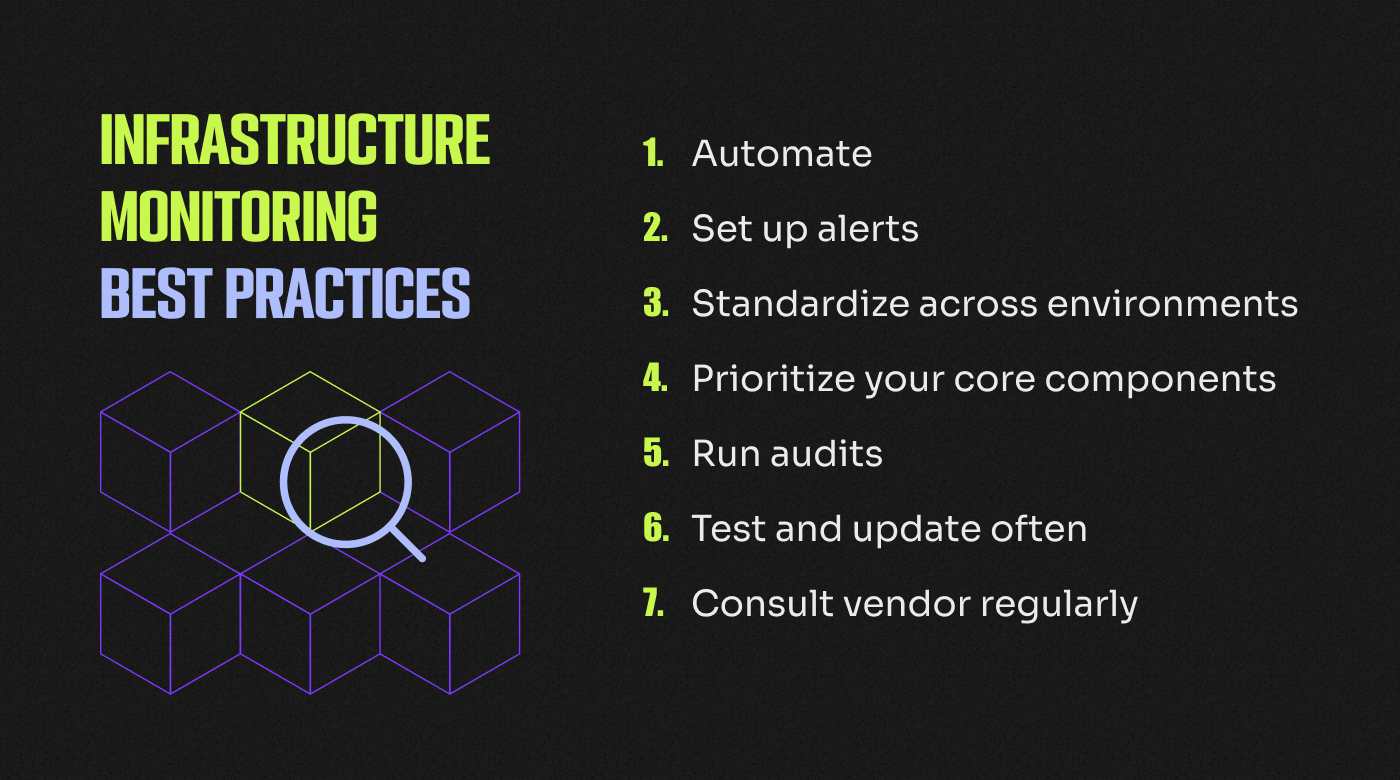
- Automate: This way, you free yourself from menial and recurring tasks to focus on more critical growth areas. Automation also allows you to reduce the risks that come with manual workflows, where human error could bring things crashing all around you.
- Set up alerts: You need to know what’s going on in your systems as soon as possible so you can put together a swift response. Configure how you receive notifications depending on priority so you’re not spammed with low-level alerts.
- Standardize across environments: If you’re using the monitor for different systems, it’s good to use the same processes and configurations where possible so you don’t need to keep track of how each one works.
- Prioritize your core components: If you can’t set everything up at once and instead have to roll the system out, start with your most critical components and work your way down. For instance, securing your data centers should take precedence over smoothing out performance issues.
- Run audits: Aside from keeping you compliant, these could help you uncover vulnerabilities and other issues that could put your infrastructure at risk if left to fester.
- Test and update often: Take some time to be proactive by running stress and penetration tests on your platform so you know how well you’re prepared for various performance and security incidents. If you’re self-hosted, I recommend checking at least once daily for updates to your installation if automatic updates aren’t an option.
- Consult vendor regularly: Check in with your provider on a regular basis to see if there are any new or planned features you’re in a unique position to take advantage of, recommendations for getting more out of your monitor, and other vital information that you might otherwise miss if you were out of the loop.
What’s Next?
More than half of all businesses today have moved all relevant infrastructure to the cloud, and finding a solid monitoring solution is just as important as any other business decision. If you’re in the process of moving to the cloud, use the information I’ve provided in this article to set yourself up for success.
Subscribe to the CTO Club newsletter for more insights into the latest tech innovations and solutions for your business.
