

ML model monitoring tools track, analyze, and alert you to the performance and health of machine learning models in production. If you’re responsible for keeping models reliable and accurate, you know how quickly data drift or prediction errors can put your results—or your business—at risk. These tools help you spot issues fast, understand root causes, and maintain trust in your solutions.
In this guide, you’ll get a clear comparison of the top ML model monitoring platforms, so you can find the right fit for your team’s workflows, compliance requirements, and real-world demands.
Why Trust Our Software Recommendations
6,700+
Reviews
20
Industry experts
16+
Evaluation factors
14
Years
Our team has been testing and reviewing software since 2012. As tech leaders ourselves, we know how difficult—and important—it is to choose the right software.
For this guide, we evaluated tools using hands-on testing and independent research, scoring tools using our selection criteria.
Our reviews reflect our human editorial judgment, not a sales pitch.
Expert reviewers:
- Paulo Gardini MiguelTech Director
 Tim FisherVP of AI
 Gabriel RosasTech Lead & Software Architect
 Christhian GruhnTech Lead & Platform Architect

ML Model Monitoring Tools Comparison Table
This comparison table summarizes pricing details for my top ML model monitoring tools selections:
| Tool | Best For | Trial Info | Price | ||
|---|---|---|---|---|---|
| 1 | Best for unified observability integration | Free plan available | From $15/month (billed annually) | Website | |
| 2 | Best for trace-based agent evaluation | Free plan + free demo available | From $39/user/month | Website | |
| 3 | Best for production workflow automation | Free demo available | Pricing upon request | Website | |
| 4 | Best for automated health reports | Free plan available | From $19/month | Website | |
| 5 | Best for secure enterprise deployment | Free plan available | From $0.04/credit | Website | |
| 6 | Best for scalable log analytics | Free demo + 14-day free trial available | From $0.42/GB | Website | |
| 7 | Best for real-time performance tracing | Free plan available | From $50/month | Website | |
| 8 | Best for explainable monitoring | Free plan + free demo available | From $0.002/trace | Website | |
| 9 | Best for end-to-end experiment tracking | Free plan available | Pricing upon request | Website | |
| 10 | Best for open-source flexibility | Free to use | Free to use | Website |


Best ML Model Monitoring Tools Reviews
Below are my detailed summaries of the best ML model monitoring tools that made it onto my shortlist. My reviews offer a detailed look at the features, integrations, and best use cases of each platform to help you find the best one for you.
 Best for unified observability integration
- Free plan available
- From $15/month (billed annually)
Visit WebsiteCustomer Rating:4.5/5
Datadog's Service Catalog provides a centralized view of service ownership, metadata, on-call routing, and setup guidance for engineering teams. Datadog is a full-stack observability platform that extends infrastructure monitoring, APM, and log management into ML workflows, covering LLM tracing, anomaly detection, and ML pipeline observability across cloud environments.
Who Is Datadog Best For?
It's a strong fit for ML platform architects and engineering teams at mid-to-large enterprises that already use Datadog for infrastructure and application observability.
Why I Picked Datadog
Datadog earns its spot on my shortlist because no other tool connects ML pipeline health to the rest of your stack the way it does. I love how Watchdog RCA automatically traces anomalies across services, so when a model endpoint degrades, I can correlate it against infrastructure metrics, logs, and traces in one view. Agent Observability gives my team span-level tracing through every LLM call, tool invocation, and retrieval step without any manual instrumentation.
Datadog Key Features
- Log management and analytics: Collect and analyze high-volume model logs with custom parsing, tagging, and flexible retention.
- PyTorch and TorchServe integration: Monitor deep learning inference pipelines directly with plug-and-play metric collection.
- Custom metric ingestion: Forward prediction quality and ML metrics into Datadog for real-time monitoring and historical analysis.
- Dynamic dashboarding: Build unified dashboards to visualize ML model performance alongside infrastructure and application data.
Datadog Integrations
Datadog offers 1,000+ native integrations, including Amazon SageMaker, Azure Machine Learning, Google Vertex AI, Databricks, PyTorch/TorchServe, OpenAI, Anthropic, Gemini, LangChain, CrewAI, and LiteLLM. An API is available for custom integrations.
Pros and Cons
Pros:
- Built-in anomaly detection for model endpoints
- Supports LLM and agent tracing natively
- Connects ML metrics with full-stack observability
Cons:
- Missing fairness and bias monitoring tools
- No built-in feature or concept drift detection
 Best for trace-based agent evaluation
- Free plan + free demo available
- From $39/user/month
Visit WebsiteCustomer Rating:4.4/5
LangSmith offers a Monitor view that lets users group LLM call traces by metadata such as model type, langserve version, or user agent over customizable time ranges. LangSmith is an agent engineering platform built around LLM observability, trace-based evaluation, and agent deployment, with tools for monitoring cost, latency, and output quality across production AI systems.
Who Is LangSmith Best For?
LangSmith is a good fit for AI engineering teams building and iterating on LLM-powered applications and agents in production.
Why I Picked LangSmith
I picked LangSmith as one of the best because the trace-based evaluation workflow is genuinely unlike anything else in this space. Every step an agent takes, from tool calls to sub-agent delegation, is captured and inspectable in full. I use the LLM-as-judge evaluators to run structured quality checks directly against real production traces, and the Insights Agent automatically clusters failures to surface recurring patterns across runs.
LangSmith Key Features
- Observability dashboards: Monitor agent behavior, cost, latency, and error metrics in real time from a unified dashboard.
- Agent Studio debugging: Step through and modify agent execution flows with breakpoints and visual tools during troubleshooting.
- Deployment registry: Manage agent versions with rollbacks, centralized registration, and multi-environment deployment support.
- Enterprise controls: Use SSO, RBAC, audit logs, and multi-region deployment options to meet organizational security requirements.
LangSmith Integrations
LangSmith offers native integrations with the LangChain and LangGraph frameworks, and supports protocols like A2A, MCP, and Agent Protocol. An API is available for custom integrations.
Pros and Cons
Pros:
- Enables LLM-as-judge scoring on real data
- Captures and visualizes detailed execution traces
- Purpose-built for LLM and agent workflows
Cons:
- Missing metrics for traditional ML models
- No data drift or concept drift detection
Learn more about LangChain LangSmith: Best for production workflow automation
- Free demo available
- Pricing upon request

DataRobot displays a Service Health dashboard tracking deployment latency, throughput, error rates, and total prediction requests over time. DataRobot is an AI observability platform that monitors predictive, generative, and agentic AI models in production, covering drift detection, performance tracking, prediction logging, root cause analysis, and automated retraining across cloud, on-prem, and hybrid environments.
Who Is DataRobot Best For?
DataRobot is a strong fit for enterprise MLOps and platform engineering teams managing large-scale AI deployments across regulated industries like banking, healthcare, and insurance.
Why I Picked DataRobot
I picked DataRobot as one of the best because its automated retraining and challenger policies eliminate the manual steps that slow down production incident response. When drift is detected, DataRobot compares a challenger model against the current production model and can swap it in without a manual deployment cycle. I also like that you can pause, redirect, or roll back a specific agent without disrupting the rest of the deployed system.
DataRobot Key Features
- Unified agent observability: Monitor predictive, generative, and agentic AI models across different environments from a single dashboard.
- LLM and vector database metrics: Track LLM-specific signals like cost, toxicity, and bias, along with vector database performance.
- End-to-end AI lineage tracking: Capture and organize the full lifecycle of models, prompts, and vector DB assets for transparency and audit trails.
- Built-in guardrails and moderation: Leverage prompt moderation, PII leakage prevention, and NVIDIA NeMo guardrails for AI safety and compliance.
DataRobot Integrations
DataRobot offers native integrations with Snowflake, BigQuery, Databricks, AzureML, SAP, AWS, and Salesforce, and supports OpenTelemetry for ingesting external agent telemetry. An API is available for custom integrations.
Pros and Cons
Pros:
- Built-in guardrails for bias and PII detection
- Monitors predictive, generative, and agentic AI assets
- Automated retraining and challenger model swaps
Cons:
- Some advanced settings require vendor support
- Pricing information is not transparent
Learn more about DataRobot: Best for automated health reports
- Free plan available
- From $19/month
Visit WebsiteCustomer Rating:4.7/5
SuperWise offers an application creation modal that lets users choose between AI-Assistant Retrieval and Advanced Agent application types. SuperWise is an ML observability and governance platform that monitors production model performance, detects data and concept drift, logs predictions at scale, and delivers automated anomaly detection with real-time dashboards across traditional ML models, LLMs, and AI agents.
Who Is SuperWise Best For?
SuperWise is a strong fit for enterprise MLOps and AI engineering teams in regulated industries that need auditable, governance-ready model observability at scale.
Why I Picked SuperWise
SuperWise earns its spot as one of the best on my shortlist because of how it handles automated health reporting across production models. I particularly like the adaptive anomaly detection, which adjusts for seasonality and statistical noise rather than firing on every minor metric fluctuation. Paired with AI Consensus scoring, it automatically links input drift to performance drops, so my team gets a root cause alongside every alert.
SuperWise Key Features
- Real-time operational telemetry: Monitor latency, throughput, and error rates for multiple models with under one-second dashboard updates.
- Custom governance dashboards: Build visual reports with charts, tables, and distributions across all tracked metrics.
- Flexible integration support: Connect data sources and alerting channels via Slack, Datadog, PagerDuty, REST API, and more.
- Audit trail logging: Capture every model decision and interaction with full context for compliance and incident reviews.
SuperWise Integrations
SuperWise offers native integrations with Slack, PagerDuty, OpsGenie, Datadog, New Relic, Grafana, AWS S3, BigQuery, and Snowflake. An API and Python SDK are available for custom integrations.
Pros and Cons
Pros:
- AI-powered root cause analysis for alerts
- Automated anomaly detection adapts to seasonality
- Real-time dashboards update latency and throughput instantly
Cons:
- Full data retention requires enterprise plan
- Limited fairness and bias analysis tools
Learn more about SuperWise: Best for secure enterprise deployment
- Free plan available
- From $0.04/credit

Amazon SageMaker Studio features a Home dashboard with quick actions, prebuilt solutions, and a left navigation panel for managing ML workflows. Amazon SageMaker is an end-to-end ML platform from AWS that covers model training, deployment, and production monitoring—including data drift detection, bias tracking, feature attribution, and performance metric logging via SageMaker Model Monitor.
Who Is Amazon SageMaker Best For?
It's a strong fit for enterprise ML platform teams running large-scale workloads in regulated industries where AWS-native security controls are a hard requirement.
Why I Picked Amazon SageMaker
I picked Amazon SageMaker because of how it locks down monitoring data in regulated environments. The Data Capture feature encrypts prediction inputs and outputs at rest using KMS, routes traffic through VPC endpoints, and stores everything in a designated S3 bucket with fine-grained access controls you define. CloudTrail auditing wraps the entire Model Monitor pipeline, logging every API call against your monitoring configuration, which is exactly what InfoSec teams require before they'll approve a production ML deployment.
Amazon SageMaker Key Features
- Model Dashboard: Centralizes visibility for deployed models, endpoints, and monitoring status in one interface.
- Drift and bias monitoring: Uses built-in rules to scan for data drift, quality issues, bias, and feature attribution changes.
- CloudWatch integration: Streams granular monitoring metrics and logs to Amazon CloudWatch for custom dashboards and alerting.
- Flexible data capture configuration: Lets you select sampling rates, payload types, and storage options for captured inputs and predictions.
Amazon SageMaker Integrations
Amazon SageMaker offers native integrations with Amazon S3, Amazon Redshift, Amazon CloudWatch, AWS CloudTrail, Amazon EventBridge, and supports deep connectivity across the AWS ecosystem. An API is available for custom integrations. Marketplace AI apps include Lakera Guard, Comet, DeepChecks, and Fiddler.
Pros and Cons
Pros:
- Monitors bias and feature attribution drift
- Centralized view for model monitoring status
- Data capture supports encrypted payloads in S3
Cons:
- Drift alerting not ML-powered or automated
- Root cause analysis requires manual notebook work
Learn more about Amazon SageMaker: Best for scalable log analytics
- Free demo + 14-day free trial available
- From $0.42/GB
Visit WebsiteCustomer Rating:4.8/5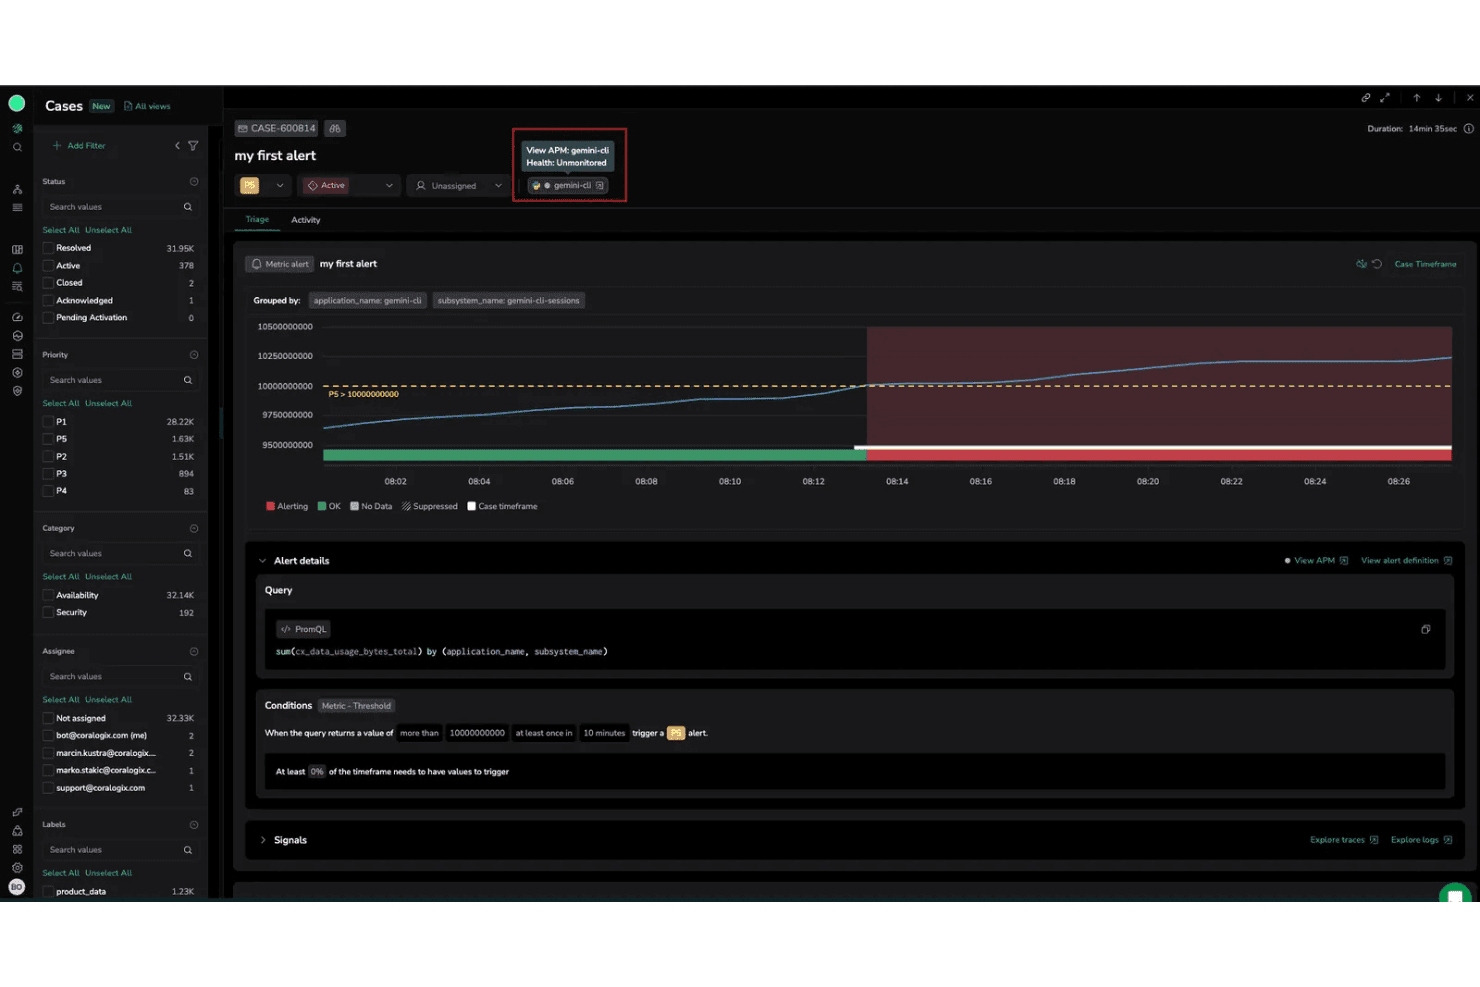
Coralogix offers a case management dashboard with metric alert monitoring, PromQL query support, and APM health status visualization. Coralogix is a full-stack observability platform that combines real-time log analytics, distributed tracing, metrics monitoring, and AI/LLM observability through an in-stream processing architecture that analyzes data before storage.
Who Is Coralogix Best For?
Coralogix is a strong fit for DevOps and SRE teams at mid-market to enterprise companies running cloud-native or Kubernetes-based infrastructure at scale.
Why I Picked Coralogix
Coralogix earns its spot on my shortlist because its in-stream log processing pipeline handles prediction logs at a scale most tools can't match. Rather than indexing everything upfront, it analyzes data as it flows in, so I can run anomaly detection on model inference logs in under five seconds. The Loggregation feature automatically clusters log patterns, which means unusual prediction outputs surface without manually configuring every alert threshold.
Coralogix Key Features
- AI Center dashboards: View LLM evaluator results, token usage, latency, and user feedback within centralized dashboards.
- Session explorer: Trace full user and prediction journeys from input to output for better model analysis.
- Cost tracking for AI workloads: Monitor token usage and surface unexpected consumption patterns in real time.
- Guardrails for AI responses: Enforce security and quality policies on both prompts and LLM responses to address prompt injections and sensitive data leaks.
Coralogix Integrations
Coralogix offers native integrations with AWS CloudWatch, AWS S3, Amazon Bedrock, Azure Cognitive Services, Kubernetes, Jenkins, GitHub, GitLab, PagerDuty, and Slack, and provides an API for custom integrations.
Pros and Cons
Pros:
- LLM observability with custom evaluator support
- Real-time anomaly detection on prediction logs
- Scalable log analytics for high-volume model data
Cons:
- Lacks built-in ML metrics monitoring
- No classical ML model drift detection
Learn more about Coralogix:
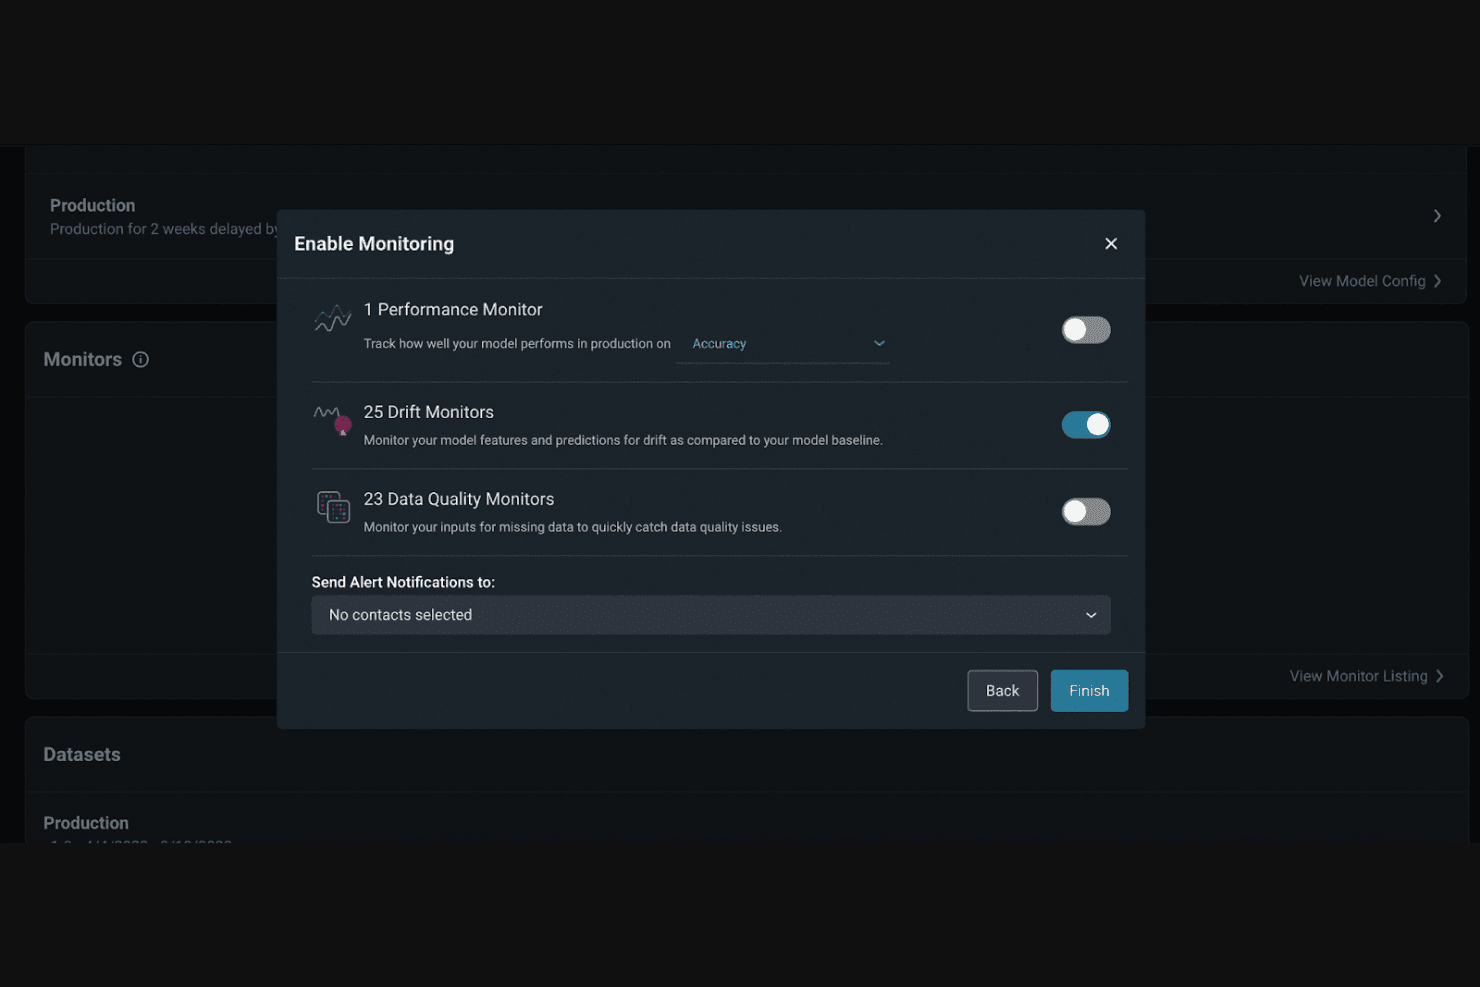
Arize AI offers an Enable Monitoring dialog that lets users configure Performance, Drift, and Data Quality monitors with toggle controls. Arize AI is an ML observability platform that combines real-time model monitoring, drift detection, prediction logging, and root cause analysis for both traditional ML models and LLM-based applications.
Who Is Arize AI Best For?
Arize AI suits MLOps engineers and ML platform teams at mid-to-large enterprises running production ML models alongside LLM-based applications.
Why I Picked Arize AI
Arize AI earns its spot on my shortlist because of how deeply it traces model behavior at the span level in real time. I like how the platform captures every input, output, and intermediate step across a model's execution path, so when performance drops, I can drill into exactly which span caused the issue rather than guessing. Signal automatically identifies failure modes and generates PRs to fix them, which is a level of automation I haven't seen anywhere else in this space.
Arize AI Key Features
- Drift detection and analysis: Detects data, feature, and embedding drift across production and training distributions.
- Alyx AI engineering agent: Provides an AI-powered assistant for debugging model issues.
- ML and LLM evaluation workflows: Supports both traditional ML models and LLM-based applications for tracing and monitoring.
- OpenTelemetry-native integration: Enables standardized data collection and supports seamless interoperability with existing MLOps stacks.
Arize AI Integrations
Arize AI offers native integrations with Pandas, Apache Spark, AWS SageMaker, MLflow, Flask, Ray, Apache Kafka, OpenAI, Anthropic, Google, and Amazon Bedrock. An API is available for custom integrations.
Pros and Cons
Pros:
- Native support for both ML and LLM workloads
- Automated root cause identification for failures
- Real-time span-level model performance tracing
Cons:
- Complex setup process for enterprise deployments
- Alerting defaults can generate excessive noise
Learn more about Arize AI: Best for explainable monitoring
- Free plan + free demo available
- From $0.002/trace
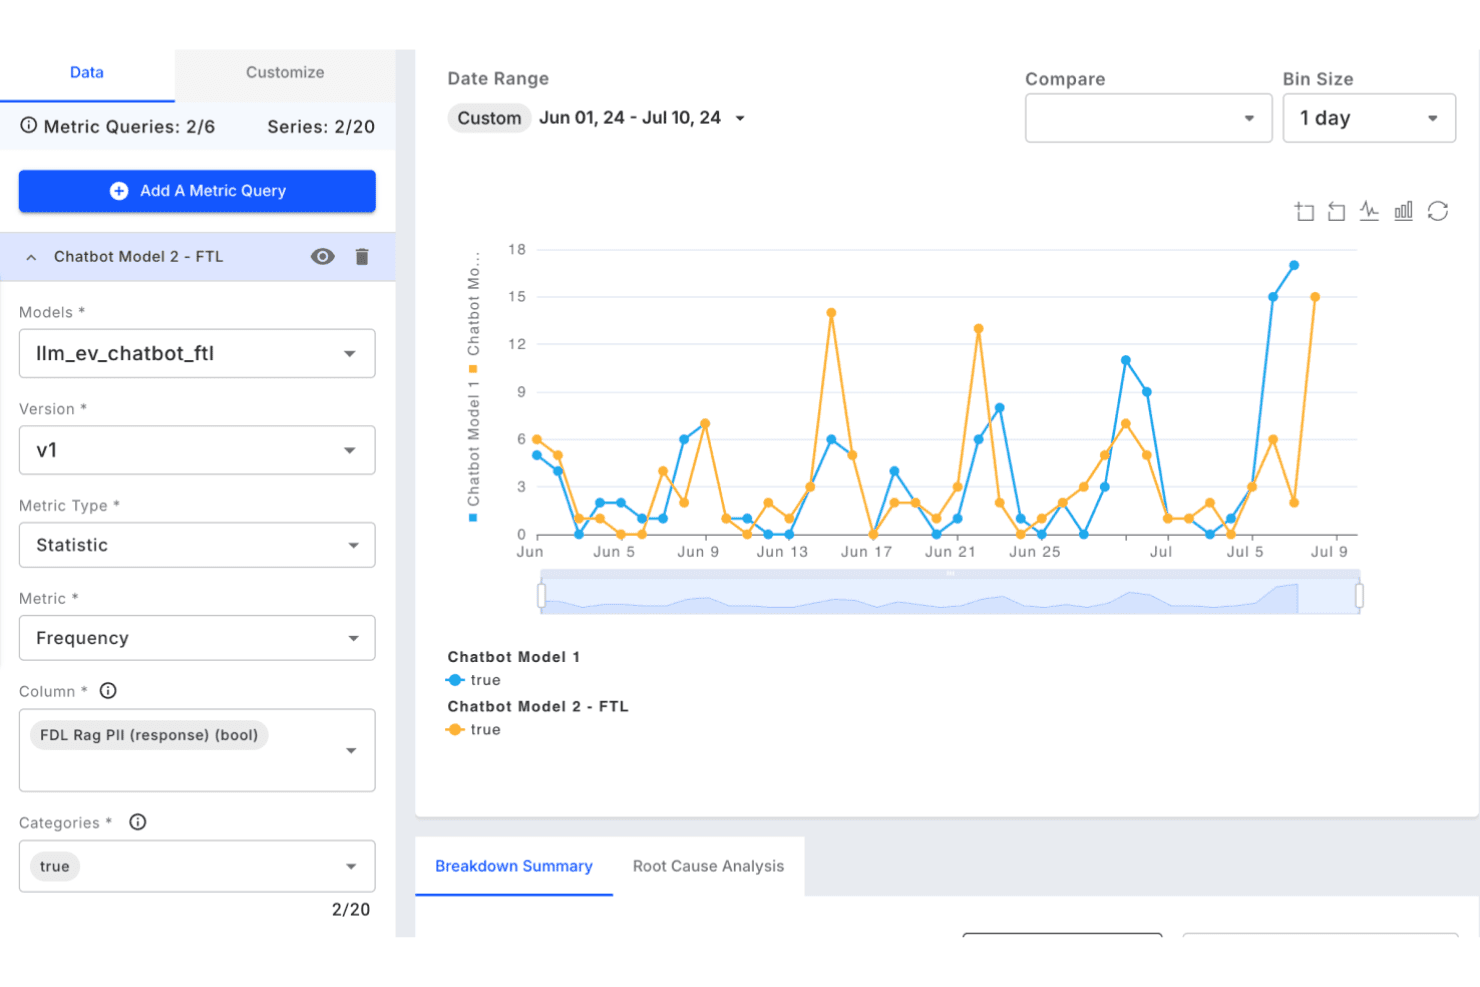
Fiddler AI offers a metric monitoring dashboard that tracks PII detection frequency across two chatbot models over a custom date range with breakdown and root cause analysis tabs. Fiddler AI is an AI observability platform that combines ML model monitoring, drift detection, explainability (XAI), fairness tracking, and root-cause analysis for production models.
Who Is Fiddler AI Best For?
Fiddler AI suits enterprise ML teams in regulated industries—like financial services, healthcare, and government—where model transparency and compliance are non-negotiable.
Why I Picked Fiddler AI
I picked Fiddler AI as one of the best because its explainability features go deeper than any other monitoring tool I've used. Rather than surfacing a generic alert, Fiddler lets me drill into feature attribution using SHAP values, segment by cohort, and trace performance degradation back to specific input distributions. That level of diagnostic depth is what separates it from tools that only tell you something is wrong, not why.
Fiddler AI Key Features
- Real-time alerting: Set up configurable alerts that trigger on performance, drift, or data quality metrics as they happen.
- Artifact monitoring: Track not just models but model artifacts to ensure consistency and reproducibility across environments.
- Delayed ground-truth handling: Handle asynchronous updates to ground-truth labels so you can monitor and evaluate live predictions.
- Role-based access control (RBAC): Define user permissions and access levels to maintain data integrity and security.
Fiddler AI Integrations
Fiddler AI offers native integrations with Amazon SageMaker, Google Cloud Vertex AI, Databricks, Datadog, PagerDuty, Slack, OpenAI, Anthropic, NVIDIA NIM, and Okta. An API is available for custom integrations.
Pros and Cons
Pros:
- Root-cause diagnostics for production incidents
- Real-time anomaly and drift detection
- Deep explainability with SHAP-based insights
Cons:
- Complex setup for on-premises deployments
- Limited public user community presence
Learn more about Fiddler AI:
Evidently AI offers a model monitoring dashboard for bike rental demand forecasting, displaying model calls, drifted features, and target vs. prediction trends — unlike MLflow's experiment tracking focus. MLflow is an open-source MLOps platform that spans experiment tracking, model registry, LLM tracing, production AI monitoring, and evaluation across the full ML and generative AI application lifecycle.
Who Is MLflow Best For?
MLflow is a strong fit for MLOps engineers and ML platform teams who need a framework-agnostic, self-hosted foundation for managing the full model lifecycle.
Why I Picked MLflow
MLflow earns its spot on my shortlist because no other open-source tool ties experiment tracking this tightly to production monitoring. I love that every model run logged during experimentation carries forward into the model registry and directly into the AI monitoring stack. In practice, that means I can trace a production quality regression back to a specific training run, compare logged evaluation metrics, and pinpoint exactly where things diverged.
MLflow Key Features
- AI monitoring stack: Capture traces, user context, and human feedback for LLM and agent model applications.
- Unified API gateway: Route and manage LLM requests with cost tracking, rate limits, and fallback support.
- Built-in quality drift detection: Continuously score production traces with LLM judges and automate trace sampling.
- Production safety checks: Monitor for prompt injection, PII leakage, and jailbreak attempts using built-in scorers.
MLflow Integrations
MLflow offers native integrations with OpenTelemetry, LangChain, OpenAI, PyTorch, TensorFlow, scikit-learn, AWS SageMaker, Azure ML, and Databricks, and provides an API for custom integrations.
Pros and Cons
Pros:
- Framework-agnostic across ML and LLM stacks
- LLM application trace capture and scoring
- Strong experiment tracking with model lineage
Cons:
- Alerting requires external setup or managed service
- No built-in statistical tabular drift detection
Learn more about MLflow:

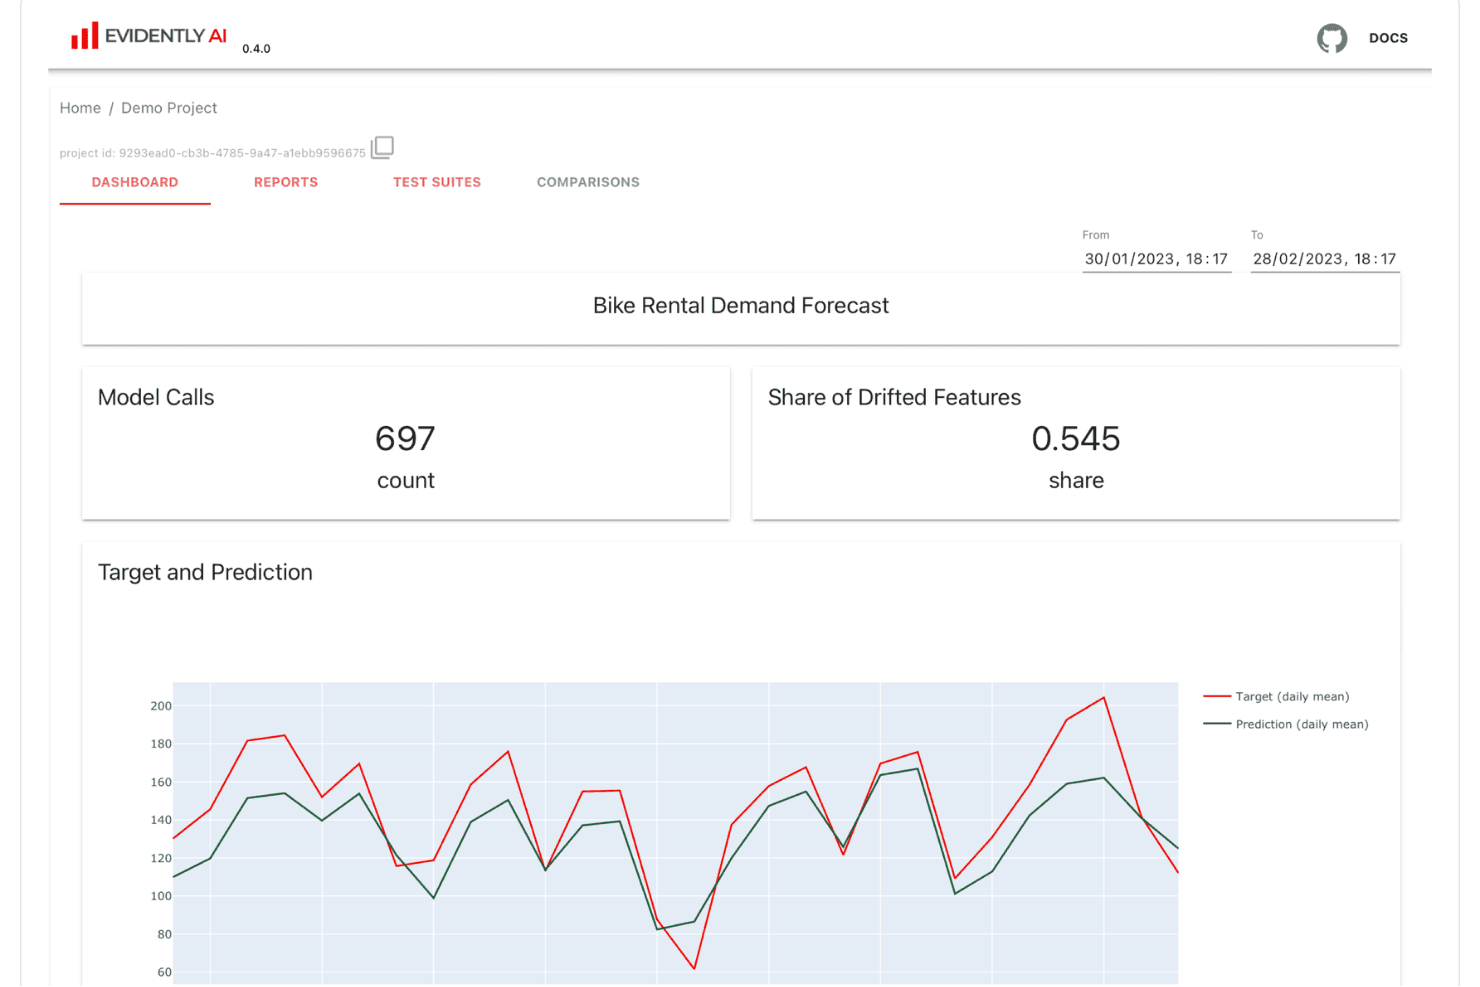
Evidently AI displays a Bike Rental Demand Forecast dashboard with model call counts, drifted feature share, and target vs. prediction trend lines. Evidently AI is an open-source ML observability framework that covers drift detection, performance monitoring, LLM evaluation, and automated test suites for models in production.
Who Is Evidently AI Best For?
MLOps engineers and ML platform teams who need a code-first, self-hostable monitoring solution with full control over their observability stack.
Why I Picked Evidently AI
Evidently AI earns its spot on my shortlist because the Apache 2.0 license means I own the entire monitoring stack with no vendor lock-in. I particularly like that the framework is modular: I can run standalone drift reports using statistical tests like Kolmogorov-Smirnov and PSI, or build full test suites that plug directly into CI/CD pipelines without needing a paid SaaS tier. The self-hostable Enterprise option extends that same flexibility to teams with strict data residency requirements.
Evidently AI Key Features
- Interactive monitoring dashboard: Visualizes production data, model metrics, and performance trends with customizable charts.
- LLM and RAG evaluation: Supports integrated evaluation and monitoring for large language models and retrieval-augmented generation systems.
- Automated test suites: Lets you create pass/fail model quality checks for CI/CD and production workflows.
- Trace viewer: Allows inspection of individual prediction traces to debug and analyze model behavior in detail.
Evidently AI Integrations
Evidently AI offers native integrations with MLflow, Apache Airflow, Grafana, and Prometheus. An API is available for custom integrations.
Pros and Cons
Pros:
- Modular test suites for automated model checks
- Deep statistical drift monitoring options
- Open-source and fully self-hostable
Cons:
- No built-in model explainability visuals
- Native alerting features require paid tier
Learn more about Evidently AI:
Other ML Model Monitoring Tools
Here are some additional ML model monitoring tools options that didn’t make it onto my shortlist, but are still worth checking out:
- 11DeepchecksBest for customizable validation suites
- 12ArthurBest for bias and fairness assessment
- 13GrafanaBest for custom visualization dashboards
- 14QualdoBest for business metric correlation
- 15TrueFoundryBest for quick deployment pipeline integration
- 16JFrog MLBest for artifact lifecycle management
- 17BraintrustBest for data science workflow collaboration
How I Evaluate ML Model Monitoring Tools
I split my evaluation into core criteria—like drift detection and prediction logging—and differentiating factors that show which tools shine in production.
Core Functionality (Table Stakes for This List)
When I'm selecting tools for my list, I rank each one on a scale from 0 (does not offer the functionality) to 5 (excels in this area) for each core functionality listed below. Then, I calculate the tool's total score into a percentage. Each tool needs to achieve a minimum total score of 65% to be considered for inclusion.
- Drift Detection: I check whether the tool catches data, feature, and concept drift using statistical methods like PSI or KS tests—especially when production inputs shift gradually after a model's been live for months.
- Performance Monitoring: Tracking accuracy, precision, recall, or RMSE over time matters, so I look for tools that handle delayed ground-truth labels common in fraud or churn models.
- Prediction Logging: I evaluate how well each tool ingests and stores model inputs and outputs at scale, since high-throughput environments can generate millions of predictions daily.
- Alerting & Anomaly Detection: Good alerting goes beyond static thresholds. I look for configurable alerts that route to Slack, PagerDuty, or email when anomalous output patterns emerge.
- Root Cause Analysis: When a model's metrics drop, you need segment-level drill-downs. I evaluate whether the tool offers cohort slicing and explainability features like SHAP or LIME attributions.
- ML Framework Integrations: I check for SDK support across frameworks like TensorFlow, PyTorch, and scikit-learn, plus connectors to deployment platforms such as Kubernetes or Databricks.
Once I have a list of tools that meet the criteria, I consider what sets each platform apart.
Differentiating Factors (What Sets Vendors Apart)
Here's how I compare and contrast different vendors:
Standout Features
LLM and GenAI observability is a key differentiator. Teams that deploy generative models alongside traditional ML need visibility into prompt quality, hallucinations, and token costs. Explainability and bias monitoring matter too—I look for SHAP-based attributions and fairness metrics across demographic slices that support regulatory audits. Custom alerting rounds things out, since business-specific SLOs and anomaly alert routing to Slack or PagerDuty help catch regressions before customers do.
Beyond Features
Deployment flexibility matters a lot here. I evaluate whether a platform offers SaaS, VPC, or on-prem options, since teams in regulated industries like healthcare or finance often can't let inference logs leave their environment. Scalability is another factor—I consider how well each tool handles high-volume prediction logging without sampling, and whether pricing scales predictably as model count grows. Compliance certifications like SOC 2 Type II and HIPAA also carry weight for enterprise buyers who need audit trails and role-based access controls.
How to Choose ML Model Monitoring Tools
It’s easy to get bogged down in long feature lists and complex pricing structures. To help you stay focused as you work through your unique software selection process, here’s a checklist of factors to keep in mind:
| Factor | What to Consider |
|---|---|
| FactorScalability | What to ConsiderWill the tool handle your peak prediction traffic and storage needs as models and data volumes grow? Check retention limits and ingestion throughput. |
| FactorIntegrations | What to ConsiderDoes it connect with the ML frameworks, deployment platforms, and data warehouses you rely on? Gaps can create manual overhead and impact workflow speed. |
| FactorCustomizability | What to ConsiderCan you define custom metrics, alerts, or dashboards that match your use cases? Be sure you’re not locked into only preset options from the vendor. |
| FactorEase of use | What to ConsiderIs the UI clear, and are dashboards and alerts intuitive to configure? Complex tools may slow down troubleshooting and onboarding new users. |
| FactorImplementation and onboarding | What to ConsiderHow quickly can your team get from SDK install to live monitoring? Look for example notebooks, out-of-the-box templates, and onboarding support. |
| FactorCost | What to ConsiderHow does pricing scale as you add models, users, or predictions? Clarify unit pricing to avoid unwelcome cost surprises as your footprint expands. |
| FactorSecurity safeguards | What to ConsiderWhat data access controls, authentication methods, and audit trails are available? Think about SSO, RBAC, and data encryption both at rest and in transit. |
| FactorCompliance requirements | What to ConsiderDo you need certifications like SOC 2, HIPAA, or EU data residency? Make sure the tool’s compliance posture actually meets your organization’s obligations. |
What Are ML Model Monitoring Tools?
ML model monitoring tools are platforms that track the performance, data quality, and health of machine learning models in production. These tools help your team detect data drift, performance drops, and anomalies, so you can quickly address issues. By continuously monitoring prediction outputs and related metrics, you ensure your deployed models remain accurate, fair, and reliable for real-world business use.Features
Features
When selecting ML model monitoring tools, keep an eye out for the following key features:
- Drift detection: Identifies shifts in data or model behavior between training and production environments, flagging potential issues before they impact model accuracy.
- Performance monitoring: Continuously measures model metrics such as accuracy, precision, recall, and error rates to track how well your deployed models are working over time.
- Prediction logging: Records all model inputs, outputs, and predictions, allowing you to audit, analyze, and troubleshoot model behavior at any point in your workflow.
- Alerting and notifications: Sends real-time alerts when specific thresholds are breached or when anomalous model behaviors are detected, helping teams respond quickly to issues.
- Root cause analysis: Enables investigation into performance drops or prediction anomalies with segmentation, slicing, and attribution tools to pinpoint the source of problems.
- Integration with ML frameworks: Connects with popular machine learning libraries, serving platforms, and deployment tools, streamlining monitoring within existing workflows.
- Role-based access control: Restricts system access and actions based on user roles, supporting data governance needs and enhancing system security.
- Data retention options: Allows you to configure how long to store logged data and predictions, balancing compliance requirements with storage costs.
- Custom metric tracking: Lets you define and monitor business-specific or model-specific metrics that matter most for your application or objectives.
Common ML Model Monitoring Tools AI Features
Beyond the standard ML model monitoring tools features listed above, many of these solutions are incorporating AI with features like:
- Automated anomaly detection: Uses AI algorithms to identify unusual patterns or outliers in prediction data, reducing manual oversight and surfacing issues that traditional rules might miss.
- Root cause analysis with explainable AI: Applies AI-driven explainability techniques to automatically highlight which features or data segments contributed most to performance drops or anomalies.
- Adaptive drift detection: Leverages AI to dynamically adjust drift detection thresholds and methods based on evolving data patterns, improving sensitivity and reducing false positives.
- Predictive alerting: Uses AI models to forecast potential model failures or degradations before they occur, allowing teams to take proactive action.
- Bias and fairness analysis: Employs AI to continuously scan for emerging biases in model predictions across demographic groups, supporting responsible AI practices and compliance needs.
Benefits
Implementing ML model monitoring tools provides several benefits for your team and your business. Here are a few you can look forward to:
- Faster issue detection: Automated drift and anomaly alerts let your team catch and address problems as soon as they arise.
- Improved model reliability: Ongoing performance tracking and prediction logging help ensure your models continue to perform as expected in production environments.
- Stronger compliance and security: Features like audit trails, RBAC, and data retention controls make it easier to meet regulatory requirements and keep sensitive data protected.
- Simplified troubleshooting: Root cause analysis, explainability, and cohort slicing tools help your team quickly pinpoint what’s driving performance changes or output anomalies.
- Better business alignment: Custom metric tracking and alerting enable you to monitor the KPIs and outcomes that matter most to your organization.
- Reduced operational risk: Real-time monitoring and proactive alerting limit the impact of bad predictions on business outcomes and decision-making.
- Support for responsible AI: Bias monitoring and fairness metrics help you build and maintain models that are accurate and equitable across user groups.
Costs & Pricing
Selecting ML model monitoring tools requires an understanding of the various pricing models and plans available. Costs vary based on features, team size, add-ons, and more. The table below summarizes common plans, their average prices, and typical features included in ML model monitoring tools solutions:
Plan Comparison Table for ML Model Monitoring Tools
| Plan Type | Average Price | Common Features |
|---|---|---|
| Plan TypeFree Plan | Average Price$0 | Common FeaturesBasic monitoring, limited drift detection, community support, restricted data retention, and usage limits. |
| Plan TypePersonal Plan | Average Price$10-$50/user/month | Common FeaturesIndividual user access, expanded data logging, basic performance metrics, some integrations, and email support. |
| Plan TypeBusiness Plan | Average Price$50-$200/user/month | Common FeaturesTeam collaboration, advanced drift and anomaly detection, customizable alerts, API access, and priority support. |
| Plan TypeEnterprise Plan | Average Price$200+/user/month | Common FeaturesUnlimited users, full compliance options, on-prem deployment, dedicated onboarding, audit trails, SLA guarantees, and SSO. |
ML Model Monitoring Tools FAQs
Here are some answers to common questions about ML model monitoring tools:
How do ML model monitoring tools handle model drift?
ML model monitoring tools detect model drift by continuously comparing incoming data and predictions to historical patterns using statistical methods. This helps your team spot shifts in data, features, or output distributions early, so you can retrain or adjust models as needed.
Can these tools integrate with our existing ML workflows?
Yes, most ML model monitoring tools offer integration with popular ML frameworks, cloud platforms, orchestration tools, and data warehouses. You can typically connect them using SDKs, APIs, or native connectors to fit seamlessly into your deployment pipeline.
What security measures should I look for?
You should look for features like role-based access controls, SSO/SAML authentication, data encryption, audit logs, and compliance certifications. These safeguards help protect sensitive prediction data and support regulatory requirements.
Do these tools support both real-time and batch predictions?
Yes, many ML model monitoring tools support logging and monitoring for both real-time and batch prediction workflows. This allows your team to monitor the full range of model deployments, whether predictions happen instantly or on a scheduled basis.
How long is prediction data typically stored?
The retention period for prediction data can vary, but most tools allow you to configure it based on your compliance and storage needs. Some vendors offer tiered retention—short-term for basic plans and extended or unlimited for enterprise tiers.
Is onboarding complex if our team is new to model monitoring?
Most leading tools offer clear documentation, onboarding support, and example notebooks to help your team get started. The complexity depends on your existing architecture, but good solutions streamline initial setup to help you start monitoring quickly.