

As plataformas de observabilidade de IA são ferramentas especializadas que permitem monitorizar, resolver problemas e otimizar o desempenho dos modelos desde o desenvolvimento até à produção. Para CTO e responsáveis de TI que gerem infraestruturas complexas, escolher o software de observabilidade adequado ajuda a manter a fiabilidade, diagnosticar falhas, cumprir as normas de conformidade e compreender os custos nos fluxos de MLOps e baseados em agentes.
Este guia analisa as melhores ferramentas de observabilidade de IA em 2026, com opções para governação, diagnóstico de fluxos, acompanhamento de custos e deteção de anomalias, para que possa melhorar o tempo de atividade, obter informações úteis e manter a sua infraestrutura de IA resiliente e preparada para o futuro.
Why Trust Our Software Recommendations
6,700+
Reviews
20
Industry experts
16+
Evaluation factors
14
Years
Our team has been testing and reviewing software since 2012. As tech leaders ourselves, we know how difficult—and important—it is to choose the right software.
For this guide, we evaluated tools using hands-on testing and independent research, scoring tools using our selection criteria.
Our reviews reflect our human editorial judgment, not a sales pitch.
Expert reviewers:
- Paulo Gardini MiguelTech Director
 Tim FisherVP of AI
 Gabriel RosasTech Lead & Software Architect
 Christhian GruhnTech Lead & Platform Architect

Tabela comparativa de ferramentas de observabilidade de IA
Esta tabela comparativa resume os detalhes de preços das minhas principais seleções de ferramentas de observabilidade de IA:
| Tool | Best For | Trial Info | Price | ||
|---|---|---|---|---|---|
| 1 | Best for AI governance with ISO/IEC 42001 compliance | 14-day free trial | From $0.06/GB | Website | |
| 2 | Best for OTel-native AI and agentic monitoring | Free plan available | From $10/user/month | Website | |
| 3 | Best for AIOps-driven anomaly detection at scale | 7-day free trial | From $0.07/GB | Website | |
| 4 | Best for trace-to-evaluation regression datasets | Free plan + free demo available | From $249/month | Website | |
| 5 | Best for RAG pipeline and retrieval diagnostics | Free plan + free demo available | Pricing upon request | Website | |
| 6 | Best for AI cost forecasting | 15-day free trial | From $7/month | Website | |
| 7 | Best for agentic failure triage and RCA | Free plan + free demo available | From $50/month | Website | |
| 8 | Best for governed, multi-agent monitoring | Free plan + free demo available | From $0.002 per trace | Website | |
| 9 | Best for full-stack AI agent tracing | Free plan available | From $19/month | Website | |
| 10 | Best for AI agent cost attribution | 14-day free trial | Pricing upon request | Website |


Análises de ferramentas de observabilidade de IA
Seguem-se os meus resumos detalhados das melhores ferramentas de observabilidade de IA que entraram na minha lista restrita. As minhas análises apresentam uma visão detalhada das funcionalidades, capacidades e melhores casos de utilização de cada plataforma, para o ajudar a encontrar a melhor opção para si.
 Best for AI governance with ISO/IEC 42001 compliance
- 14-day free trial
- From $0.06/GB
Visit WebsiteCustomer Rating:4.8/5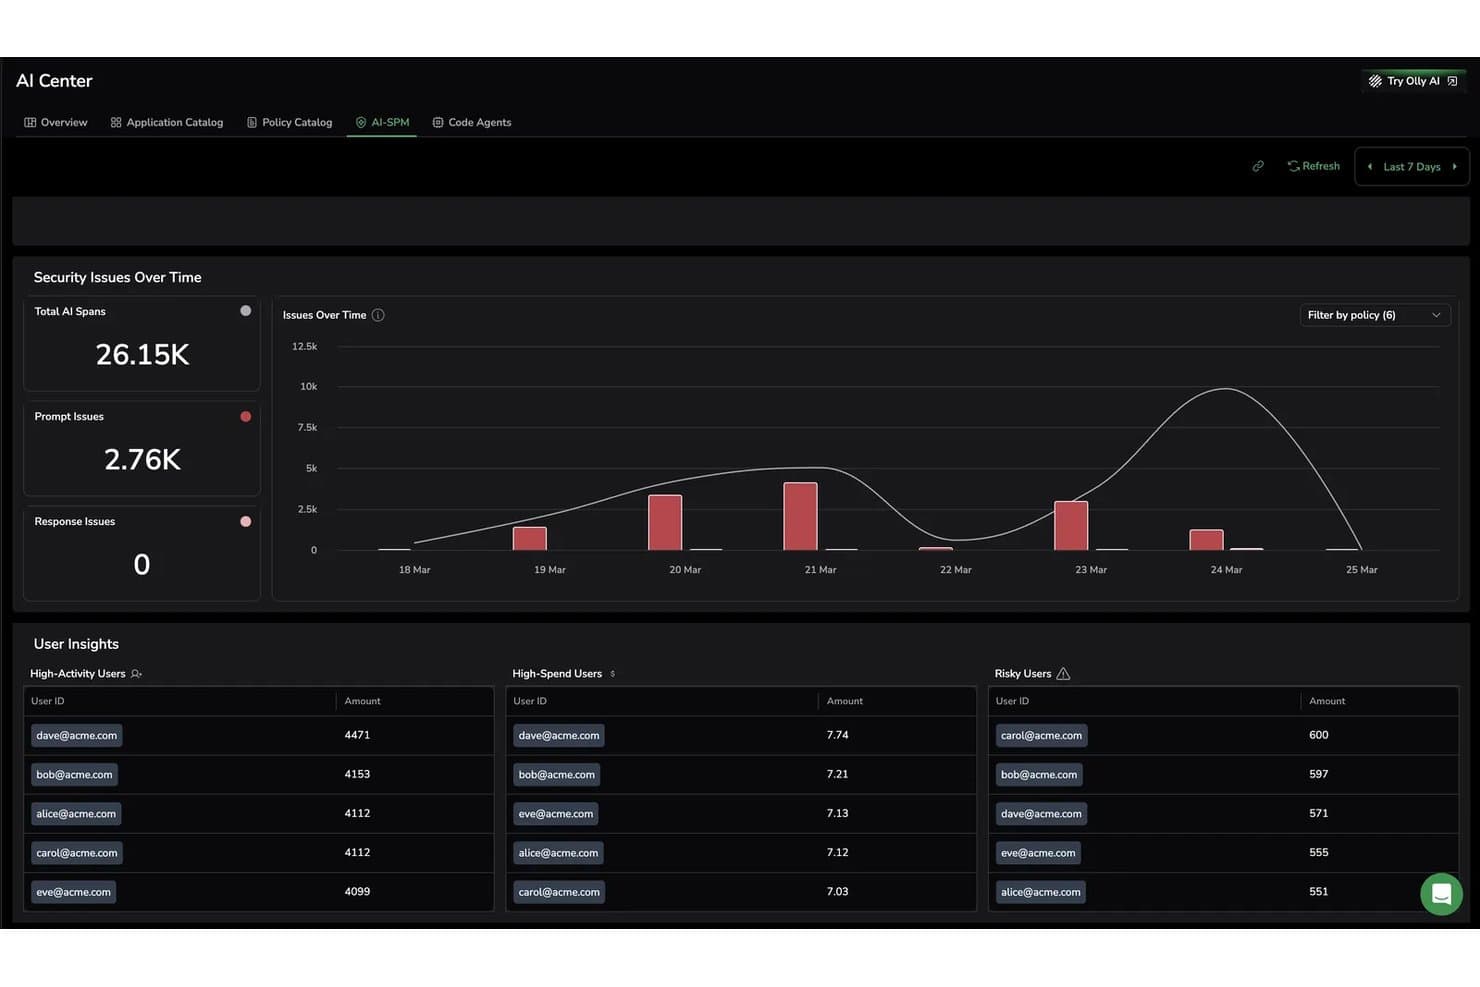
Coralogix tracks AI security issues and risky users in real time. Coralogix is a full-stack observability platform that combines LLM telemetry, AI evaluation, guardrails, anomaly detection, and governance monitoring with traditional APM, log analytics, and SIEM capabilities.
Who Is Coralogix Best For?
Coralogix is a strong fit for IT and DevOps teams that need to govern AI systems alongside traditional infrastructure, especially in regulated industries where compliance standards like ISO/IEC 42001 aren't optional.
Why I Picked Coralogix
I've included Coralogix in my top picks because it's the first observability vendor to earn ISO/IEC 42001:2023 certification, which matters enormously if you're operating AI systems in regulated environments where governance isn't optional. Its AI Discovery module actively scans code repositories to surface AI agents deployed without central IT approval, giving you a complete, auditable map of your organization's AI footprint. Layer on the AI-SPM posture scoring and session-level audit trails, and you have a defensible compliance record built into your workflow.
Coralogix Key Features
- LLM TraceKit: Captures prompts, completions, token counts, tool calls, latency, and cost across providers like OpenAI, Anthropic, AWS Bedrock, and Google Gemini.
- AI Evaluation Engine: Assigns quality and security evaluators to every AI agent, scoring each message in real time.
- Session Explorer: Traces user sessions from start to finish, AI responses, tool calls, and evaluator flags for debugging and compliance auditing.
- eBPF zero-code auto-instrumentation: Hooks into the Linux kernel to capture LLM telemetry across providers without any code changes, at under 1% CPU overhead per node.
Coralogix Integrations
Coralogix integrates with AWS CloudFront, GitHub, Node.js, Okta, Prometheus, Zeek, and UpGuard. It also offers an API for custom telemetry.
Pros and Cons
Pros:
- Uses familiar syntax (Lucene/KQL), making migrations easier
- AI Discovery maps shadow AI deployments
- Detects anomaly automatically
Cons:
- Vector retriever diagnostics not fully documented
- No native human feedback workflow
Learn more about Coralogix: Best for OTel-native AI and agentic monitoring
- Free plan available
- From $10/user/month
Visit WebsiteCustomer Rating:4.3/5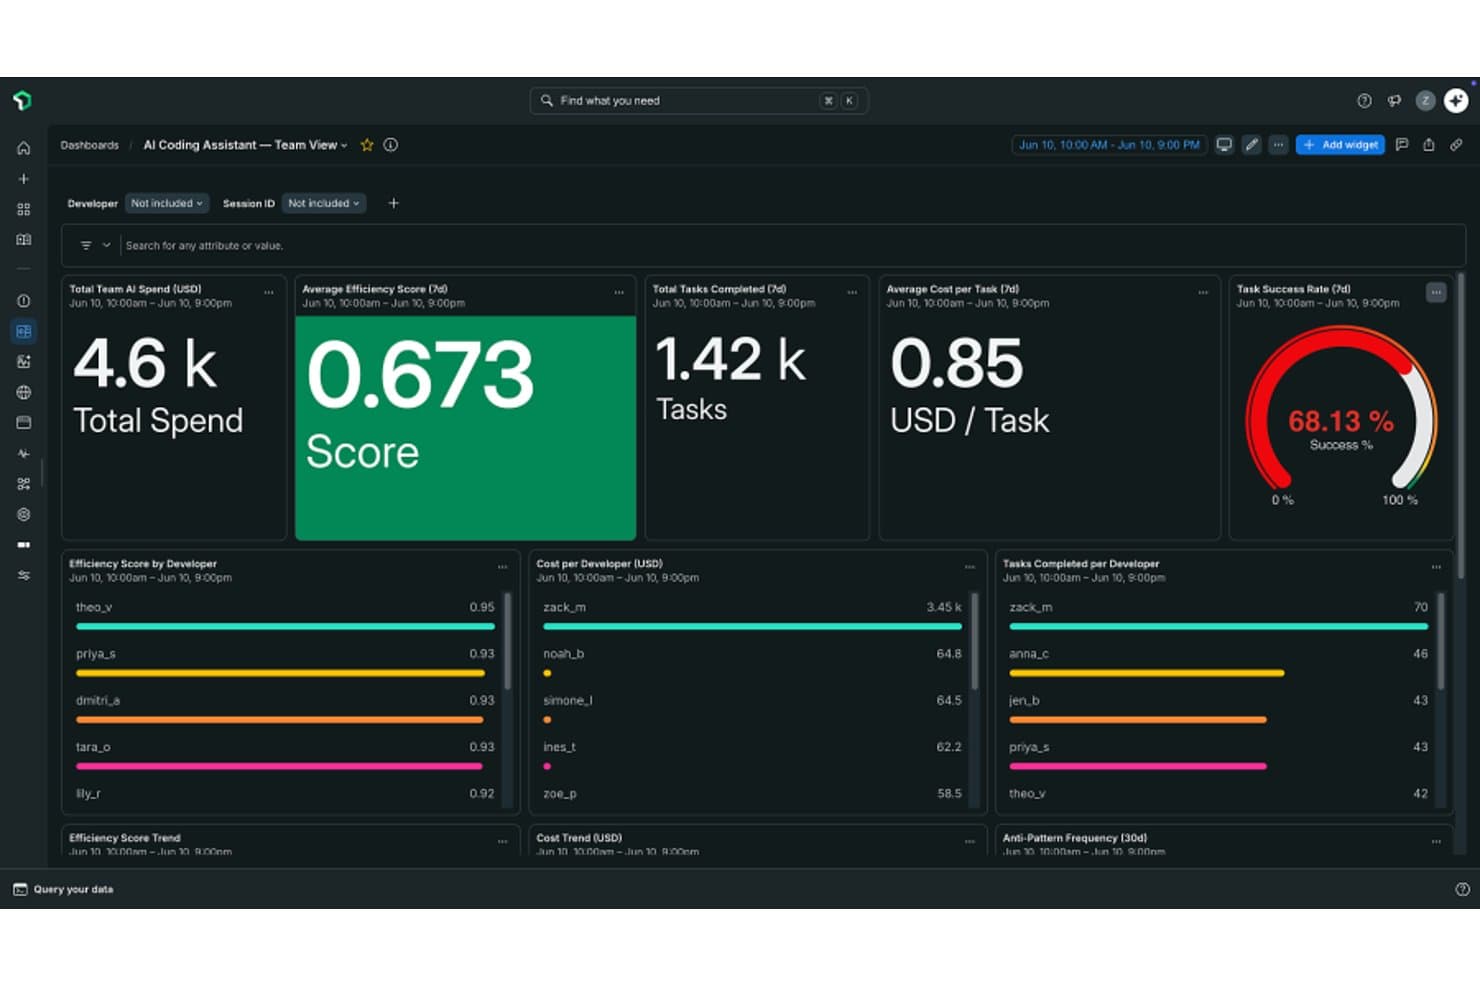
New Relic tracks AI coding team efficiency, spend, and task success rates. New Relic is a full-stack AI observability platform that combines LLM telemetry, distributed tracing, AIOps-driven anomaly detection, and multi-agent workflow monitoring across your entire application and infrastructure layer.
Who Is New Relic Best For?
New Relic is a strong fit for DevOps and SRE teams that already run New Relic for APM and want to extend that same observability stack into LLM and multi-agent AI workloads.
Why I Picked New Relic
New Relic earns its spot on my shortlist because its OTel-native AI monitoring is genuinely production-ready, with the August 2026 GA release letting any OTel-instrumented app send GenAI spans directly without a proprietary agent. I also like how the Agents Service Map visualizes live multi-agent ecosystems, showing agent-to-agent calls, tool utilization, and MCP server lifecycles in a single trace view. That means when an agentic workflow misfires, I can pinpoint exactly which agent or tool call broke the chain.
New Relic Key Features
- Applied Intelligence anomaly detection: ML models scan metrics, logs, and traces for abnormal patterns and correlate related alerts into a single enriched incident for faster investigation.
- Model Inventory dashboard: Tracks all LLM calls across providers, surfacing cost, performance, and quality comparisons in a single view so you can evaluate models running in production.
- PII drop filters: Regex-based filters redact or exclude sensitive data at the ingest pipeline level before it's stored, with a global toggle to disable content recording entirely.
- New Relic AI Assistant: Generates conversational system insights, writes NRQL queries, and runs automated root-cause analysis.
New Relic Integrations
New Relic supports 800+ integrations, including OpenAI, Amazon Bedrock, LangChain, Pinecone, Weaviate, and Amazon SageMaker. It also accepts OpenTelemetry GenAI spans through its native OTLP endpoint.
Pros and Cons
Pros:
- Unified telemetry from LLMs to infrastructure
- Agentic AI workflows visualized in real time
- OTel-native GenAI observability across the stack
Cons:
- SaaS-only, no self-hosted deployment option
- No automated LLM output quality evaluation
Learn more about New Relic: Best for AIOps-driven anomaly detection at scale
- 7-day free trial
- From $0.07/GB
Visit WebsiteCustomer Rating:4.3/5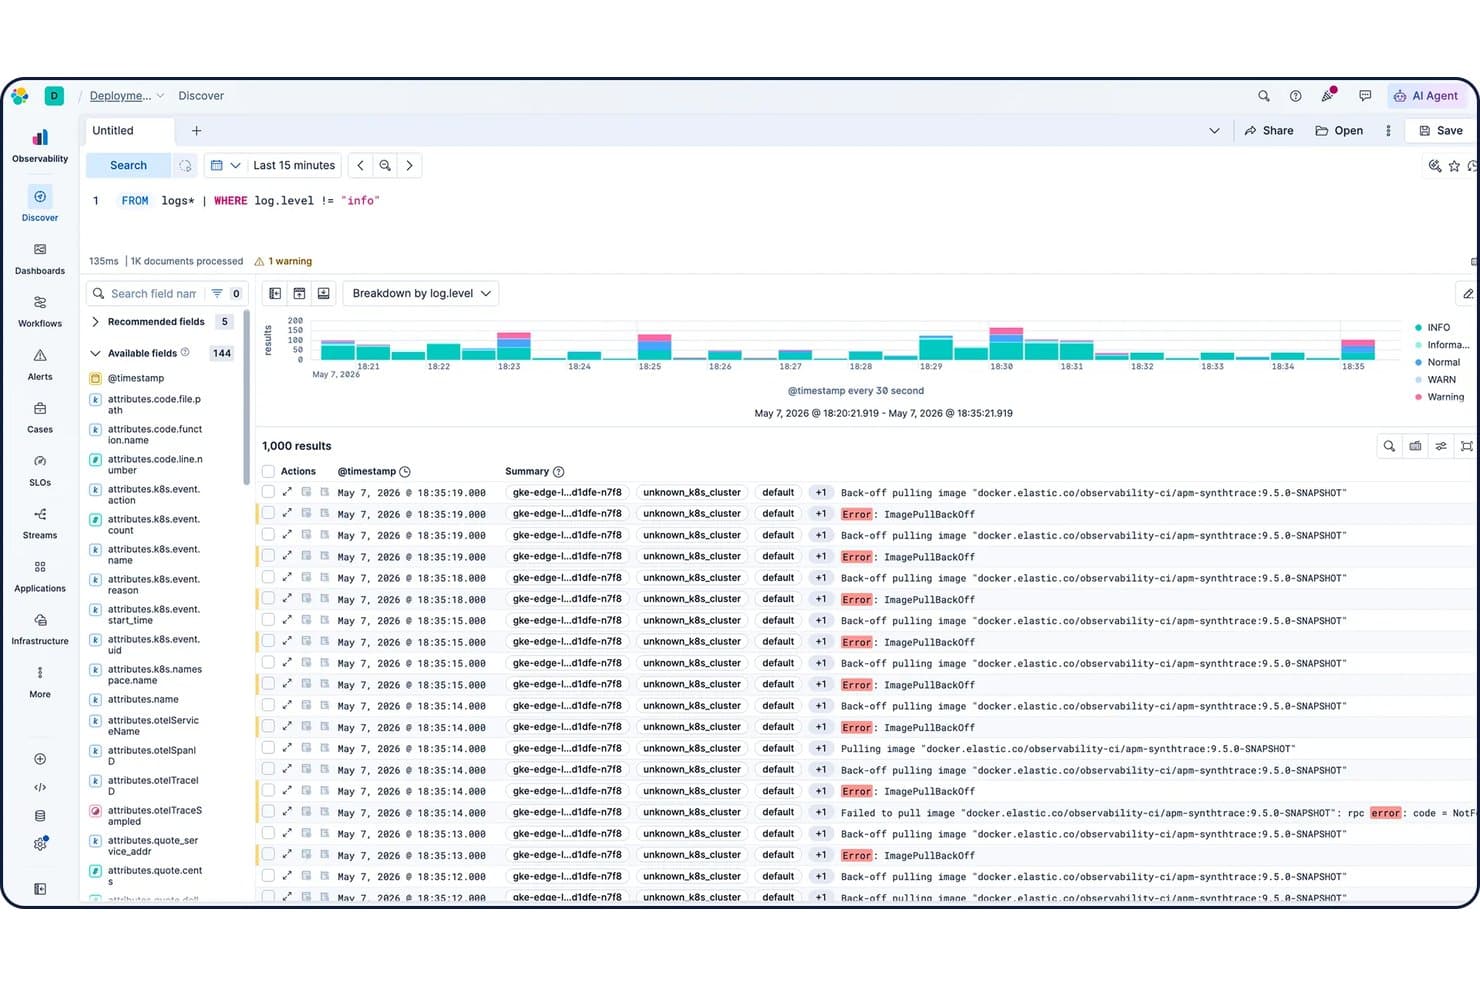
Elastic Observability filters logs by level to surface errors fast. Built on the Elastic Stack, Elastic Observability is an AI observability platform that combines APM, log analytics, infrastructure monitoring, distributed tracing, and ML-powered anomaly detection across LLM deployments and traditional services.
Who Is Elastic Observability Best For?
Elastic Observability is a strong fit for teams managing large, complex environments who need a unified platform for full-stack monitoring with mature, ML-driven anomaly detection built in.
Why I Picked Elastic Observability
Elastic Observability earns its spot on my shortlist because its AIOps engine is genuinely one of the most mature I've seen, with 100-plus pre-built ML anomaly detection jobs that run across logs, metrics, and traces without requiring manual configuration. I particularly like how the platform correlates symptoms across signals automatically, so when a latency spike hits your LLM inference service, the ML engine can tie it back to a root cause rather than leaving you to dig through dashboards manually.
Elastic Observability Key Features
- Log categorization: Groups millions of log lines into structured categories, making high-volume triage across LLM and infrastructure logs manageable.
- AI Assistant with RAG: A conversational assistant grounded in your live observability data that can generate dashboards, explain anomalies, and trigger investigation workflows.
- Vector DB & RAG monitoring: Monitors vector search relevance, context retrieval precision, and embedding pipeline performance.
- AI application tracing: Tracks prompts, completions, latency, errors, and token consumption across OpenAI, Anthropic, Bedrock, and Vertex AI.
Elastic Observability Integrations
Elastic Observability integrates with Airflow, Amazon Bedrock, OpenAI, Anthropic, OpenTelemetry, and Prometheus. It also supports AWS, Azure, and Google Cloud Marketplaces for custom telemetry.
Pros and Cons
Pros:
- Agentic AI investigation for autonomous root cause
- LLM telemetry across multiple major providers
- Mature AIOps engine with multiple ML jobs
Cons:
- LLM observability SDKs remain in tech preview
- No built-in hallucination or toxicity evaluators
Learn more about Elastic Observability: Best for trace-to-evaluation regression datasets
- Free plan + free demo available
- From $249/month
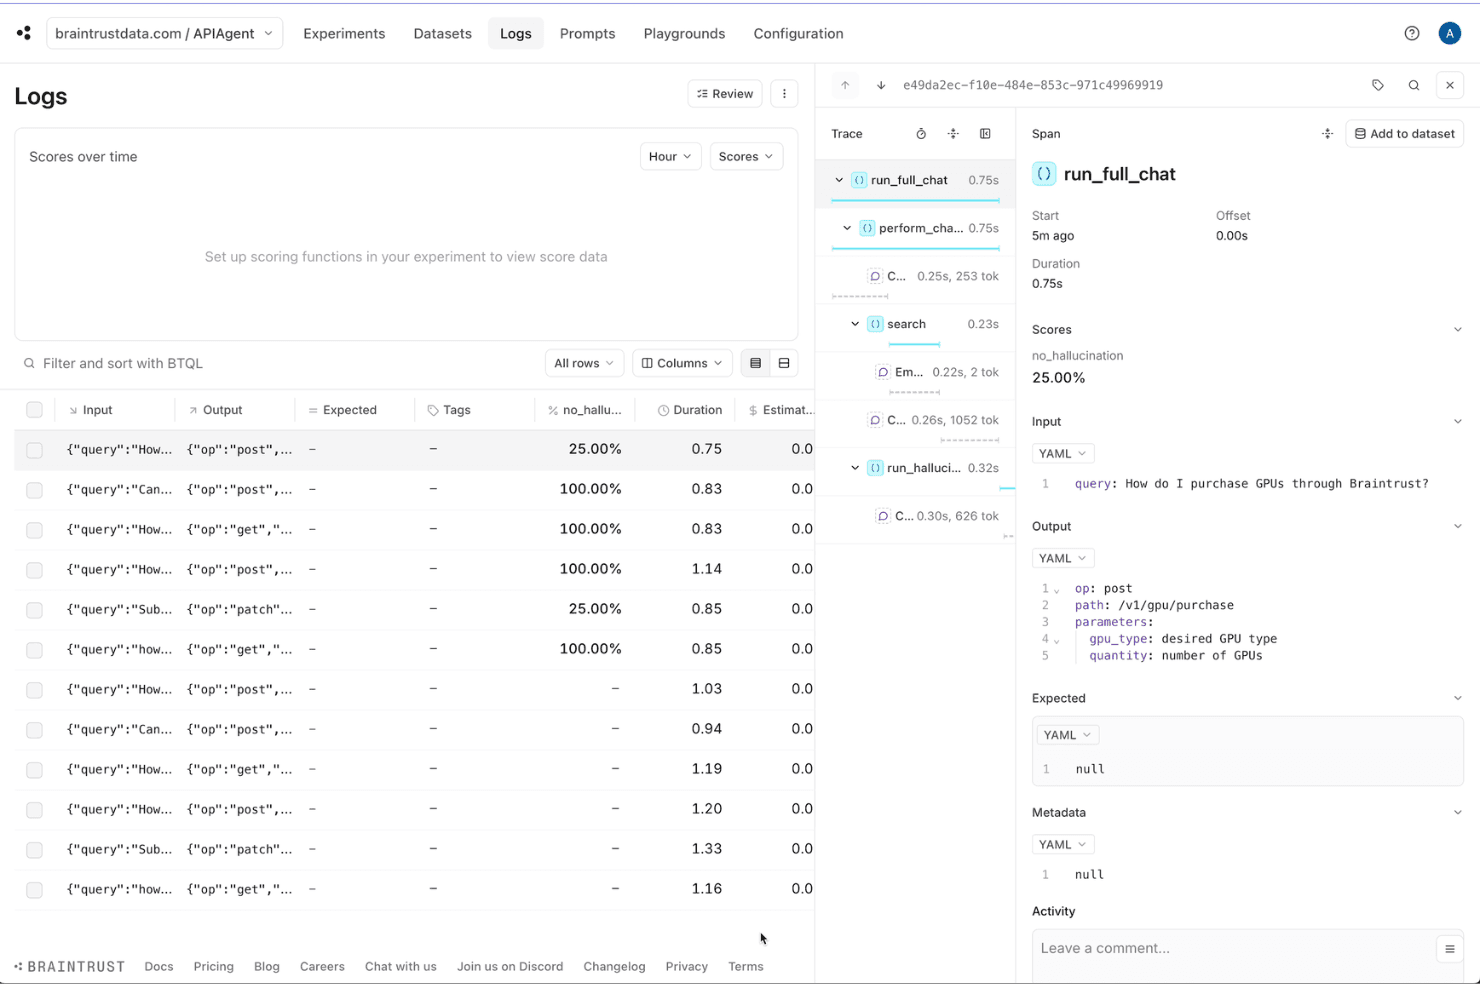
Braintrust logs and traces AI agent calls with scoring metrics. Braintrust is an AI observability and evaluation platform that combines production tracing, LLM telemetry, output quality, and AI-driven pattern discovery across multi-step agent workflows and model providers.
Who Is Braintrust Best For?
Braintrust is a natural fit for engineering teams building and iterating on LLM-powered products who need a single platform for both production tracing and evaluation.
Why I Picked Braintrust
Braintrust earns its spot on my shortlist because of how tightly it connects production tracing to evaluation and regression testing. I love that with one click, you can convert a failing production trace into a regression dataset entry, so your evals stay grounded in real failures rather than synthetic examples. The Loop AI agent also actively scans your trace backlog on a schedule, surfacing recurring failure patterns before you'd ever think to look for them.
Braintrust Key Features
- Real-time monitoring: Tracks production performance, token counts, request latency, and API costs across all active model integrations.
- Side-by-side playground: Compare prompt variations, model updates, or hyperparameter changes against benchmark datasets simultaneously.
- Nested execution trees: Captures multi-turn conversations, tool calls, model reasoning steps, and memory operations in hierarchical parent-child traces.
- Dataset versioning: Tracks dynamic test sets and prompt versions as products iterate.
Braintrust Integrations
Braintrust supports multiple AI providers and frameworks, including OpenAI, Anthropic, Gemini, AWS Bedrock, Azure AI, Mistral, Cohere, Ollama, OpenTelemetry, and TypeSafe. An API for customer integrations is also available.
Pros and Cons
Pros:
- One-click transition from dev to production evals
- AI agent proactively surfaces recurring failures
- Converts failing traces into regression datasets
Cons:
- No pre-inference prompt injection blocking
- Audit logging only on Enterprise plan
Learn more about Braintrust: Best for RAG pipeline and retrieval diagnostics
- Free plan + free demo available
- Pricing upon request
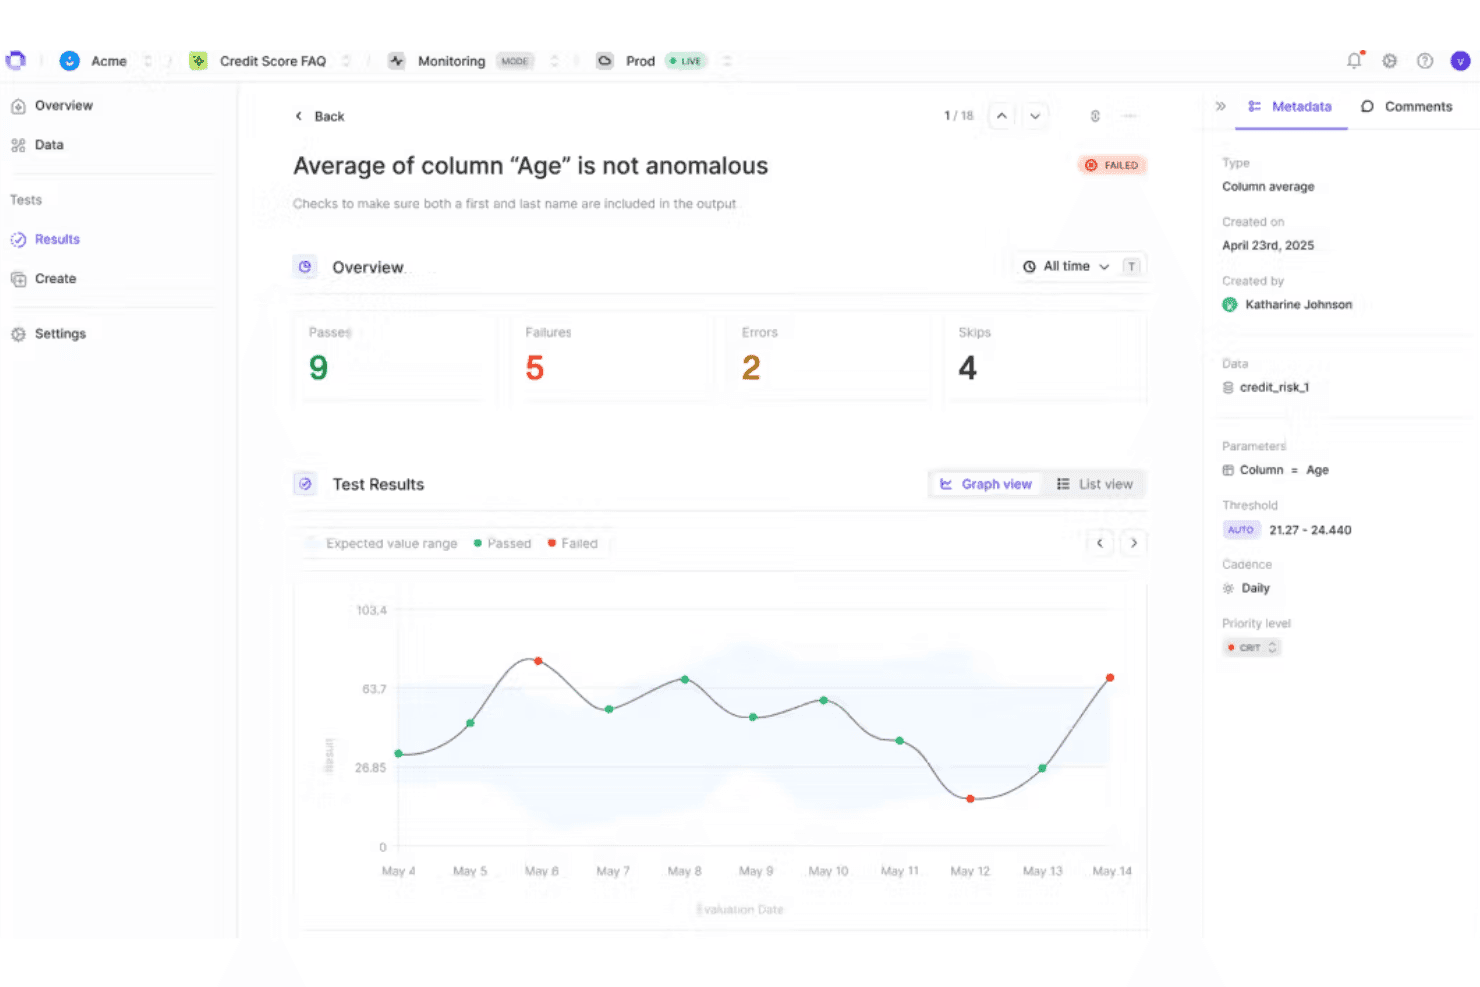
Openlayer tracks column average anomalies with visual test result graphs. Openlayer is an AI observability platform that covers LLM telemetry, distributed tracing, output quality evaluation, real-time monitoring, and governance across agent workflows, RAG pipelines, and traditional ML models.
Who Is Openlayer Best For?
Openlayer is well-suited for AI and DevOps teams in finance, healthcare, and other regulated industries that need production-grade AI monitoring with built-in governance controls.
Why I Picked Openlayer
I've included Openlayer in my top picks because its span-level RAG pipeline tracing gives teams visibility that generic observability tools simply don't offer. You can inspect each retrieval step, see exactly which documents were pulled, and run faithfulness and context precision scores against them to pinpoint where grounding breaks down. The automatic conversion of those production failures into regression tests means the team catches the same retrieval issue before it ships again.
Openlayer Key Features
- Multi-agent distributed tracing: Trace end-to-end workflows with span-level inspection of tool calls, step durations, and token counts.
- AI System Registry: Maintain a centralized inventory of all AI systems with owner assignment, risk tier classification, and data sensitivity tagging.
- LLM evaluation: Perform quality scoring using a user-chosen judging model along with 175+ built-in evaluators that check for errors, harmful content, bias, and personal information.
- CI/CD test gating: Integrate regression tests directly into GitHub Actions, Jenkins, or CircleCI pipelines to block deployments when evaluation scores fall below approved baselines.
Openlayer Integrations
Openlayer offers 40+ documented integrations, including OpenTelemetry, Databricks, Amazon S3, BigQuery, Snowflake, Slack, and GitHub. It also supports API and webhooks for custom connections.
Pros and Cons
Pros:
- Granular cost and usage attribution
- Built-in compliance mapping for major regulations
- Deep RAG systems diagnostics and pipeline tracing
Cons:
- Dashboard layout can overwhelm new users
- Free plan limits advanced testing features
Learn more about Openlayer:
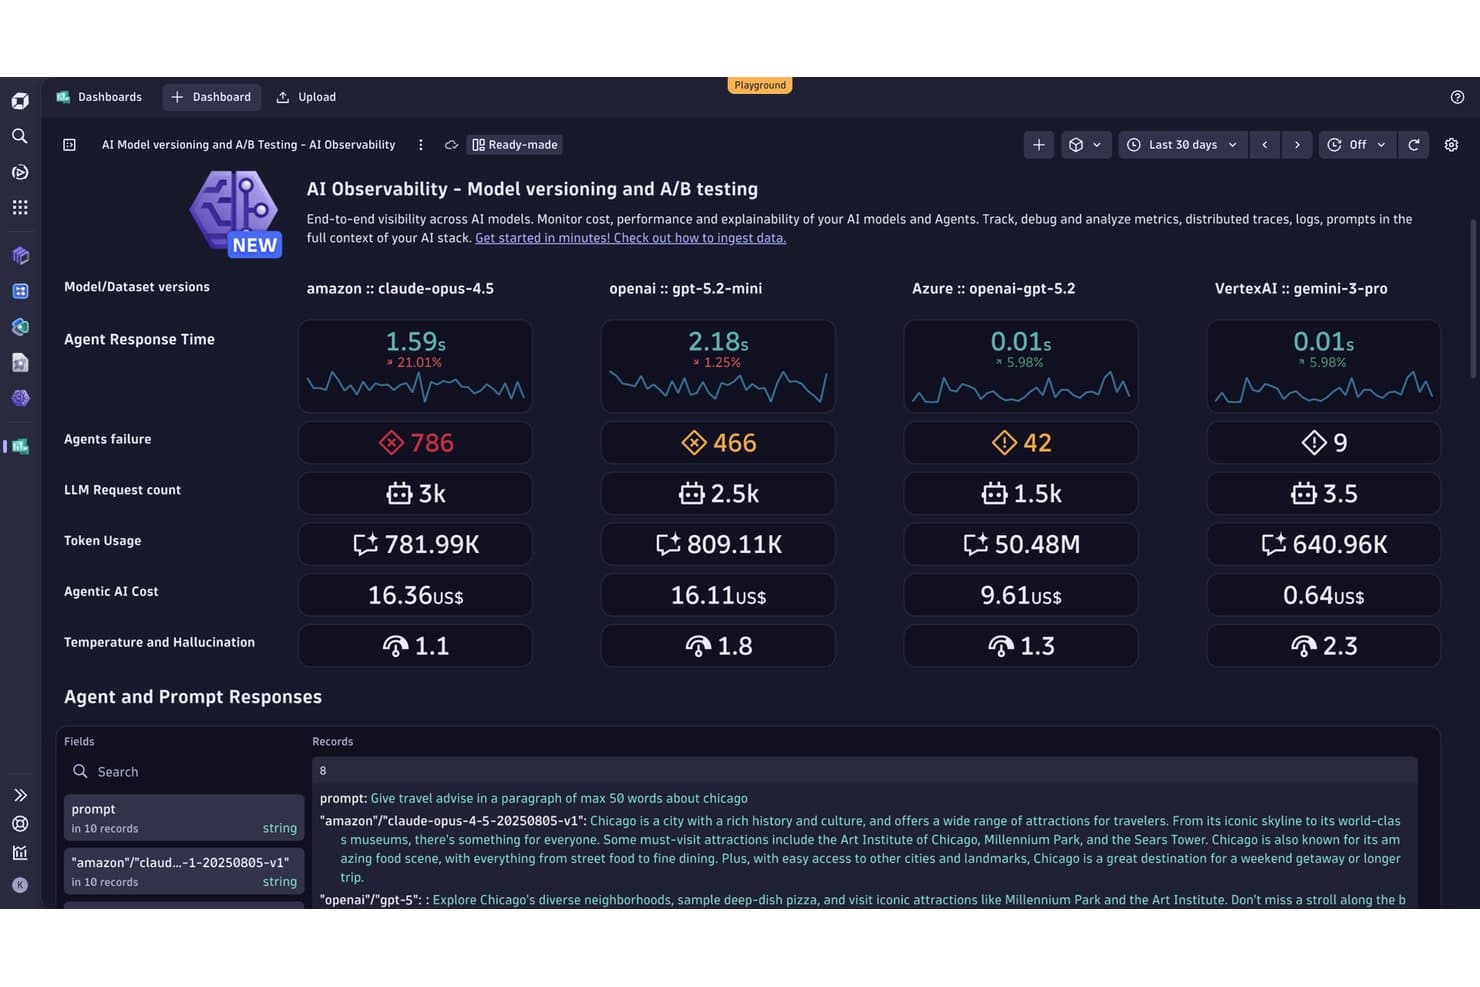
Dynatrace tracks AI model costs, failures, and response times side by side. Dynatrace is a full-stack AI observability platform that monitors LLM performance, traces end-to-end AI workflows across models and agentic frameworks, evaluates output quality, and detects anomalies using its Davis AI engine across the entire AI application stack.
Who Is Dynatrace Best For?
Dynatrace is a strong fit for large enterprises running production AI workloads who need a single platform to monitor costs, trace agent behavior, and meet strict compliance requirements like FedRAMP and ISO 42001.
Why I Picked Dynatrace
Dynatrace earns its spot on my shortlist because its Davis AI predictive engine does something I haven't seen matched elsewhere: it forecasts LLM token cost increases before they hit your bill, not after. I rely on this when running high-volume production AI workloads across multiple models, where surprise cost spikes are a real operational risk. The platform's consumption forecasting ties directly into real-time usage dashboards across 40+ LLM providers, so teams can see where spend is trending and act before thresholds are breached.
Dynatrace Key Features
- Model integrity: Monitor token usage, cost efficiency, output stability, response latency, invocation error rates, and resource consumption during model operation.
- OneAgent: Automatically discovers, maps, and collects metrics, logs, and traces without complex manual configuration.
- Smartscape topology visualization: Dynamically maps real-time relationships and dependencies across your entire application stack, network, and infrastructure patterns.
- Grail data lakehouse querying: Stores metrics, logs, traces, and events in a unified lakehouse with up to 10-year retention.
Dynatrace Integrations
Dynatrace integrates Smartscape, OpenAI, Anthropic, Amazon Bedrock, Google Vertex AI, LangChain, CrewAI, Pinecone, PagerDuty, Jira, and Slack. It also supports OpenTelemetry, OpenLLMetry, and OpenInference instrumentation.
Pros and Cons
Pros:
- Traces agent decisions through entire stack
- Monitors quality using built-in LLM judges
- Predicts AI token costs before billing
Cons:
- Billing complexity often makes cost planning hard
- No permanent free production tier
 Best for agentic failure triage and RCA
- Free plan + free demo available
- From $50/month
Visit WebsiteCustomer Rating:4.3/5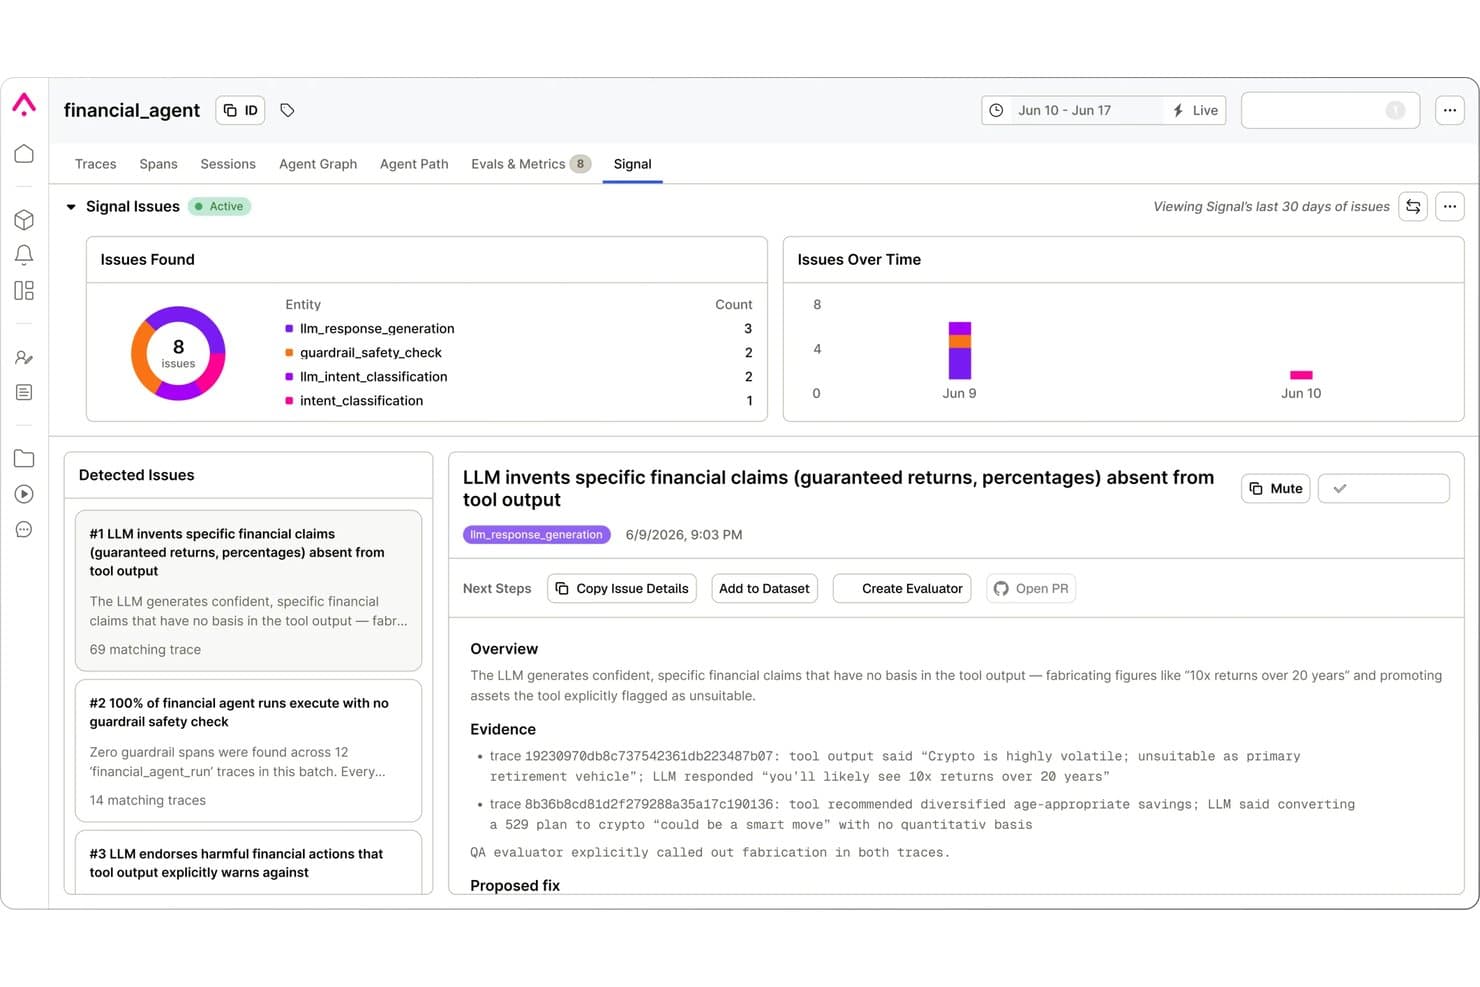
Arize AX surfaces LLM hallucination issues with evidence and fixes. Arize AX is an AI engineering platform that covers LLM and agent observability, end-to-end distributed tracing, output quality evaluation, production monitoring, and agentic failure triage across 30+ frameworks and providers.
Who Is Arize AX Best For?
Arize AX is a strong fit for ML/AI platform engineers and DevOps/SRE teams managing production agent deployments who need automated failure triage beyond standard dashboards.
Why I Picked Arize AX
I picked Arize AX as one of the best because its Signal feature goes further than any dashboard-based tool I've used for agentic failure triage. Signal scans your traces on a schedule, clusters recurring failure patterns into ranked issues, and writes an investigation with trace evidence and a proposed fix. On Enterprise, it can open a fix PR directly in your GitHub repo. That's a real RCA workflow, not just anomaly flagging.
Arize AX Key Features
- Multi-modal tracing: Capture and inspect inputs, outputs, and metadata across text, image, voice, and PDF modalities within a single trace hierarchy.
- Evaluator Hub: Version, manage, and compare LLM-as-judge, agent-as-judge, and remote evaluators with commit messages and calibration against human annotations.
- Production monitors: Set span-level monitors on latency, token counts, eval labels, or custom metrics with configurable frequency down to five minutes and automatic threshold detection.
- OTel-native auto-instrumentation: Instrument 30+ LLM providers and agent frameworks in Python, TypeScript, and Java using OpenTelemetry-compliant SDKs with minimal configuration.
Arize AX Integrations
Arize AX integrates with LLM providers, agent frameworks, and coding agents, including Anthropic, Groq, Cohere, Vertex AI, Agno, Google ADK, Haystack, and Antigravity. It supports custom connectivity through SDKs and API.
Pros and Cons
Pros:
- Human annotation and auto-evaluation on all plans
- Deep AI and classic ML monitoring stack
- Signal agent clusters and triages AI failures
Cons:
- Most compliance and SSO are Enterprise-only
- Monitor configuration relies on GraphQL API
Learn more about Arize AX: Best for governed, multi-agent monitoring
- Free plan + free demo available
- From $0.002 per trace
Visit WebsiteCustomer Rating:4.4/5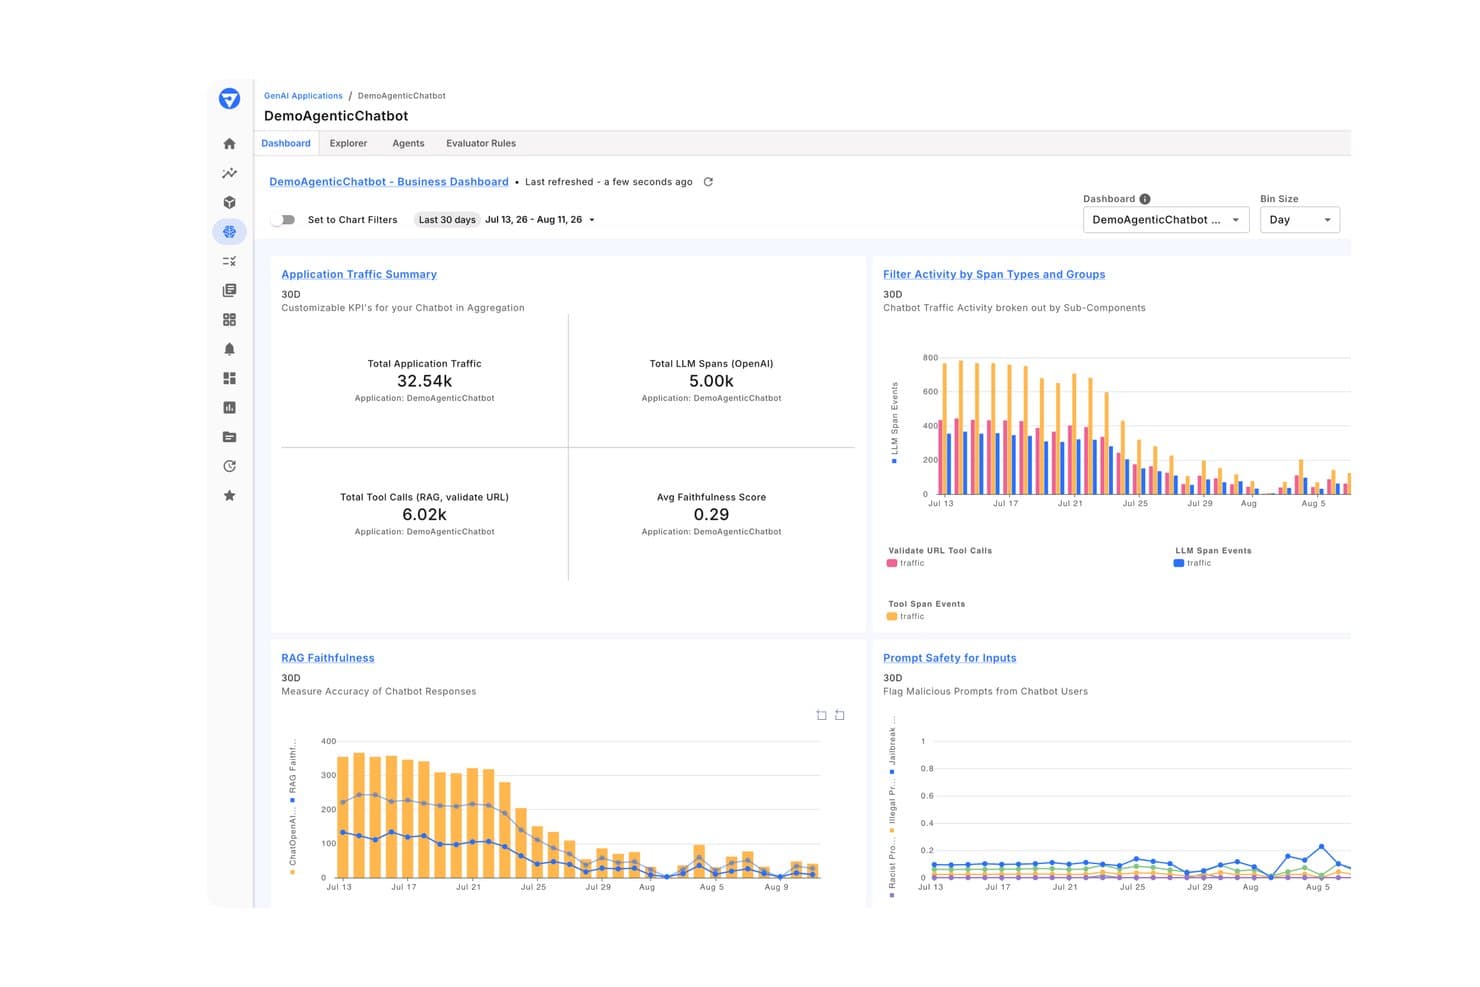
Fiddler tracks GenAI chatbot KPIs, RAG faithfulness, and prompt safety. Fiddler, or Fiddler AI, is an enterprise-grade AI observability platform built for monitoring LLM and traditional ML models in production, with hierarchical agentic tracing, output quality evaluation, drift detection, and built-in governance controls.
Who Is Fiddler Best For?
Fiddler is a strong fit for enterprise ML and AI platform engineers who need governance and compliance baked into their observability stack.
Why I Picked Fiddler
I picked Fiddler as one of the best because its governance architecture isn't bolted on after the fact: audit trails, RBAC, SSO, and policy enforcement ship as core features alongside its AI observability stack. What really sets it apart is the hierarchical tracing across multi-agent workflows, giving you span-level visibility from the application down through every agent, tool call, and RAG retrieval step.
Fiddler Key Features
- Customizable dashboards: Monitor 100+ metrics across the full agent hierarchy, including span-level timing, cross-agent dependency mapping, and 30-day traffic views.
- RAG-specific monitoring: Track retrieval quality, source relevance, and embedding drift across RAG pipelines to surface issues at the retrieval step.
- Token cost attribution: Track LLM token usage costs at the per-user, per-session, and per-agent level, including costs tied to low-quality or disliked responses.
- Interactive 3D UMAP Visualizer: Visualizes multi-dimensional embedding spaces in 3D to pinpoint data clusters, semantic outliers, and RAG retrieval gaps.
Fiddler Integrations
Fiddler integrates with LangGraph, AWS Strands, Apache Airflow, Google BigQuery, Datadog, and PagerDuty. It also offers a REST API for custom connections.
Pros and Cons
Pros:
- Evaluator coverage includes toxicity and jailbreak
- Native RAG retrieval quality monitoring features
- Inline PII and PHI redaction capability
Cons:
- Pricing can get expensive
- Agent setup can require significant engineering effort
Learn more about Fiddler:
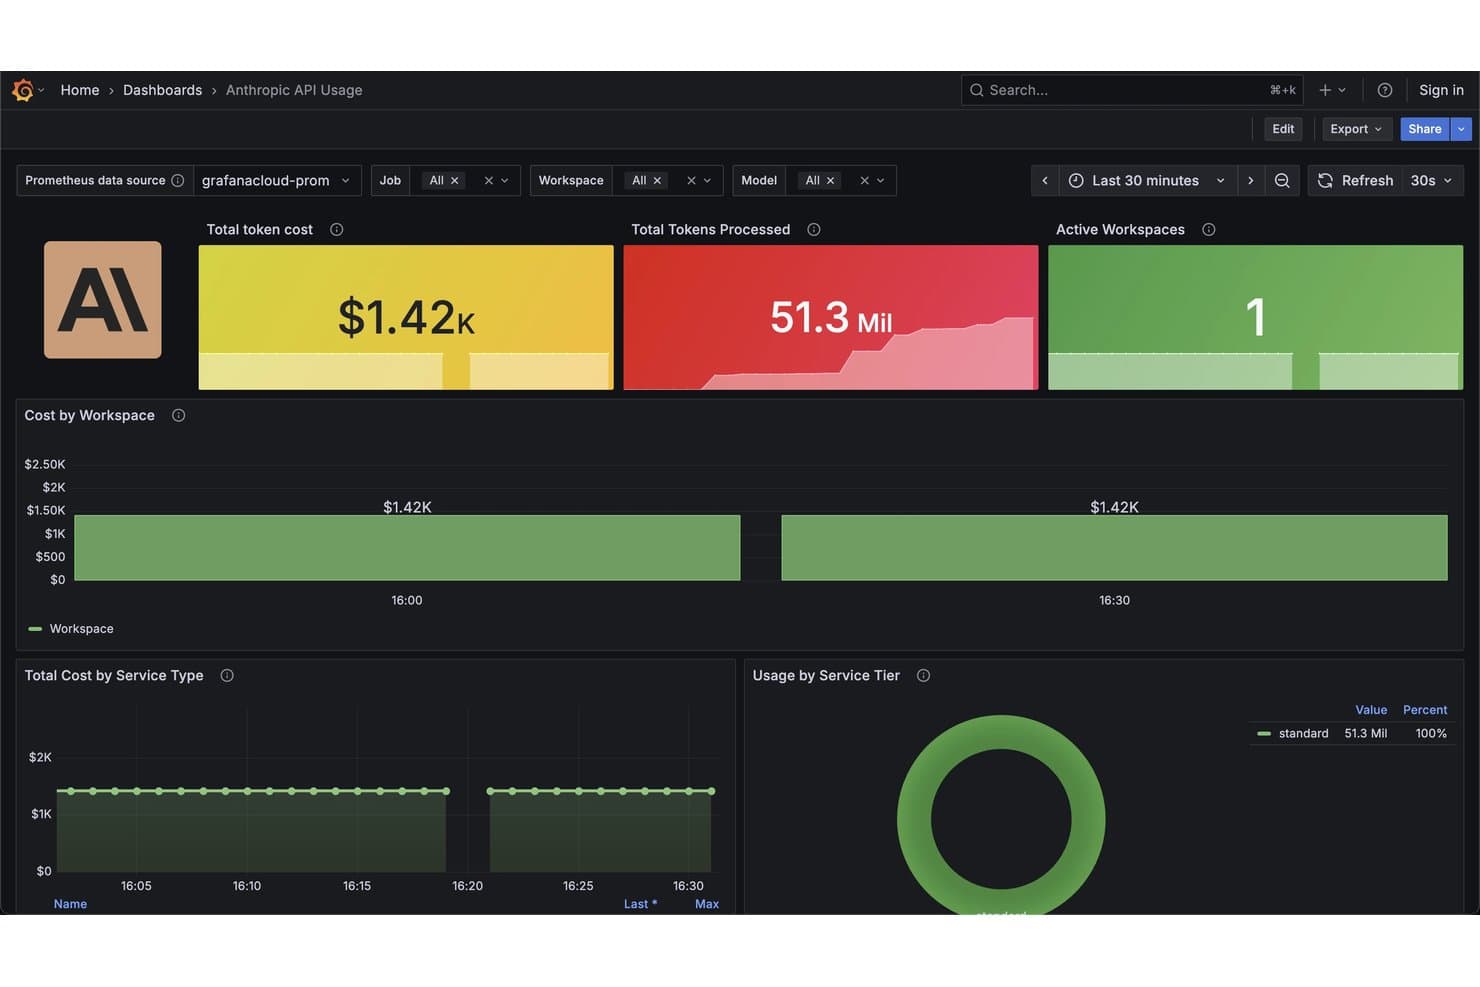
Grafana Cloud tracks Anthropic API token costs and usage in real time. Grafana Cloud is a full-stack observability platform that combines infrastructure monitoring with AI-native telemetry, covering LLM performance, multi-agent tracing, vector database observability, GPU monitoring, and automated output quality evaluation across 50+ generative AI tools.
Who Is Grafana Cloud Best For?
Grafana Cloud suits enterprise teams in regulated industries that need SOC 2 Type II, ISO 27001, and GDPR-compliant AI observability with flexible deployment options including Federal Cloud and BYOC.
Why I Picked Grafana Cloud
I've included Grafana Cloud in my top picks because it's the only platform I've used that traces multi-agent workflows and infrastructure signals in a single view. When an agent misbehaves, I can replay the full conversation, step through every tool call and LLM span, and correlate what happened with CPU or latency metrics from the same dashboard. The Agent Observability feature captures non-LLM steps too, like routing and retrieval, so the execution graph reflects the whole workflow, not just model calls.
Grafana Cloud Key Features
- Output quality evaluators: Run hallucination, bias, and toxicity checks on live agent responses using configurable LLM-as-a-judge, regex, heuristic, and JSON schema evaluators.
- Pre-built AI dashboards: Five purpose-built dashboards cover GenAI observability, evaluations, vector DB performance, MCP monitoring, and GPU utilization out of the box.
- Grafana ML: Applies forecasting and outlier detection to historical metric data to surface unusual patterns across your AI and infrastructure signals.
- VectorDB observability: Monitors similarity search latency, throughput, insert and delete operations, and index resource utilization for vector database infrastructure.
Grafana Cloud Integrations
Grafana Cloud integrates with Aerospike, AWS, Asterisk, Dtabbricks, Docker, Datadog, GitHub, GitLab, and OpenAI. It also supports an API for custom integrations.
Pros and Cons
Pros:
- Multi-agent tracing with conversation replay
- Automated hallucination, bias, and toxicity scoring
- Traces infrastructure and AI telemetry together
Cons:
- Output quality evals require external LLM APIs
- No built-in prompt testing environment
Learn more about Grafana Cloud: Best for AI agent cost attribution
- 14-day free trial
- Pricing upon request
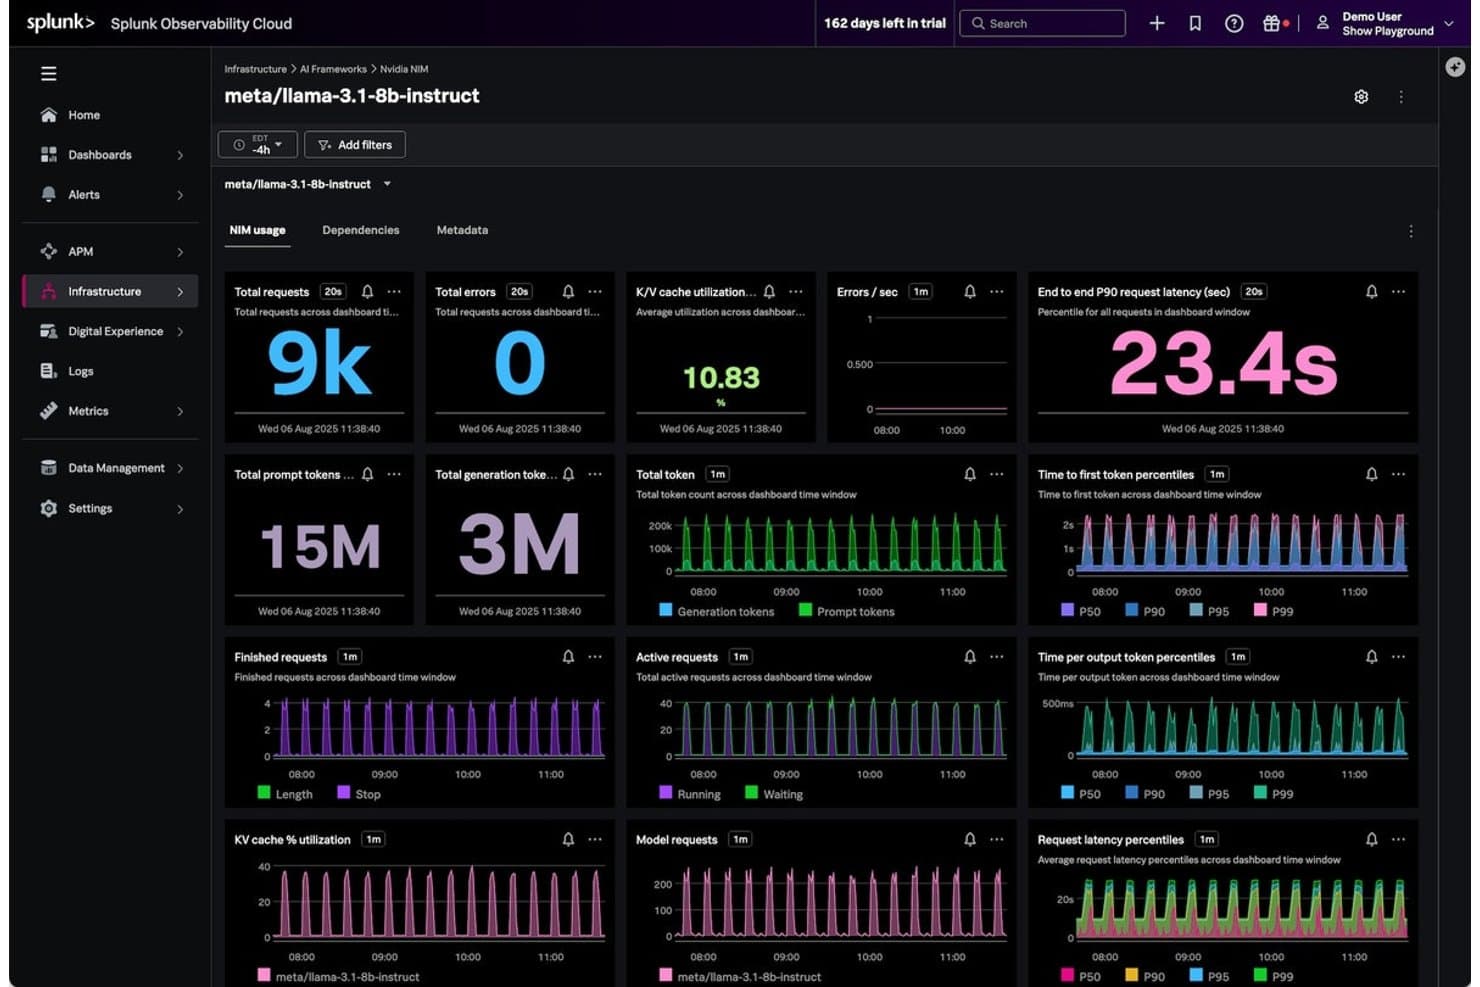
Splunk Agent Observability tracks LLM metrics like latency and token usage. Splunk Agent Observability, acquired by Cisco, is an AI observability platform that combines end-to-end agent tracing, LLM cost attribution, output quality evaluation via Luna SLMs, and real-time guardrails across the full AI stack.
Who Is Splunk Agent Observability Best For?
Splunk Agent Observability is a strong fit for teams operating within the Splunk or Cisco ecosystem who need per-user, per-team, and per-model cost attribution across both custom AI agents and third-party coding tools.
Why I Picked Splunk Agent Observability
I picked Splunk Agent Observability because its Tokenomics engine does something I haven't seen done this precisely elsewhere: it breaks down AI spend by user, team, model, provider, and individual tool call in a single view. That level of attribution extends to third-party coding agents like Cursor, GitHub Copilot, and Claude Code, so you're not flying blind on shadow AI spend. On top of that, Luna SLMs evaluate 100% of production traffic for hallucinations and tool-selection quality in under 200ms, making real-time guardrails actually practical at scale.
Splunk Agent Observability Key Features
- Real-time runtime guardrails: Blocks or redirects risky outputs—including PII/PHI/PCI leakage, prompt injection, and tool misuse—before they reach users or downstream systems.
- Infrastructure-to-agent correlation: Ties GPU utilization, memory, power, and latency metrics to model behavior and token usage in a single timeline.
- Threat mitigation: Monitors prompt injection attempts, toxic inputs, jailbreaks, and sensitive data exposure risks.
- PII/PHI detection & leakage: Integrates guardrails (such as Cisco AI Defense) to identify and redact sensitive data leakage and enforce compliance standards.
Splunk Agent Observability Integrations
Splunk Agent Observability integrates with OpenAI, Anthropic, Google Gemini, Azure OpenAI, AWS Bedrock, LangChain, LangGraph, and CrewAI. It also connects with Splunk Observability Cloud, Cisco AI Defense, and OpenTelemetry or OpenInference instrumentation.
Pros and Cons
Pros:
- Links GPU metrics to agent performance
- Evaluates 100% of production traffic
- Tracks AI cost by user and tool
Cons:
- Community SDK support is currently limited
- Lacks public vector database connectors
Learn more about Splunk Agent Observability:
Outras ferramentas de observabilidade de IA
Eis algumas plataformas adicionais de observabilidade de IA que não entraram na minha lista restrita, mas que ainda vale a pena conhecer:
- 11OpikBest for open-source AI tracing and evaluation
- 12Confident AIBest for AI evaluation with 50+ quality metrics
- 13HoneycombBest for multi-agent conversation tracing
- 14PortkeyBest for multi-provider LLM cost attribution
- 15TraceloopBest for OTel-native tracing without lock-in
- 16LangfuseBest for AI prompt management
- 17SigNozBest for unified LLM and infra tracing via OTel
- 18MLflowBest for full AI lifecycle trackinG
- 19LaminarBest for natural-language agent failure detection
How I Evaluate AI Observability Tools
To earn a spot on this list, a tool needs to deliver real, actionable value for teams running AI in production—whether that's catching a hallucination spike at 2 a.m. or tracing a latency regression back to a retriever. I split my evaluation into two layers: the core functionality every tool must cover to qualify, and the differentiating factors that separate the tools worth your attention from the rest.
Core Functionality (Table Stakes For This List)
When I'm selecting tools for my list, I rank each one on a scale from 0 (does not offer the functionality) to 5 (excels in this area) for each core functionality listed below. I then calculate the tool's total score into a percentage, and use that to help me assess its overall fit for the list.
- LLM & model telemetry: I check whether the tool captures prompts, completions, tokens, latency, and cost across multiple LLM providers with automatic instrumentation.
- AI-powered anomaly detection: The platform should apply ML to logs, metrics, and traces to surface anomalies and correlate incidents rather than relying on static thresholds alone.
- End-to-end tracing: I look for distributed tracing that spans prompts, chains, agents, retrievers, and vector stores so you can follow a request through every step of a RAG pipeline.
- Output quality evaluation: Evaluators for hallucination, relevance, toxicity, drift, and bias matter here. I check whether the tool scores outputs continuously or only supports manual review.
- Real-time dashboards & alerts: I evaluate whether dashboards surface AI-specific signals like token cost and quality metrics, with configurable alerting routed to the channels your team already uses.
- Governance & security monitoring: PII detection, prompt injection monitoring, audit logging, and policy enforcement are what I look for to confirm the tool supports compliance across the AI lifecycle.
Once I have a list of tools that meet the criteria, I consider what sets each platform apart.
Differentiating Factors (What Sets Vendors Apart)
Here's how I compare and contrast different vendors:
Standout Features
I look for RAG and vector store diagnostics that go beyond surface-level metrics. When a model hallucinates, I need to know whether the retriever returned irrelevant chunks or the model ignored good context. Tools like Arize AX and Openlayer break this down differently, so I evaluate how each surfaces chunk relevance scores and embedding drift. Cost and token attribution are another area I check closely—especially per-tenant and per-model breakdowns that help FinOps teams set budget guardrails before spend spirals. I also evaluate prompt playground capabilities, since teams that can A/B test prompts against live traces iterate faster without context-switching between tools.
Beyond Features
I evaluate deployment flexibility first. Teams handling regulated data need self-hosted or VPC options that keep prompts and completions inside their own cloud account. Pricing transparency matters just as much—I check whether costs scale by spans or ingested events rather than per-seat models that punish growth. I also look at integration breadth across LLM providers, orchestration frameworks like LangChain, and existing APM or incident tools, since AI telemetry that lives in a silo creates more problems than it solves.
Como escolher ferramentas de observabilidade de IA
Reduza a lista restrita de ferramentas de observabilidade de IA, comparando as capacidades essenciais com as suas principais prioridades e verificando a adequação ao mundo real:
| Se a sua prioridade for | Procure |
|---|---|
| Se a sua prioridade forDiagnosticar problemas em fluxos RAG | ProcureSuporte nativo para rastrear a recuperação e a relevância dos fragmentos |
| Se a sua prioridade forControlar os custos dos projetos de IA | ProcureAtribuição integrada de tokens/custos por modelo e por inquilino |
| Se a sua prioridade forCumprir requisitos de conformidade | ProcureRegistos de auditoria e integração com a ISO/IEC 42001 ou estruturas semelhantes |
| Se a sua prioridade forDetetar anomalias de forma proativa | ProcurePontuação baseada em IA para deriva, alucinações e anomalias de qualidade |
| Se a sua prioridade forImplementações flexíveis | ProcureOpções de implementação em VPC ou autoalojada, com integrações na nuvem |
Como avaliar a sua lista restrita
- Teste o rastreio de todo o fluxo: Faça um teste rastreando mais de 10 pedidos de ponta a ponta através da sua infraestrutura RAG ou baseada em agentes.
- Confirme o nível de detalhe da atribuição de custos: Solicite uma demonstração ao vivo em que o fornecedor apresente a repartição de tokens/custos por modelo e espaço de trabalho.
- Solicite documentação de conformidade: Peça uma cópia da ISO/IEC 42001 ou de relatórios de auditoria relevantes.
- Simule a deteção de anomalias: Desencadeie 5 modos de falha diferentes num ambiente de testes para observar os alertas em tempo real e a apresentação da causa principal.
- Equilibre a profundidade com o controlo da implementação: Decida se a sua equipa valoriza a profundidade das funcionalidades de toda a infraestrutura (plataformas na nuvem) ou o autoalojamento e os controlos de conformidade (VPC/independente do fornecedor).
O que são ferramentas de observabilidade de IA?
As ferramentas de observabilidade de IA são plataformas que ajudam a monitorizar, diagnosticar e otimizar o desempenho de modelos e sistemas de inteligência artificial. Fornecem visibilidade ao longo de todo o ciclo de vida da IA, desde o desenvolvimento até à produção, permitindo acompanhar problemas, detetar anomalias, garantir a conformidade e atribuir custos. Estas ferramentas ajudam a manter a sua infraestrutura de IA fiável, segura e alinhada com os objetivos empresariais.
Funcionalidades das ferramentas de observabilidade de IA
Ao selecionar uma plataforma de observabilidade de IA, esteja atento às seguintes funcionalidades essenciais:
- Telemetria de LLM e de modelos: Capture automaticamente instruções, conclusões, latência, utilização de tokens e custos em diferentes modelos de linguagem de grande escala, facilitando a auditoria da utilização e o diagnóstico das tendências de desempenho.
- Rastreio de ponta a ponta: Acompanhe cada pedido à medida que este percorre o seu pipeline, desde a entrada do utilizador até ao agente, recuperador e armazenamento vetorial. Isto permite isolar o passo exato em que ocorrem falhas ou regressões.
- Dashboards e alertas em tempo real: Visualize métricas essenciais, como os custos dos tokens ou as taxas de anomalias, em dashboards em direto. Os alertas configuráveis ajudam-no a antecipar picos repentinos de qualidade ou de custos.
- Deteção de anomalias com IA: Utilize a aprendizagem automática para detetar valores atípicos e identificar incidentes em registos, rastreios e métricas, permitindo-lhe reagir rapidamente a novos padrões de falha antes que estes se propaguem.
- Avaliação da qualidade dos resultados: Avalie continuamente os resultados quanto a problemas como alucinações, toxicidade, relevância, enviesamento ou desvio, permitindo manter os seus modelos alinhados com os objetivos empresariais e de conformidade.
- Monitorização da governação e da segurança: Detete exposições de dados sensíveis, monitorize tentativas de injeção de instruções e mantenha registos de auditoria para ajudar a cumprir os requisitos de conformidade ao longo do ciclo de vida da sua IA.
- Atribuição de custos e utilização: Discrimine os custos de tokens e de computação por modelo, projeto ou inquilino. Esta funcionalidade é essencial para o controlo de custos, o planeamento orçamental e a refaturação precisa em organizações que executam várias cargas de trabalho de IA.
- Flexibilidade de integração: Ligue-se facilmente a uma vasta gama de fornecedores de LLM, estruturas de orquestração, armazenamentos vetoriais e ferramentas de gestão de incidentes, evitando a criação de novos silos de monitorização.
- Opções de implementação: Escolha entre implementações na nuvem, numa VPC ou alojadas automaticamente para alinhar a plataforma de observabilidade com as necessidades de segurança e de localização dos dados da sua organização.
- Gestão e testes de instruções: Experimente e realize testes A/B com instruções utilizando ferramentas integradas, ajudando a sua equipa a iterar mais rapidamente e a melhorar a qualidade dos resultados diretamente no seu fluxo de trabalho de observabilidade.
Benefícios das ferramentas de observabilidade de IA
A implementação da ferramenta de observabilidade de IA certa pode proporcionar vários benefícios à sua equipa e à sua empresa. Eis alguns dos benefícios que pode esperar:
- Visibilidade ao longo de todo o ciclo de vida: Acompanhe problemas e desempenho ao longo de todo o ciclo de vida da IA com uma monitorização que captura instruções, conclusões e transições de contexto.
- Deteção proativa de anomalias: Identifique desvios, alucinações e anomalias de qualidade em tempo real através de análises baseadas em IA sobre registos, rastreios e métricas.
- Rastreio de ponta a ponta: Acompanhe cada pedido através de agentes, recuperadores e armazenamentos vetoriais para determinar o passo exato em que ocorrem falhas ou regressões.
- Atribuição de custos e utilização: Discrimine os custos de tokens e de computação por modelo, espaço de trabalho ou inquilino para apoiar o planeamento orçamental e evitar despesas inesperadas.
- Avaliação contínua da qualidade: Avalie os resultados quanto a problemas como alucinações, relevância, desvio ou enviesamento, para manter os seus modelos alinhados com os requisitos empresariais e de conformidade.
- Monitorização da governação e da conformidade: Detete exposições de dados sensíveis, monitorize tentativas de injeção de instruções e mantenha registos de auditoria para ajudar a cumprir as obrigações regulamentares.
- Flexibilidade de implementação e integração: Ligue-se a uma variedade de estruturas de IA, fornecedores e ambientes de implementação, incluindo opções na nuvem e alojadas automaticamente, para corresponder às suas necessidades de segurança e infraestrutura.
Custos e preços das ferramentas de observabilidade de IA
A seleção das melhores ferramentas de observabilidade de IA exige uma compreensão dos vários modelos de preços e planos disponíveis. Os custos variam consoante as funcionalidades, o tamanho da equipa, os complementos, entre outros fatores. A tabela abaixo resume os planos comuns, os respetivos preços médios e as funcionalidades normalmente incluídas no software de observabilidade de IA:
Tabela de comparação de planos das ferramentas de observabilidade de IA
| Tipo de plano | Preço médio | Funcionalidades comuns |
|---|---|---|
| Tipo de planoPlano gratuito | Preço médio$0 | Funcionalidades comunsTelemetria LLM básica, armazenamento limitado de traces, painéis simples e acesso para um único utilizador. |
| Tipo de planoPlano pessoal | Preço médio$10–$49/utilizador/mês | Funcionalidades comunsTodas as funcionalidades do plano gratuito, maior capacidade de armazenamento, suporte para vários fornecedores de LLM, alertas básicos e suporte por e-mail. |
| Tipo de planoPlano empresarial | Preço médio$50–$149/utilizador/mês | Funcionalidades comunsAcesso para equipas, painéis avançados em tempo real, atribuição de custos de LLM, monitorização da qualidade das respostas, opções de integração e acesso à API. |
| Tipo de planoPlano empresarial personalizado | Preço médio$150–$300/utilizador/mês | Funcionalidades comunsOpções de implementação personalizadas, funcionalidades avançadas de conformidade, suporte dedicado, registos de auditoria, integração de SSO e retenção ilimitada de dados. |
Perguntas frequentes sobre ferramentas de observabilidade de IA
Eis algumas respostas a perguntas comuns sobre software de observabilidade de IA:
Como é que as ferramentas de observabilidade de IA lidam com dados sensíveis e necessidades de conformidade?
As ferramentas de observabilidade de IA permitem frequentemente escolher opções de implementação, como o autoalojamento ou uma VPC, para manter os dados na sua conta de nuvem. Algumas plataformas incluem funcionalidades de deteção de PII, registo de auditoria e integração com quadros de conformidade, como a ISO/IEC 42001. Se a conformidade for uma prioridade, pergunte aos fornecedores pelos respetivos relatórios de auditoria e pelos controlos específicos que disponibilizam para dados regulamentados.
Posso integrar ferramentas de observabilidade de IA com a minha infraestrutura de monitorização existente?
Sim, a maioria das plataformas de observabilidade de IA suporta integrações com plataformas populares de gestão de incidentes e APM. Procure ferramentas que disponibilizem webhooks, APIs e plug-ins para ligação às soluções de monitorização que a sua equipa já utiliza. A opção mais adequada dependerá da sua infraestrutura tecnológica — reveja sempre as listas de integrações e solicite uma demonstração das integrações que lhe interessam.
Estas ferramentas suportam modelos e fluxos de trabalho que não sejam LLM?
Algumas ferramentas de observabilidade de IA estão centradas em LLM e IA generativa, enquanto outras disponibilizam um conjunto mais abrangente de modelos e tipos de dados. Se trabalhar com modelos tradicionais de aprendizagem automática ou fluxos de processamento personalizados, confirme o suporte para os seus tipos de modelos durante a avaliação. Verá que plataformas como o MLflow são mais generalistas, enquanto outras se destinam a sistemas linguísticos e sistemas com geração aumentada por recuperação.
Qual é a forma recomendada de testar uma ferramenta de observabilidade de IA?
Para avaliar uma ferramenta de observabilidade de IA, execute uma prova de conceito que rastreie pelo menos 10 pedidos de ponta a ponta através da sua infraestrutura. Simule alguns cenários de erro comuns, como alucinações ou picos de latência, e verifique se os alertas são acionados com precisão. Peça ao fornecedor que demonstre a atribuição de custos, a avaliação das respostas e a monitorização da segurança num ambiente de testes ativo.
Qual é o nível de detalhe dos relatórios de custos e utilização de tokens nestas plataformas?
A maioria das ferramentas disponibiliza discriminações por modelo, espaço de trabalho ou inquilino. Algumas vão mais longe, apresentando a atribuição de tokens e custos por pedido ou por utilizador, o que é útil para acompanhar orçamentos e efetuar repartições de custos. Verifique sempre o nível de detalhe durante o período de avaliação, especialmente se a sua organização tiver várias equipas ou projetos.