

Gestionar la infraestructura de TI puede ser un quebradero de cabeza, especialmente cuando tus herramientas actuales no se ajustan del todo a tus necesidades. Puede que estés usando Zabbix, pero que consideres que presenta carencias en ciertas áreas. Quizás su complejidad o la falta de integraciones específicas te esté llevando a buscar alternativas.
Según mi experiencia, encontrar la solución de monitorización de código abierto adecuada puede marcar una gran diferencia para tu equipo. Debería facilitarte el trabajo, no complicarlo. He revisado varias opciones para ofrecerte una visión imparcial de las mejores alternativas a Zabbix.
En este artículo encontrarás un análisis detallado de cada herramienta, destacando qué las diferencia. Tanto si buscas una mejor escalabilidad como funciones específicas, aquí encontrarás lo que necesitas.
¿Qué es Zabbix?
Zabbix es una solución de monitorización de código abierto que realiza un seguimiento del rendimiento y la disponibilidad de la infraestructura de TI. Los administradores de TI, los ingenieros de redes y los equipos de DevOps suelen utilizarla para monitorizar recursos de red, servidores y aplicaciones. Las alertas automatizadas, la visualización de datos y las funciones de escalabilidad ayudan a identificar problemas, optimizar el uso de los recursos y garantizar la fiabilidad de los sistemas. En general, Zabbix ofrece una base sólida para mantener y supervisar los entornos de TI.
Tabla comparativa de alternativas a Zabbix
Esta tabla comparativa resume los detalles de precios de mis principales alternativas a Zabbix seleccionadas:
| Tool | Best For | Trial Info | Price | ||
|---|---|---|---|---|---|
| 1 | Ideal para monitoreo unificado | Prueba gratuita de 30 días | Desde $200/mes (facturado anualmente) | Website | |
| 2 | El mejor monitoreo centralizado para grandes empresas | Plan gratuito disponible | Precio bajo consulta | Website | |
| 3 | Ideal para monitoreo predefinido de servicios en la nube | Prueba gratuita de 14 días | Desde $15/host/mes (facturado anualmente) | Website | |
| 4 | Mejor opción para métricas en tiempo real sin configuración | Prueba gratuita de 14 días + plan gratuito + demo gratuita disponible | Desde $4.50/nodo/mes (facturado anualmente) | Website | |
| 5 | Mejor opción para lógica de monitoreo personalizada mediante complementos | Demo gratuita + plan gratis disponible | Desde $2,595/100 nodos | Website | |
| 6 | Mejor por su modelo de observabilidad basado en el uso | Plan gratuito disponible | Desde $49/usuario/mes | Website | |
| 7 | Ideal para monitorización integral y rentable | Plan gratuito + demo gratuita disponible | Desde $29/licencia/mes | Website | |
| 8 | Ideal para ELK gestionado con configuración guiada | Prueba gratuita de 14 días + demo gratuita disponible | Desde $9/mes (facturado anualmente) | Website | |
| 9 | Ideal para el descubrimiento automático de redes SNMP | Demo gratuita disponible | Gratis para usar | Website | |
| 10 | Ideal para observabilidad de código abierto | Prueba gratuita de 30 días + demo gratuita disponible | Desde $49/mes | Website |


Por qué confiar en nuestras recomendaciones de software
6,700+
Reviews
20
Industry experts
16+
Evaluation factors
14
Years
Nuestro equipo lleva probando y evaluando software desde 2012. Como líderes tecnológicos, sabemos lo difícil —y lo importante— que es elegir el software adecuado.
Para esta guía, evaluamos las herramientas mediante pruebas prácticas e investigación independiente, puntuando las herramientas según nuestros criterios de selección.
Nuestras reseñas reflejan nuestro criterio editorial humano, no un discurso de ventas.
Revisores expertos:
- Paulo Gardini MiguelDirector técnico
 Tim FisherVP de IA
 Gabriel RosasTech Lead y arquitecto de software
 Christhian GruhnTech Lead y arquitecto de plataforma

Análisis de las mejores alternativas a Zabbix
A continuación se muestran mis resúmenes detallados de las mejores alternativas a Zabbix que llegaron a mi lista breve. Mis análisis ofrecen una visión detallada de las funciones principales, las ventajas y desventajas, las integraciones y los casos de uso ideales de cada herramienta para ayudarte a encontrar la mejor opción para ti.
 Ideal para monitoreo unificado
- Prueba gratuita de 30 días
- Desde $200/mes (facturado anualmente)
Visit WebsiteCustomer Rating:4.6/5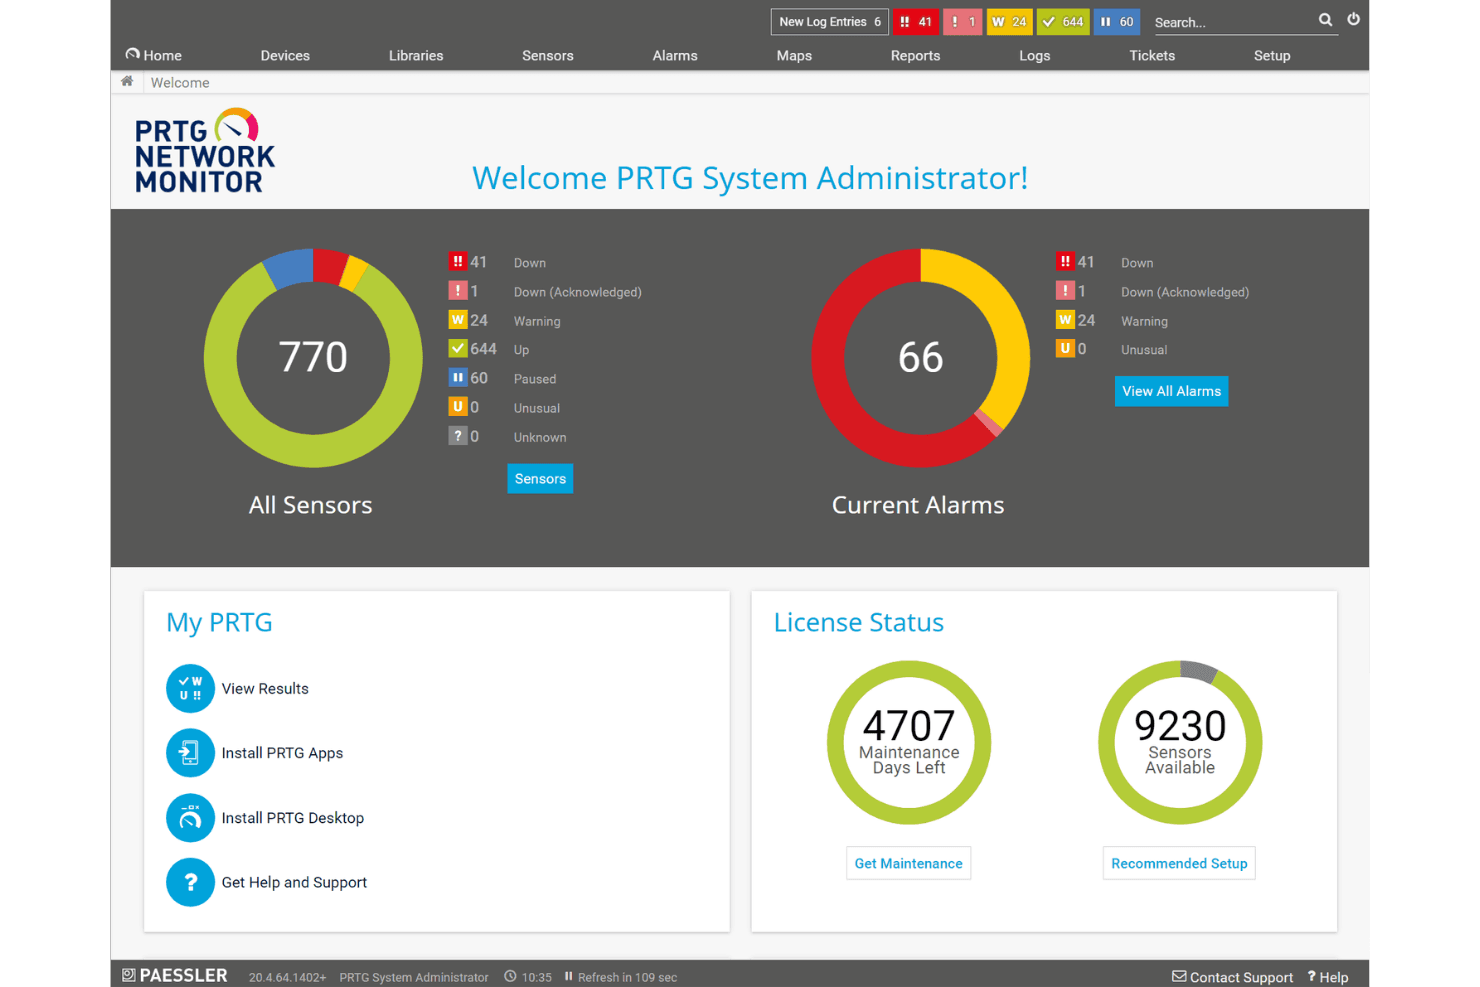
Paessler PRTG muestra un panel centralizado de monitoreo de red con el estado de los sensores, alarmas actuales e información de la licencia de un vistazo. Paessler PRTG es una plataforma integral de monitoreo de infraestructura que ayuda a los equipos de TI a rastrear redes, servidores, aplicaciones y servicios en la nube desde una única interfaz, sin la carga de configuración manual que requieren herramientas de código abierto como Zabbix.
¿Para quién es ideal Paessler PRTG?
Es una excelente opción para equipos de TI medianos y operadores de NOC que necesitan visibilidad rápida y confiable en entornos mixtos locales y en la nube, sin tener que crear la supervisión desde cero.
Por qué Paessler PRTG es una buena alternativa a Zabbix
He incluido Paessler PRTG entre mis mejores opciones porque ofrece una visibilidad híbrida genuina, algo que en Zabbix requiere un trabajo personalizado considerable para replicarse. La arquitectura basada en sensores de PRTG abarca SNMP, WMI, NetFlow, MQTT y Modbus TCP desde una sola interfaz, sin necesidad de plugins adicionales o exportadores manuales para configurar. Me gusta especialmente el Multi-Platform Probe, que integra los datos de dispositivos OT e industriales en los mismos paneles que supervisan la nube y la red, haciendo de PRTG una de las pocas herramientas donde TI y OT convergen sin una capa de integración separada.
Características clave de Paessler PRTG
- Licencias basadas en sensores: Cada métrica que monitoreas cuenta como un sensor, lo que te permite personalizar la cobertura con costos previsibles.
- Diseñador de mapas personalizado: Crea mapas de infraestructura en tiempo real utilizando drag-and-drop para visualizar la topología y el estado de salud de un vistazo.
- Notificaciones multicanal: Configura alertas a través de correo electrónico, notificaciones push, solicitudes HTTP o Microsoft Teams para flujos de respuesta flexibles.
- Sondas remotas: Despliega sondas en sitios o redes remotas para habilitar un monitoreo distribuido y centralizado desde un único panel.
Integraciones de Paessler PRTG
Paessler PRTG ofrece integraciones nativas con Microsoft Teams, AWS, Azure, Google Cloud Platform, Siemens Industrial Edge y ServiceNow. También dispone de una API para integraciones personalizadas.
Pros and Cons
Pros:
- El auto-descubrimiento agiliza la configuración inicial del entorno
- Escala a través de sitios distribuidos mediante sondas remotas
- Monitoriza OT y TI en una sola plataforma
Cons:
- El número de sensores hace que el costo sea elevado a gran escala
- La interfaz web parece anticuada en comparación con alternativas más recientes
Learn more about Paessler PRTG: El mejor monitoreo centralizado para grandes empresas
- Plan gratuito disponible
- Precio bajo consulta
Visit WebsiteCustomer Rating:4.7/5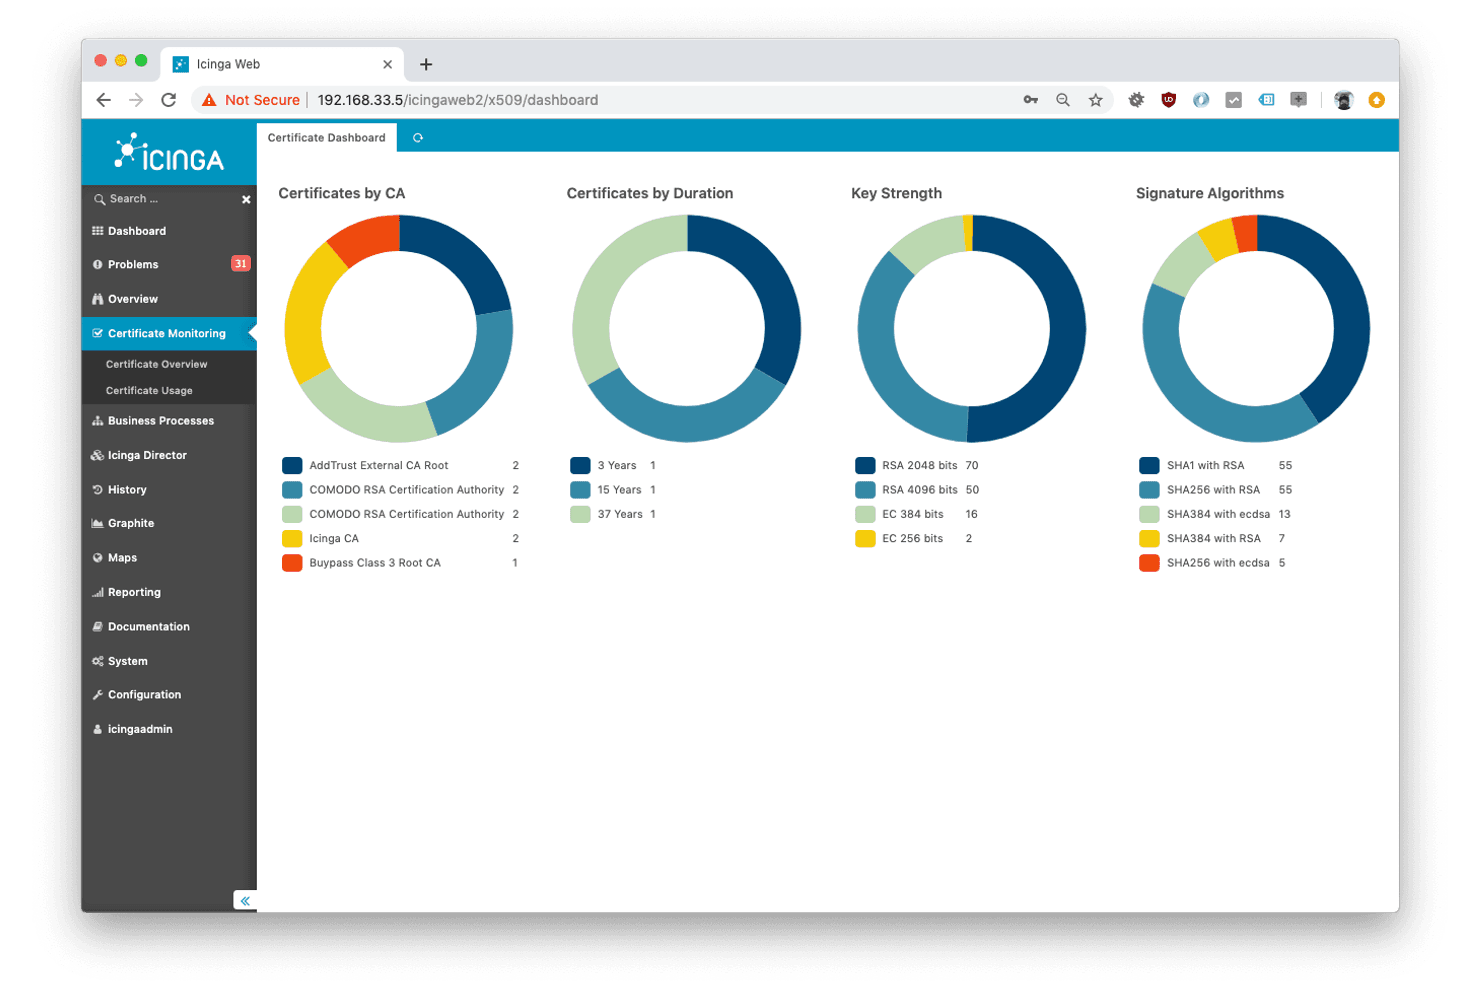
Icinga supervisa la salud de la infraestructura y detecta problemas de rendimiento. Icinga es una solución de monitoreo diseñada para profesionales de TI que gestionan infraestructuras complejas. Las alertas automatizadas, la visualización de datos y las funciones de escalabilidad ayudan a identificar problemas, optimizar el uso de recursos y mantener la fiabilidad del sistema.
Por qué es una buena alternativa a Zabbix: Su arquitectura modular permite una personalización extensa y el monitoreo autogestionado, por lo que es ideal para entornos de TI intrincados. A diferencia de Zabbix, Icinga ofrece opciones de configuración flexibles que se adaptan a las necesidades específicas de tu infraestructura. La capacidad de crear un sistema de monitoreo eficiente para entornos de gran escala distingue a esta solución. Con su enfoque en la escalabilidad, puedes ampliar el monitoreo a medida que crece tu infraestructura.
Características destacadas e integraciones:
Características incluyen monitoreo distribuido, paneles personalizables y mecanismos de alertas avanzados. El monitoreo distribuido permite supervisar múltiples ubicaciones desde una sola plataforma. Los paneles personalizables te dan control sobre cómo visualizas tus datos.
Integraciones incluyen Grafana, Prometheus, Elastic, AWS, Azure, Docker, Kubernetes, Puppet, Ansible, Chef y más.
Pros and Cons
Pros:
- Solución altamente escalable
- Configuración flexible con control detallado
- Sólido soporte para entornos complejos y distribuidos
Cons:
- Plantillas integradas limitadas
- Configuración manual compleja
Learn more about Icinga: Ideal para monitoreo predefinido de servicios en la nube
- Prueba gratuita de 14 días
- Desde $15/host/mes (facturado anualmente)
Visit WebsiteCustomer Rating:4.5/5
Datadog analiza métricas, registros y trazas en los sistemas en la nube. Datadog es una plataforma de monitoreo y análisis utilizada por equipos de TI y DevOps para supervisar aplicaciones e infraestructura en la nube. Ayuda a las empresas a rastrear métricas de rendimiento, registros y trazas para garantizar la fiabilidad del sistema.
Por qué es una buena alternativa a Zabbix: Las capacidades de integración en la nube de Datadog la hacen ideal para equipos que utilizan diversos servicios en la nube. Su plataforma unificada permite supervisar aplicaciones, registros y métricas en un solo lugar, lo cual es esencial para los entornos de TI modernos. El enfoque en entornos nativos de la nube ofrece flexibilidad y facilidad para gestionar tus recursos en la nube.
Características e integraciones destacadas:
Características incluyen paneles interactivos en tiempo real, detección de anomalías y alertas basadas en aprendizaje automático. Los paneles en tiempo real proporcionan una vista clara de la salud de tu sistema. La detección de anomalías te ayuda a identificar patrones inusuales antes de que se conviertan en problemas.
Integraciones incluyen AWS, Azure, Google Cloud, Docker, Kubernetes, Slack, PagerDuty, GitHub, Jira, Terraform y más.
Pros and Cons
Pros:
- Amplias integraciones con herramientas en la nube y SaaS
- Plataforma de monitoreo unificada
- Supervisión de aplicaciones e insights
Cons:
- Los costes pueden aumentar rápidamente a gran escala
- Precios y seguimiento de uso complejos
 Mejor opción para métricas en tiempo real sin configuración
- Prueba gratuita de 14 días + plan gratuito + demo gratuita disponible
- Desde $4.50/nodo/mes (facturado anualmente)
Visit WebsiteCustomer Rating:4.8/5
Netdata monitorea el rendimiento del sistema con información de salud en tiempo real. Netdata es una solución de monitoreo diseñada para profesionales de TI y equipos DevOps que necesitan datos en tiempo real para gestionar su infraestructura. Ofrece información sobre el rendimiento del sistema y métricas de salud, ayudando a los equipos a identificar y resolver problemas rápidamente.
Por qué es una buena alternativa a Zabbix: Con monitoreo en tiempo real, paneles interactivos y visualización dinámica de datos, Netdata ofrece información inmediata para respaldar la toma de decisiones rápidas. A diferencia de Zabbix, Netdata presenta representaciones visuales de datos más intuitivas, lo que facilita a los equipos la comprensión del rendimiento del sistema. El enfoque de la plataforma en el análisis en tiempo real te ayuda a detectar los problemas cuando ocurren. Su interfaz intuitiva y fácil de usar proporciona una experiencia más fluida para el seguimiento y diagnóstico de incidencias.
Características destacadas e integraciones:
Características incluyen detección automática de anomalías, alarmas personalizables y métricas detalladas de salud del sistema. Puedes acceder a una amplia variedad de capacidades de monitoreo de infraestructura adaptadas a diferentes necesidades. La plataforma está diseñada para ofrecer información continua sin abrumarte con datos innecesarios.
Integraciones incluyen AWS, Azure, Google Cloud, Kubernetes, Docker, Slack, PagerDuty, Opsgenie, Prometheus, Grafana y más.
Pros and Cons
Pros:
- Métricas del sistema en tiempo real y por segundo
- Auto-descubrimiento sin necesidad de configuración
- Agente ligero con bajo consumo de recursos
Cons:
- Almacenamiento limitado de datos históricos
- Las funciones avanzadas requieren conocimientos técnicos
Learn more about Netdata: Mejor opción para lógica de monitoreo personalizada mediante complementos
- Demo gratuita + plan gratis disponible
- Desde $2,595/100 nodos
Visit WebsiteCustomer Rating:4.3/5
Nagios supervisa el tiempo de actividad del sistema y alerta a los equipos sobre problemas de rendimiento. Nagios es una solución de monitoreo utilizada principalmente por profesionales de TI y administradores de sistemas para supervisar sistemas de red, servidores y aplicaciones. Las alertas automáticas, la visualización de datos y las funciones de escalabilidad ayudan a identificar problemas, optimizar recursos y mantener la fiabilidad del sistema.
Por qué es una buena alternativa a Zabbix: Nagios ofrece una amplia gama de complementos que pueden personalizarse para monitorizar diversos entornos. Esta flexibilidad lo hace ideal para equipos con configuraciones de TI únicas o complejas. Puede crear e implementar complementos para adaptarse a distintas necesidades, lo que mejora la adaptabilidad.
Características destacadas e integraciones:
Características incluyen alertas en tiempo real, recopilación de datos de rendimiento y paneles personalizables. Las alertas en tiempo real te mantienen informado sobre posibles problemas a medida que ocurren. Los paneles personalizables te permiten crear una vista de monitoreo ajustada a tus preferencias.
Integraciones incluyen AWS, Azure, VMware, Docker, Slack, PagerDuty, ServiceNow, Splunk, Elasticsearch, Jira y más.
Pros and Cons
Pros:
- Herramienta madura y de código abierto
- Amplia personalización para la lógica de monitoreo
- Gran ecosistema y comunidad de complementos y APIs
Cons:
- Interfaz desactualizada
- Configuración y mantenimiento manual
Learn more about Nagios: Mejor por su modelo de observabilidad basado en el uso
- Plan gratuito disponible
- Desde $49/usuario/mes
Visit WebsiteCustomer Rating:4.3/5
New Relic detecta problemas de rendimiento de las aplicaciones rápidamente. New Relic es una herramienta de monitoreo del rendimiento de aplicaciones utilizada por desarrolladores y equipos de TI para rastrear y optimizar el rendimiento de las aplicaciones. Te ayuda a obtener información sobre tus aplicaciones, la infraestructura y la experiencia del cliente.
Por qué es una buena alternativa a Zabbix: New Relic proporciona información detallada sobre el rendimiento de las aplicaciones con un enfoque en la experiencia del usuario. Sus análisis en tiempo real te permiten monitorizar continuamente la salud y el rendimiento de las aplicaciones. El modelo de precios basado en el uso ofrece flexibilidad para los equipos que buscan gestionar los costos de manera eficaz. Este modelo de precios permite que tu equipo amplíe los esfuerzos de monitoreo en función del uso, optimizando la eficiencia de costos.
Características destacadas e integraciones:
Características incluyen análisis en tiempo real, seguimiento distribuido y capacidades AIOps. Los análisis en tiempo real ofrecen información instantánea sobre el rendimiento de la aplicación. El seguimiento distribuido te ayuda a rastrear solicitudes entre servicios para identificar cuellos de botella.
Integraciones incluyen AWS, Azure, Google Cloud, Kubernetes, Docker, Slack, PagerDuty, Jira, ServiceNow, GitHub y más.
Pros and Cons
Pros:
- Flexibilidad en precios según el uso
- Monitoreo sólido del rendimiento de aplicaciones
- Enfoque en la experiencia del usuario
Cons:
- Los costos mensuales varían según el volumen de consulta e ingestión de datos
- Interfaz de usuario con muchas funciones
Learn more about New Relic: Ideal para monitorización integral y rentable
- Plan gratuito + demo gratuita disponible
- Desde $29/licencia/mes

Better Stack monitoriza el tiempo de actividad y la fiabilidad. Better Stack es una plataforma de observabilidad utilizada por profesionales de TI y equipos de DevOps para monitorizar infraestructuras y aplicaciones. Se centra en la gestión de incidentes, el monitoreo de disponibilidad y la gestión de registros para ayudar a los equipos a mantener la fiabilidad del sistema.
Por qué es una buena alternativa a Zabbix: Su precio competitivo la convierte en una excelente opción para gestionar los gastos mientras se mantiene la calidad del monitoreo. A diferencia de Zabbix, Better Stack cuenta con un seguimiento de errores impulsado por IA y un almacén de datos ClickHouse sin servidor, lo que te permite analizar datos sin estar atado a un proveedor. La interfaz fácil de usar de la plataforma simplifica los procesos de monitoreo para tu equipo. Funcionalidades como la gestión de incidentes y el monitoreo de disponibilidad ofrecen un control exhaustivo a un costo menor.
Funcionalidades e integraciones destacadas:
Funcionalidades incluyen análisis automático de la causa raíz, herramientas visuales de investigación y notificaciones de alerta ilimitadas. El análisis automático de la causa raíz ayuda a tu equipo a identificar y resolver rápidamente los problemas. Las herramientas visuales de investigación ofrecen una visión clara de las solicitudes lentas y los errores.
Integraciones incluyen Slack, Microsoft Teams, Jira, OpenTelemetry, Prometheus, AWS, Azure, Google Cloud, GitHub, PagerDuty y más.
Pros and Cons
Pros:
- Combina monitoreo de disponibilidad, registros y respuesta a incidentes
- Funciones de seguimiento de errores impulsadas por IA
- Interfaz de usuario simple y moderna
Cons:
- Conjunto de funciones limitado para grandes empresas
- Análisis avanzados limitados
Learn more about Better Stack: Ideal para ELK gestionado con configuración guiada
- Prueba gratuita de 14 días + demo gratuita disponible
- Desde $9/mes (facturado anualmente)
Visit WebsiteCustomer Rating:4.5/5
Logit.io agrupa los datos de observabilidad en un solo lugar. Logit.io es una plataforma de observabilidad gestionada diseñada para profesionales de TI y equipos de DevOps, enfocada en la gestión de registros y el monitoreo del rendimiento de aplicaciones. Centraliza registros, métricas y trazas, ayudando a los equipos a monitorear y analizar datos de varias fuentes.
Por qué es una buena alternativa a Zabbix: Su enfoque en la facilidad de uso hace que Logit.io sea accesible para equipos que buscan soluciones de monitoreo sencillas. Su interfaz intuitiva con paneles personalizables te ayuda a visualizar los datos. El análisis de datos en tiempo real y las alertas avanzadas permiten estar al tanto de los problemas sin la complejidad añadida. Los servicios gestionados de la plataforma significan que pasarás menos tiempo en la configuración y el mantenimiento.
Características destacadas e integraciones:
Características incluyen análisis de datos en tiempo real, alertas avanzadas y paneles personalizables. El análisis de datos en tiempo real te proporciona la información más actualizada al instante. Las alertas avanzadas te mantienen informado sobre posibles incidencias a medida que surgen.
Integraciones incluyen OpenSearch, Grafana, Prometheus, AWS, Azure, Google Cloud, Elasticsearch, Logstash, Kibana, OpenTelemetry y más.
Pros and Cons
Pros:
- Entornos gestionados de ELK y OpenSearch
- Interfaz fácil de usar
- Configuración guiada y proceso de incorporación simplificado
Cons:
- Las actualizaciones gestionadas pueden retrasarse ocasionalmente
- No es tan personalizable como los entornos autogestionados
Learn more about Logit.io: Ideal para el descubrimiento automático de redes SNMP
- Demo gratuita disponible
- Gratis para usar

LibreNMS mapea métricas de rendimiento de red. LibreNMS es una herramienta de monitoreo de redes utilizada por administradores y profesionales de TI para supervisar y gestionar dispositivos de red. Proporciona información sobre el rendimiento de la red y ayuda a mantener operaciones eficientes.
Por qué es una buena alternativa a Zabbix: LibreNMS es compatible con una variedad de protocolos de red para habilitar la detección y el monitoreo de dispositivos. Sus funciones de descubrimiento automático de red facilitan al equipo la gestión de una amplia gama de dispositivos. La herramienta ofrece alertas personalizables, para que te mantengas informado de los problemas de red en tiempo real. Su enfoque en el descubrimiento de red te permite gestionar dispositivos en entornos dinámicos de forma eficiente.
Características destacadas e integraciones:
Características incluyen gráficos de rendimiento detallados, alertas personalizables y una interfaz compatible con dispositivos móviles. Los gráficos de rendimiento detallados te ayudan a visualizar los datos de la red de manera efectiva. Las alertas personalizables te ayudan a recibir solo las notificaciones que te interesan.
Integraciones incluyen Slack, PagerDuty, Opsgenie, Microsoft Teams, VictorOps, Webex Teams, Mattermost, Discord y más.
Pros and Cons
Pros:
- Descubrimiento automático de dispositivos de red mediante SNMP
- Amplio soporte para una gran variedad de hardware de red
- Actualizaciones y complementos impulsados por la comunidad
Cons:
- Requiere conocimientos de SNMP para la configuración inicial
- Capacidades limitadas de monitoreo de aplicaciones y servidores
Learn more about LibreNMS: 10Ideal para observabilidad de código abierto
SigNoz
- Prueba gratuita de 30 días + demo gratuita disponible
- Desde $49/mes

SigNoz detecta cuellos de botella en el rendimiento de la aplicación. SigNoz es una plataforma de observabilidad que ayuda a los desarrolladores y equipos de DevOps a monitorear y solucionar problemas de aplicaciones. Proporciona información detallada sobre el rendimiento de las aplicaciones y ayuda en la identificación y resolución de problemas.
Por qué es una buena alternativa a Zabbix: SigNoz se enfoca en proporcionar información profunda a nivel de aplicación, lo que la hace adecuada para equipos enfocados en el rendimiento de las aplicaciones. Sus herramientas de observabilidad de código abierto facilitan a los equipos personalizar y ampliar sus capacidades de monitoreo. SigNoz ofrece características como rastreo distribuido y gestión de logs para mejorar la visibilidad. Gracias a su naturaleza de código abierto, puedes adaptar la plataforma según tus necesidades específicas.
Características destacadas e integraciones:
Funciones incluyen rastreo distribuido, paneles personalizables y gestión de logs en tiempo real. El rastreo distribuido te ayuda a seguir las solicitudes a través de los servicios e identificar los cuellos de botella. Los paneles personalizables te permiten visualizar métricas clave de la forma que mejor se adapte al flujo de trabajo de tu equipo.
Integraciones incluyen Prometheus, Grafana, OpenTelemetry, Kubernetes, Docker, AWS, Azure, Google Cloud, Elastic, Slack y más.
Pros and Cons
Pros:
- Observabilidad de código abierto con plena propiedad de los datos
- Información profunda a nivel de aplicación nativa
- Rastreo y métricas con OpenTelemetría
Cons:
- Requiere experiencia técnica y operativa para gestionar
- Ecosistema más pequeño que las plataformas comerciales
Learn more about SigNoz:
Otras alternativas a Zabbix
Estas son algunas alternativas adicionales a Zabbix que no llegaron a mi lista breve, pero que merece la pena conocer:
- 11CheckmkIdeal para monitorización de alto rendimiento a gran escala
- 12Auvik Network ManagementMejor para el mapeo automatizado de redes e inventario
- 13ExabeamMejor para la detección de seguridad basada en UEBA
- 14Last9Ideal para SLO y la ingeniería de confiabilidad
Cómo evalúo las alternativas a Zabbix
Divido mi evaluación en dos niveles: requisitos básicos—SNMP, métricas de series temporales, alertas—y diferenciadores como AIOps, flexibilidad de despliegue y multi-tenencia de nivel MSP.
Funcionalidad básica (imprescindibles para esta lista)
Al seleccionar herramientas para mi lista, califico cada una en una escala de 0 (no ofrece la funcionalidad) a 5 (destaca en esta área) para cada una de las funcionalidades básicas que aparecen a continuación. Luego, calculo la puntuación total de la herramienta en un porcentaje. Cada herramienta debe alcanzar una puntuación total mínima del 65% para ser considerada.
- Monitoreo de infraestructura: Verifico si una herramienta cubre servidores, máquinas virtuales, contenedores e instancias en la nube, en entornos híbridos—no solo un tipo de recurso en aislamiento.
- Recopilación y almacenamiento de métricas: Los métodos de recopilación son clave aquí, desde agentes hasta SNMP y la ingesta basada en API, junto con el tiempo de retención de los datos históricos.
- Alertas y notificaciones: Evalúo la configuración de umbrales, las políticas de escalado y el direccionamiento a canales como Slack, PagerDuty o correo electrónico para los equipos de guardia.
- Paneles y visualización: Los buenos paneles van más allá de los gráficos estáticos. Busco vistas personalizables, mapas de topología y la capacidad de profundizar en hosts o servicios específicos.
- Monitoreo de red: Las herramientas deben soportar sondeo SNMP, descubrimiento de dispositivos y seguimiento de disponibilidad para switches, routers y firewalls, como mínimo.
- Integraciones y extensibilidad: Analizo la calidad de las API, conectores preconstruidos para herramientas ITSM y ChatOps, y si existe un ecosistema de complementos o plantillas.
Una vez que tengo una lista de herramientas que cumplen con este criterio, considero qué diferencia a cada plataforma.
Factores diferenciadores (lo que distingue a los proveedores)
Así es como comparo y contrasto los distintos proveedores:
Características destacadas
Las funcionalidades de AIOps marcan una verdadera diferencia cuando se monitorean miles de hosts. Las herramientas que establecen una línea base de comportamiento normal y suprimen el ruido ahorran fatiga de alertas a los equipos de guardia. También evalúo si una plataforma correlaciona registros con métricas en una sola vista, lo que acelera el análisis de causa raíz durante las caídas. Para los MSP y grandes empresas que gestionan múltiples clientes o unidades de negocio, la multi-tenencia con control detallado de acceso (RBAC fino) determina si una plataforma puede reemplazar varias instancias aisladas.
Más allá de las características
El modelo de despliegue es fundamental. Algunos equipos requieren una opción totalmente autogestionada para cumplir con políticas internas de seguridad, mientras que otros prefieren SaaS para evitar gestionar otra pila local. La estructura de precios es igual de importante—el precio por host puede escalar rápidamente cuando se expanden a contenedores o grupos en la nube de escalado automático. También evalúo qué tan bien escala horizontalmente una plataforma, especialmente para equipos distribuidos que ejecutan proxies en múltiples centros de datos. Finalmente, el soporte para migrar desde Zabbix (documentación, herramientas de importación, guías de la comunidad) puede ahorrar semanas de transición.
¿Por qué buscar una alternativa a Zabbix?
Aunque Zabbix es una buena opción para una solución de monitorización de código abierto, hay varias razones por las que algunos usuarios buscan alternativas. Puede que estés buscando una alternativa a Zabbix porque…
- Necesitas un proceso de configuración más sencillo
- Tu equipo quiere paneles más intuitivos
- Necesitas una mejor integración con la nube
- La escalabilidad es una preocupación para tu empresa en crecimiento
- Necesitas opciones de alertas más flexibles
- Tu equipo necesita amplias posibilidades de personalización
Si alguna de estas situaciones te resulta familiar, has llegado al lugar adecuado. Mi lista incluye varias opciones de monitorización de código abierto más adecuadas para equipos que se enfrentan a estos desafíos con Zabbix y buscan soluciones alternativas.
Funciones
Estas son algunas de las funciones principales de Zabbix, que te ayudarán a contrastar y comparar lo que ofrecen las soluciones alternativas:
- Monitoreo detallado: Supervisa redes, servidores, servicios en la nube y aplicaciones para recopilar diversas métricas.
- Detección de problemas en tiempo real: Automatiza la detección, la identificación de anomalías y las alertas personalizables para una gestión proactiva.
- Visualización y generación de informes: Ofrece paneles personalizables, mapas geográficos e informes programados para una representación eficaz de los datos.
- Integración y escalabilidad: Se integra con diversos sistemas de TI y admite el monitoreo distribuido mediante proxies.
- Gestión de usuarios e implementación: Proporciona aprovisionamiento de usuarios justo a tiempo, opciones de implementación rápida y despliegue automático de agentes.
- Capacitación y asistencia de la comunidad: Incluye programas de capacitación estructurados, participación de la comunidad y servicios profesionales para mejorar la competencia de los usuarios.
- Monitoreo basado en agentes y sin agentes: Admite tanto el monitoreo basado en agentes como el monitoreo sin agentes mediante diversos protocolos.
- Monitoreo sintético: Emula transacciones reales para aplicaciones web con el fin de realizar un seguimiento de las métricas de rendimiento.
- Transformación de datos: Normaliza y optimiza los datos para una gestión y un análisis eficientes.
- Detección inteligente de problemas: Utiliza umbrales inteligentes y aprendizaje automático para detectar problemas al instante y predecir tendencias.
¿Qué sigue?
Si estás investigando una solución de monitoreo de código abierto, ponte en contacto con un asesor de SoftwareSelect para recibir recomendaciones gratuitas.
Rellenas un formulario y mantienes una breve conversación en la que se profundiza en los detalles de tus necesidades. Después recibirás una lista breve de programas para revisar. Incluso te ayudarán durante todo el proceso de compra, incluidas las negociaciones de precios.