10 Best Log Analysis Tools Shortlist
Navigating through log files, especially across operating systems like Windows and intricate firewalls, demands a solid log analyzer. These log analysis software tools turn system logs, server logs, and application logs, using indexing to ingest and streamline massive amounts of data. Features such as real-time alerts, predefined normalization techniques, and specialized plugins make log collection effortless.
Beyond acting as a simple event manager, a good log management solution offers graphs from metrics, ensuring logs, whether from a web server or elsewhere, are user-friendly. These tools are crucial for filtering log messages, offering invaluable insights, and ensuring easy communication in today's digital world.
Why Trust Our Software Reviews
We’ve been testing and reviewing software since 2023. As tech leaders ourselves, we know how critical and difficult it is to make the right decision when selecting software.
We invest in deep research to help our audience make better software purchasing decisions. We’ve tested more than 2,000 tools for different tech use cases and written over 1,000 comprehensive software reviews. Learn how we stay transparent & our software review methodology.
Best Log Analysis Tools Summary
This comparison chart summarizes pricing details for my top log analysis tools selections to help you find the best one for your budget and business needs.
| Tool | Best For | Trial Info | Price | ||
|---|---|---|---|---|---|
| 1 | Best for detailed error context | Free plan + free trial + free demo available | From $26/month (billed annually) | Website | |
| 2 | Best for real-time log monitoring | Free demo available | From $0.09/GB/month | Website | |
| 3 | Best for machine learning-based UEBA | Free demo available | Pricing upon request | Website | |
| 4 | Best for real-time log anomaly detection | 14-day free trial + free demo available | From $0.05/GB | Website | |
| 5 | Best for AI-driven application performance | Free demo + 15-day free trial available | From $7/host/month | Website | |
| 6 | Best for integrated platform monitoring | Free demo + 14-day free trial available | From $15/host/month (billed annually) | Website | |
| 7 | Best for cloud-based infrastructure monitoring | Free 15-day trial | From $16/hybrid unit/month | Website | |
| 8 | Best for developer-centric insights | Free trial + free demo available | Pricing upon request | Website | |
| 9 | Best for continuous intelligence capabilities | 30-day free trial | Pricing upon request | Website | |
| 10 | Best for end-to-end application insights | Free demo available | From $21.20/MVS/month | Website |
-

Site24x7
Visit WebsiteThis is an aggregated rating for this tool including ratings from Crozdesk users and ratings from other sites.4.7 -

GitHub Actions
Visit WebsiteThis is an aggregated rating for this tool including ratings from Crozdesk users and ratings from other sites.4.8 -

Docker
Visit WebsiteThis is an aggregated rating for this tool including ratings from Crozdesk users and ratings from other sites.4.6
Best Log Analysis Tools Reviews
Below are my detailed summaries of the best log analysis tools that made it onto my shortlist. My reviews offer a detailed look at the key features, pros & cons, integrations, and ideal use cases of each tool to help you find the best one for you.
For developers and IT professionals seeking a log analysis tool, Sentry offers a compelling solution tailored to meet your needs. It provides real-time insights into application behavior with detailed error context, helping teams quickly identify and resolve issues. By integrating with platforms like GitHub and Slack, Sentry supports smoother collaboration while improving application reliability and user experience.
Why I Picked Sentry
I picked Sentry for its ability to provide detailed error context directly within log analysis workflows. It shows where an error occurred, the environment in which it occurred, and the exact code involved, helping teams troubleshoot issues faster and with greater accuracy. Its integrations with tools like Slack and Jira also help teams stay aligned and respond quickly when issues surface.
Sentry Key Features
In addition to a detailed error context, Sentry offers:
- Session Replay: Provides a visual playback of user interactions, helping you understand the user journey and pinpoint issues.
- Tracing: Offers detailed performance data and traces requests across services to identify bottlenecks.
- Code Coverage: Analyzes code execution paths to ensure thorough testing and debugging.
Sentry Integrations
Integrations include GitHub, Slack, Jira, GitLab, Bitbucket, Trello, Microsoft Teams, PagerDuty, Opsgenie, and Datadog.
Pros and Cons
Pros:
- Distributed tracing shows transaction-level performance insights
- Offers real-time error tracking across web, mobile, and backend apps
- Advanced error grouping helps prioritize issues for fast resolution
Cons:
- Limited alerts and applications insights in lower-tier plans
- Not all integrations are available natively, relying on third-party APIs for some
New Product Updates from Sentry
Sentry Adds AI Dashboard Generation in Beta
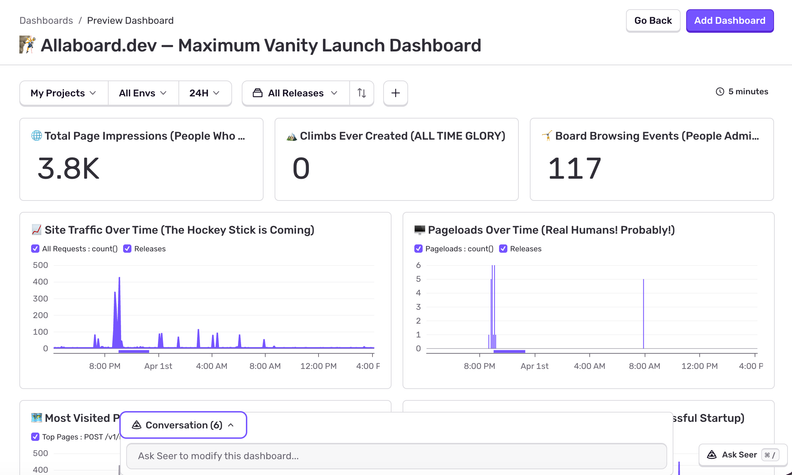
Sentry introduces AI Dashboard Generation in beta, enabling users to create dashboards using prompts through an agent. This makes dashboard setup faster and easier without manual configuration. For more information, visit Sentry’s official site.
Logmanager is a log analysis and SIEM platform that centralizes log collection with zero-loss aggregation via TCP. It lets you search, filter, and visualize logs in real time while using custom tagging and enrichment to speed up investigations and ensure compliant, tamper-proof retention.
Why I Picked Logmanager:
I picked Logmanager because it provides instant visibility into your infrastructure through real-time log monitoring and dynamic dashboards. This helps you detect performance or security issues the moment they appear, giving your team more time to respond. I also appreciate its support for over 140 log sources, allowing you to unify system logs, network activity, and application events in one view. For teams focused on compliance and operational resilience, Logmanager’s reliable data availability and audit-ready reporting make it a strong all-around choice.
Logmanager standout features and integrations:
Features include customizable dashboards for centralized observability, high-availability storage to preserve log data, and built-in compliance reports to support audits and regulatory requirements. The tool also offers no-code configuration for easy setup and contextual log enrichment for deeper insights. Integrations include Apache, Cisco, Microsoft, VMware, Fortinet, IBM, HP, Juniper, Symantec, ESET, NGINX, and MySQL.
Pros and Cons
Pros:
- Centralized log monitoring and alerting
- Log data enrichment with contextual information
- Built-in compliance reporting
Cons:
- Advanced customization can be complex
- Limited SaaS deployment options
ManageEngine Log360 is a Security Information and Event Management (SIEM) solution that consolidates log analysis, threat detection, and compliance reporting into one unified platform. It’s designed for organizations that need both real-time security monitoring and robust compliance capabilities across diverse IT environments.
Why I Picked ManageEngine Log360:
I selected ManageEngine Log360 because of its broad integration of security, compliance, and user behavior analytics in one centralized tool. Unlike other solutions that specialize in a single aspect of log analysis, Log360 offers a balanced combination of threat detection, file integrity monitoring, and compliance reporting. Its machine learning-based UEBA (User and Entity Behaviour Analytics) sets it apart by proactively identifying anomalies that traditional rule-based systems might miss.
Standout Features and Integrations:
ManageEngine Log360 provides real-time security monitoring, Active Directory auditing, file integrity tracking, and security orchestration (SOAR). It features intuitive dashboards, global threat intelligence, and built-in DLP and CASB tools. It integrates seamlessly with other ManageEngine products and platforms like Veeam, Nginx, Cisco, and Fortinet.
Pros and Cons
Pros:
- File integrity monitoring
- User-friendly dashboards
- Real-time security management
Cons:
- Complex initial setup
- Slower with large datasets
New Product Updates from ManageEngine Log360
ManageEngine Log360 Adds New Log Source Integrations
ManageEngine Log360 introduced new integration support for NetFlow Analyzer and Firewall Analyzer, along with enhanced audit log parsing for OpManager products. The updates help teams centralize log collection and improve monitoring and analysis workflows. For more information, visit ManageEngine Log360's official site.
Coralogix offers a specialized log management platform, emphasizing the real-time detection of anomalies within vast logs. The tool ensures timely interventions by facilitating quick detection and identification of irregular patterns, aligning perfectly with its reputation for exceptional log anomaly detection.
Why I Picked Coralogix:
In my search for outstanding log management tools, I gravitated toward Coralogix because of its singular focus on real-time anomaly detection. By comparing and judging various tools, I formed the opinion that Coralogix stands out because it is not just about tracking logs but about understanding them in real time. This determination cemented my belief that it is the "Best for real-time log anomaly detection."
Standout features and integrations:
At the core of Coralogix's capabilities are features like ML-powered anomaly detection, instant visualizations, and alert mechanisms that ensure swift responses. Regarding integrations, Coralogix pairs well with platforms such as Kubernetes, AWS, and Slack, further enhancing its real-time response capabilities.
Pros and Cons
Pros:
- Strong integration with popular platforms enhances real-time capabilities
- Rich visualization aids in the easy interpretation of logs
- Effective ML-powered anomaly detection
Cons:
- Detailed features might come with a learning curve
- Larger datasets may require more resources for processing
- The interface might appear complex for beginners
Dynatrace offers an advanced monitoring solution, leveraging AI to provide insights into application performance across varied environments. Its focus on AI-driven analytics ensures that businesses can anticipate, identify, and address performance issues with a precision that traditional tools might miss.
Why I Picked Dynatrace:
While selecting monitoring tools, Dynatrace caught my attention due to its distinct emphasis on artificial intelligence. Comparing it with other solutions, it became evident that Dynatrace offers a unique approach to application performance management, utilizing AI for deeper, proactive insights. I judged it as the "Best for AI-driven application performance."
Standout features and integrations:
Key features of Dynatrace include real-time AI analytics, automatic root cause determination, and full-stack monitoring, making it a holistic solution for complex applications. Regarding integrations, Dynatrace effectively connects with platforms such as AWS, Azure, and Google Cloud, enabling businesses to monitor applications across diverse cloud environments.
Pros and Cons
Pros:
- Efficient root cause determination accelerates issue resolution
- Full-stack monitoring covers all facets of applications
- AI-driven analytics provide proactive insights
Cons:
- Some advanced features come with a steep learning curve
- Pricing can be a barrier for smaller organizations
- Initial setup might require expert guidance
Datadog is a comprehensive monitoring service that gathers information from various sources, synthesizing it for clear observation and action. Datadog provides detailed insights across full-stack observability, from infrastructure to applications.
Why I Picked Datadog:
I choose Datadog for its holistic approach to monitoring. Among the plethora of tools I reviewed, Datadog had a distinct appeal due to its expansive capabilities. Furthermore, when considering the pivotal need for an integrated monitoring platform, Datadog fits the bill perfectly, emphasizing harmonizing varied metrics under one unified platform.
Standout features and integrations:
Datadog unifies infrastructure metrics, traces, and logs, with Anomaly Detection to spot irregularities. It integrates with various cloud providers, databases, and tools like Slack and Microsoft Teams, making it adaptable for any business environment.
Pros and Cons
Pros:
- Advanced anomaly detection
- Full-stack observability
- Extensive integration capabilities
Cons:
- Some users report occasional latency in alerts
- Limited customization for dashboards
- Steeper learning curve for beginners
LogicMonitor stands out as a comprehensive SaaS-based performance monitoring platform. Designed for the modern IT environment, this tool deepens into cloud, hybrid, and on-premises infrastructures, delivering detailed insights and timely alerts.
Why I Picked LogicMonitor:
Pinpointing a tool that covers the full breadth of IT infrastructures required careful determination. LogicMonitor consistently rose to the top of my list when comparing various platforms due to its specialized focus on cloud infrastructures. Given the growing reliance on cloud solutions, I'm convinced that LogicMonitor is rightfully "Best for cloud-based infrastructure monitoring."
Standout features and integrations:
Key features of LogicMonitor include automatic device discovery, which eases the setup process, and forecasting analytics, providing projections based on past data. On the integrations front, LogicMonitor offers connections with popular platforms such as ServiceNow, Slack, and Puppet, streamlining the information flow and enhancing collaboration within IT teams.
Pros and Cons
Pros:
- Rich library of integrations with leading IT tools
- Robust automatic discovery and forecasting tools
- Comprehensive coverage of cloud, hybrid, and on-premises infrastructures
Cons:
- Requires initial configuration for tailored monitoring
- Pricing structure can be confusing for some users
- The interface may seem complex for beginners
New Relic has established itself as an industry-leading application performance management platform, focusing on giving teams insights into their software's performance and behavior.
Why I Picked New Relic:
New Relic was an undeniable choice when selecting a tool that offers insights tailored to developers. It distinguished itself with its developer-focused telemetry data and the granularity of its insights. How it provides developers with the necessary tools and data, equipping them to make informed decisions, solidified my opinion that it's genuinely "Best for developer-centric insights."
Standout features and integrations:
Real-time application monitoring is at the heart of New Relic's offerings, providing a clear view of how applications behave and perform. Furthermore, the platform boasts features such as distributed tracing and error tracking, ensuring developers can pinpoint issues precisely. Integrations-wise, New Relic connects well with platforms like AWS, Azure, and Google Cloud, along with collaboration tools such as Slack and Jira.
Pros and Cons
Pros:
- Developer-focused features facilitate precise troubleshooting
- Comprehensive integrations with cloud platforms and team collaboration tools
- Real-time monitoring provides up-to-the-minute insights
Cons:
- Pricing can be prohibitive for smaller teams
- Custom instrumentation can be complex
- Might present a learning curve for newcomers
Sumo Logic is a cloud-based platform for data analytics. It provides insights to help teams be proactive and responsive in dynamic digital environments. It's recognized as "Best for continuous intelligence."
Why I Picked Sumo Logic:
When selecting a tool with unparalleled continuous intelligence prowess, Sumo Logic was a clear frontrunner. Its unique approach to analytics, combined with its dedication to real-time insights, makes it stand out in a crowded field. I believe Sumo Logic epitomizes what "Best for continuous intelligence capabilities" should offer, with its ability to give teams the necessary tools to navigate an ever-evolving digital landscape.
Standout features and integrations:
Central to Sumo Logic's offering is its real-time dashboards that ensure teams have an up-to-date view of their data landscape. Its log management and cloud SIEM features also empower organizations to maintain robust security postures. Regarding integrations, Sumo Logic connects with platforms like AWS, Kubernetes, and Terraform, along with various incident management tools.
Pros and Cons
Pros:
- Cloud-native architecture ensures scalability and flexibility
- Comprehensive integration with cloud platforms and incident management tools
- Real-time dashboards offer a constant view of data dynamics
Cons:
- Query language requires a learning curve for those new to the platform
- Some users may desire more granular control over data parsing
- Can be overwhelming for users unfamiliar with advanced analytics
IBM Instana specializes in comprehensive application performance management, designed to cater to dynamic containerized microservice applications. Its proficiency in delivering unparalleled end-to-end insights into application performance solidifies its position as a prime tool for application insights.
Why I Picked IBM Instana:
While choosing tools for in-depth application insights, IBM Instana emerged as an unmistakable leader. The tool's unique capability to give thorough insights from start to finish in an application's journey affirms my belief that it is "Best for end-to-end application insights."
Standout features and integrations:
IBM Instana offers automatic discovery and monitoring, ensuring no application landscape segment goes unnoticed. It incorporates a cutting-edge AI-powered analysis component, ensuring quick issue detection. On the integrations front, Instana easily combines with tools like Jenkins, Kubernetes, and Docker, to name a few, fostering richer application insight extraction.
Pros and Cons
Pros:
- Comprehensive integrations with key tools and platforms
- Advanced AI component aids in rapid issue identification
- Automatic discovery ensures complete application coverage
Cons:
- High-end features might be overkill for smaller applications
- Requires consistent tuning for specific environments
- The platform can be intricate for beginners
Other Log Analysis Tools
Below is a list of additional log analysis tools that I shortlisted but did not make it to the top 10. Definitely worth checking them out.
- Splunk Enterprises
For large-scale data analytics
- Logz.io
For open-source log management
- Mezmo Log Analysis
For customizable log data visualization
- LogPoint
For threat intelligence integration
- Site24x7
For comprehensive website monitoring
- Sematext Cloud
Good for performance monitoring and logs management
- ManageEngine ADAudit Plus
Good for Active Directory auditing
- Checkmk
Good for comprehensive IT monitoring
- Elastic Stack
Good for real-time search and analytics
- SolarWinds Kiwi Syslog Server
Good for centralized syslog management
- CYREBRO
Good for centralized cybersecurity visibility
- BetterStack
Good for streamlining developer operations
- Google Cloud Logging
Good for deep integration with GCP services
- VMware Aria Operations for Logs
Good for VMware environment monitoring
- Oracle Cloud Infrastructure Logging
Good for robust Oracle ecosystem support
- Panther
Good for automated threat detection
- EventSentry
Good for real-time event log tracking
Log Analysis Tool Selection Criteria
When selecting the best log analysis tools to include in this list, I considered common buyer needs and pain points like managing data volume and ensuring real-time monitoring. I also used the following framework to keep my evaluation structured and fair:
Core Functionality (25% of total score)
To be considered for inclusion in this list, each solution had to fulfill these common use cases:
- Collecting log data from multiple sources
- Analyzing and visualizing log data
- Real-time monitoring and alerting
- Providing search and filtering options
- Ensuring data security and compliance
Additional Standout Features (25% of total score)
To help further narrow down the competition, I also looked for unique features, such as:
- Machine learning analytics
- Customizable dashboards
- Integration with third-party tools
- Multi-language support
- Cloud storage options
Usability (10% of total score)
To get a sense of the usability of each system, I considered the following:
- Intuitive interface design
- Ease of navigation
- Customizable user settings
- Minimal learning curve
- Accessibility on multiple devices
Onboarding (10% of total score)
To evaluate the onboarding experience for each platform, I considered the following:
- Availability of training videos
- Interactive product tours
- Access to templates and guides
- Live webinars and workshops
- Support from chatbots
Customer Support (10% of total score)
To assess each software provider’s customer support services, I considered the following:
- Availability of 24/7 support
- Response time to inquiries
- Access to a knowledge base
- Availability of live chat
- Quality of technical support
Value For Money (10% of total score)
To evaluate the value for money of each platform, I considered the following:
- Competitive pricing plans
- Availability of free trials
- Flexibility in subscription options
- Cost versus features offered
- Discounts for long-term contracts
Customer Reviews (10% of total score)
To get a sense of overall customer satisfaction, I considered the following when reading customer reviews:
- User satisfaction ratings
- Feedback on ease of use
- Comments on customer support
- Experiences with reliability
- Opinions on feature effectiveness
How to Choose a Log Analysis Tool
It’s easy to get bogged down in long feature lists and complex pricing structures. To help you stay focused as you work through your unique software selection process, here’s a checklist of factors to keep in mind:
| Factor | What to Consider |
|---|---|
| Scalability | Can the tool grow with your needs? Consider if it handles increasing data volumes and user numbers without performance dips. |
| Integrations | Does it connect with your existing systems? Ensure it supports APIs or native integrations with tools you already use. |
| Customizability | Can you tailor dashboards and reports to fit your workflow? Look for tools that offer flexible configuration options. |
| Ease of use | Is the interface intuitive for your team? Avoid tools that require extensive training or have a steep learning curve. |
| Implementation and onboarding | How quickly can you get started? Check if the vendor offers support, training materials, and a clear setup process to minimize downtime. |
| Cost | How does pricing align with your budget? Look for transparent pricing models and understand any additional costs for extra features or users. |
| Security safeguards | How does the tool protect your data? Verify encryption standards, access controls, and compliance with data protection regulations. |
| Support availability | When can you reach support? Ensure you have access to timely assistance, whether through 24/7 support or a dedicated account manager for urgent issues. |
What Is A Log Analysis Tool?
Log analysis tools are specialized software designed to analyze and interpret vast volumes of machine-generated log data. These tools aid in identifying patterns, troubleshooting system issues, and uncovering valuable insights from data sources like servers, applications, and network devices. Typically utilized by IT professionals, system administrators, and security experts, these tools are crucial in ensuring system uptime, improving performance, and safeguarding against potential security threats.
Features
When selecting log analysis tools, keep an eye out for the following key features:
- Real-time monitoring: Provides instant insights into system performance, allowing for quick detection and response to issues.
- Data visualization: Offers graphical representations of log data, making it easier to interpret and analyze trends.
- Search and filtering: Enables users to quickly locate specific log entries using keywords or criteria, improving troubleshooting efficiency.
- Alert capabilities: Sends notifications for predefined events or anomalies, helping users to address problems promptly.
- Integration support: Connects with existing software and systems, ensuring seamless data flow and extended functionality.
- Customizable dashboards: Allow users to tailor views and reports to fit their unique workflows and preferences.
- Security safeguards: Protects sensitive log data through encryption and access controls, ensuring compliance with data protection standards.
- Scalability: Accommodates growing data volumes and user numbers without performance degradation, supporting business growth.
- Machine learning analytics: Utilizes AI to identify patterns and predict potential issues, enhancing proactive system management.
- User-friendly interface: Ensures ease of use, reducing the learning curve and facilitating quick adoption by team members.
Benefits
Implementing log analysis tools provides several benefits for your team and your business. Here are a few you can look forward to:
- Improved troubleshooting: Quickly identifies and resolves issues with real-time monitoring and search capabilities.
- Enhanced security: Protects your data with security safeguards and alert features that notify you of suspicious activities.
- Operational efficiency: Increases productivity by reducing time spent on manual log analysis through automation and machine learning analytics.
- Informed decision-making: Offers insights through data visualization, helping you make better strategic decisions.
- Scalability support: Grows with your business needs, accommodating increased data volumes and user demands.
- Custom workflow integration: Fits seamlessly into your existing operations with integration support and customizable dashboards.
- Proactive management: Predicts potential issues using machine learning, allowing teams to address them before they escalate.
Costs and Pricing
Selecting log analysis tools requires an understanding of the various pricing models and plans available. Costs vary based on features, team size, add-ons, and more. The table below summarizes common plans, their average prices, and typical features included in log analysis tools solutions:
Plan Comparison Table for Log Analysis Tools
| Plan Type | Average Price | Common Features |
|---|---|---|
| Free Plan | $0 | Basic data collection, limited storage, and community support. |
| Personal Plan | $5-$25/user/month | Real-time monitoring, basic alerting, and limited integrations. |
| Business Plan | $50-$150/user/month | Advanced analytics, customizable dashboards, and extended support. |
| Enterprise Plan | $200+/user/month | Full integration capabilities, dedicated account management, and comprehensive security features. |
Log Analysis Tools FAQs
Here are some answers to common questions about log analysis tools:
How do log analysis tools handle data from multiple sources?
Log analysis tools collect data from various sources like servers, applications, and network devices. They aggregate this data into a centralized platform, allowing you to view and analyze it in one place. This consolidation helps in identifying patterns and correlations across different systems.
What kind of alerts can I set up with log analysis tools?
Log analysis tools allow you to set up alerts for specific events or anomalies in your data. You can customize these alerts based on thresholds, patterns, or specific log entries. This helps your team respond quickly to potential issues, minimizing downtime and maintaining system reliability.
Can log analysis tools integrate with existing systems?
Yes, most log analysis tools offer integration capabilities with popular systems and applications. They often provide APIs or pre-built connectors to integrate seamlessly with your existing IT infrastructure. This ensures that you can continue using your current systems while benefiting from enhanced log analysis.
What is the learning curve for using log analysis tools?
The learning curve can vary depending on the tool’s complexity and your team’s familiarity with similar software. Many tools offer user-friendly interfaces and comprehensive documentation to ease the learning process. Training resources like tutorials and webinars are also commonly available to help your team get up to speed quickly.
Are there any scalability concerns with log analysis tools?
Scalability is an important factor to consider, and many tools are designed to handle increasing data volumes and user numbers. They can scale up to accommodate your growing needs without performance issues. It’s essential to evaluate each tool’s scalability features to ensure it aligns with your future requirements.
Are there any free log analysis tools available?
Yes, several tools offer free versions or open-source Sumo Logic alternatives. “Elastic Stack” provides a free tier, and there are other open-source solutions like “Logstash” and “Graylog” that offer robust log analysis capabilities without any initial cost. However, free versions might have limitations in terms of features, data volume, or scalability.
What’s Next:
If you're in the process of researching log analysis tools, connect with a SoftwareSelect advisor for free recommendations.
You fill out a form and have a quick chat where they get into the specifics of your needs. Then you'll get a shortlist of software to review. They'll even support you through the entire buying process, including price negotiations.


